
Sigma for forecasting
Own every forecast version
Sigma runs dashboards live on your warehouse, so anyone can drill from a flagged metric to the row without a ticket.
Schedule demoEvery number here is the cost of the process teams run today, before Sigma.
Sigma queries your existing models and views live, so no extract needs a refresh schedule.
Analysts use spreadsheet formulas, SQL, and Python in one workbook, under warehouse permissions.
Business teams follow the path to the row themselves, so the request queue stops growing.
Connect the warehouse. Build in a workbook. Publish the drill path
Every layer runs the same live query, so the number on the dashboard is the number in the table underneath it.
Sigma queries the warehouse when someone opens a workbook, so the number on screen is the number in the source. Filters push down, so scans stay narrow as more people use it.
Publish the path from a summary metric to the row that explains it. Viewers pivot and add calculations on a copy, while the shared data model stays under your control.
The workbook that reports a number can also collect one. Input Tables write edits back with the user and timestamp, and Actions call the systems that finish the job.



Sigma queries your warehouse live, so a workbook reads what landed a moment ago.
Every workbook, report, and agent runs under the roles and row-level security your warehouse already enforces.
Sigma reads your models and views directly, so permissions stay in the warehouse.
Queries run at open against source tables, so there is no refresh window to explain.
Sigma has no model of its own. Point it at your provider, and every AI call is logged.
Each example runs live in the Sigma library, so you can open one, drill in, and copy the pattern.
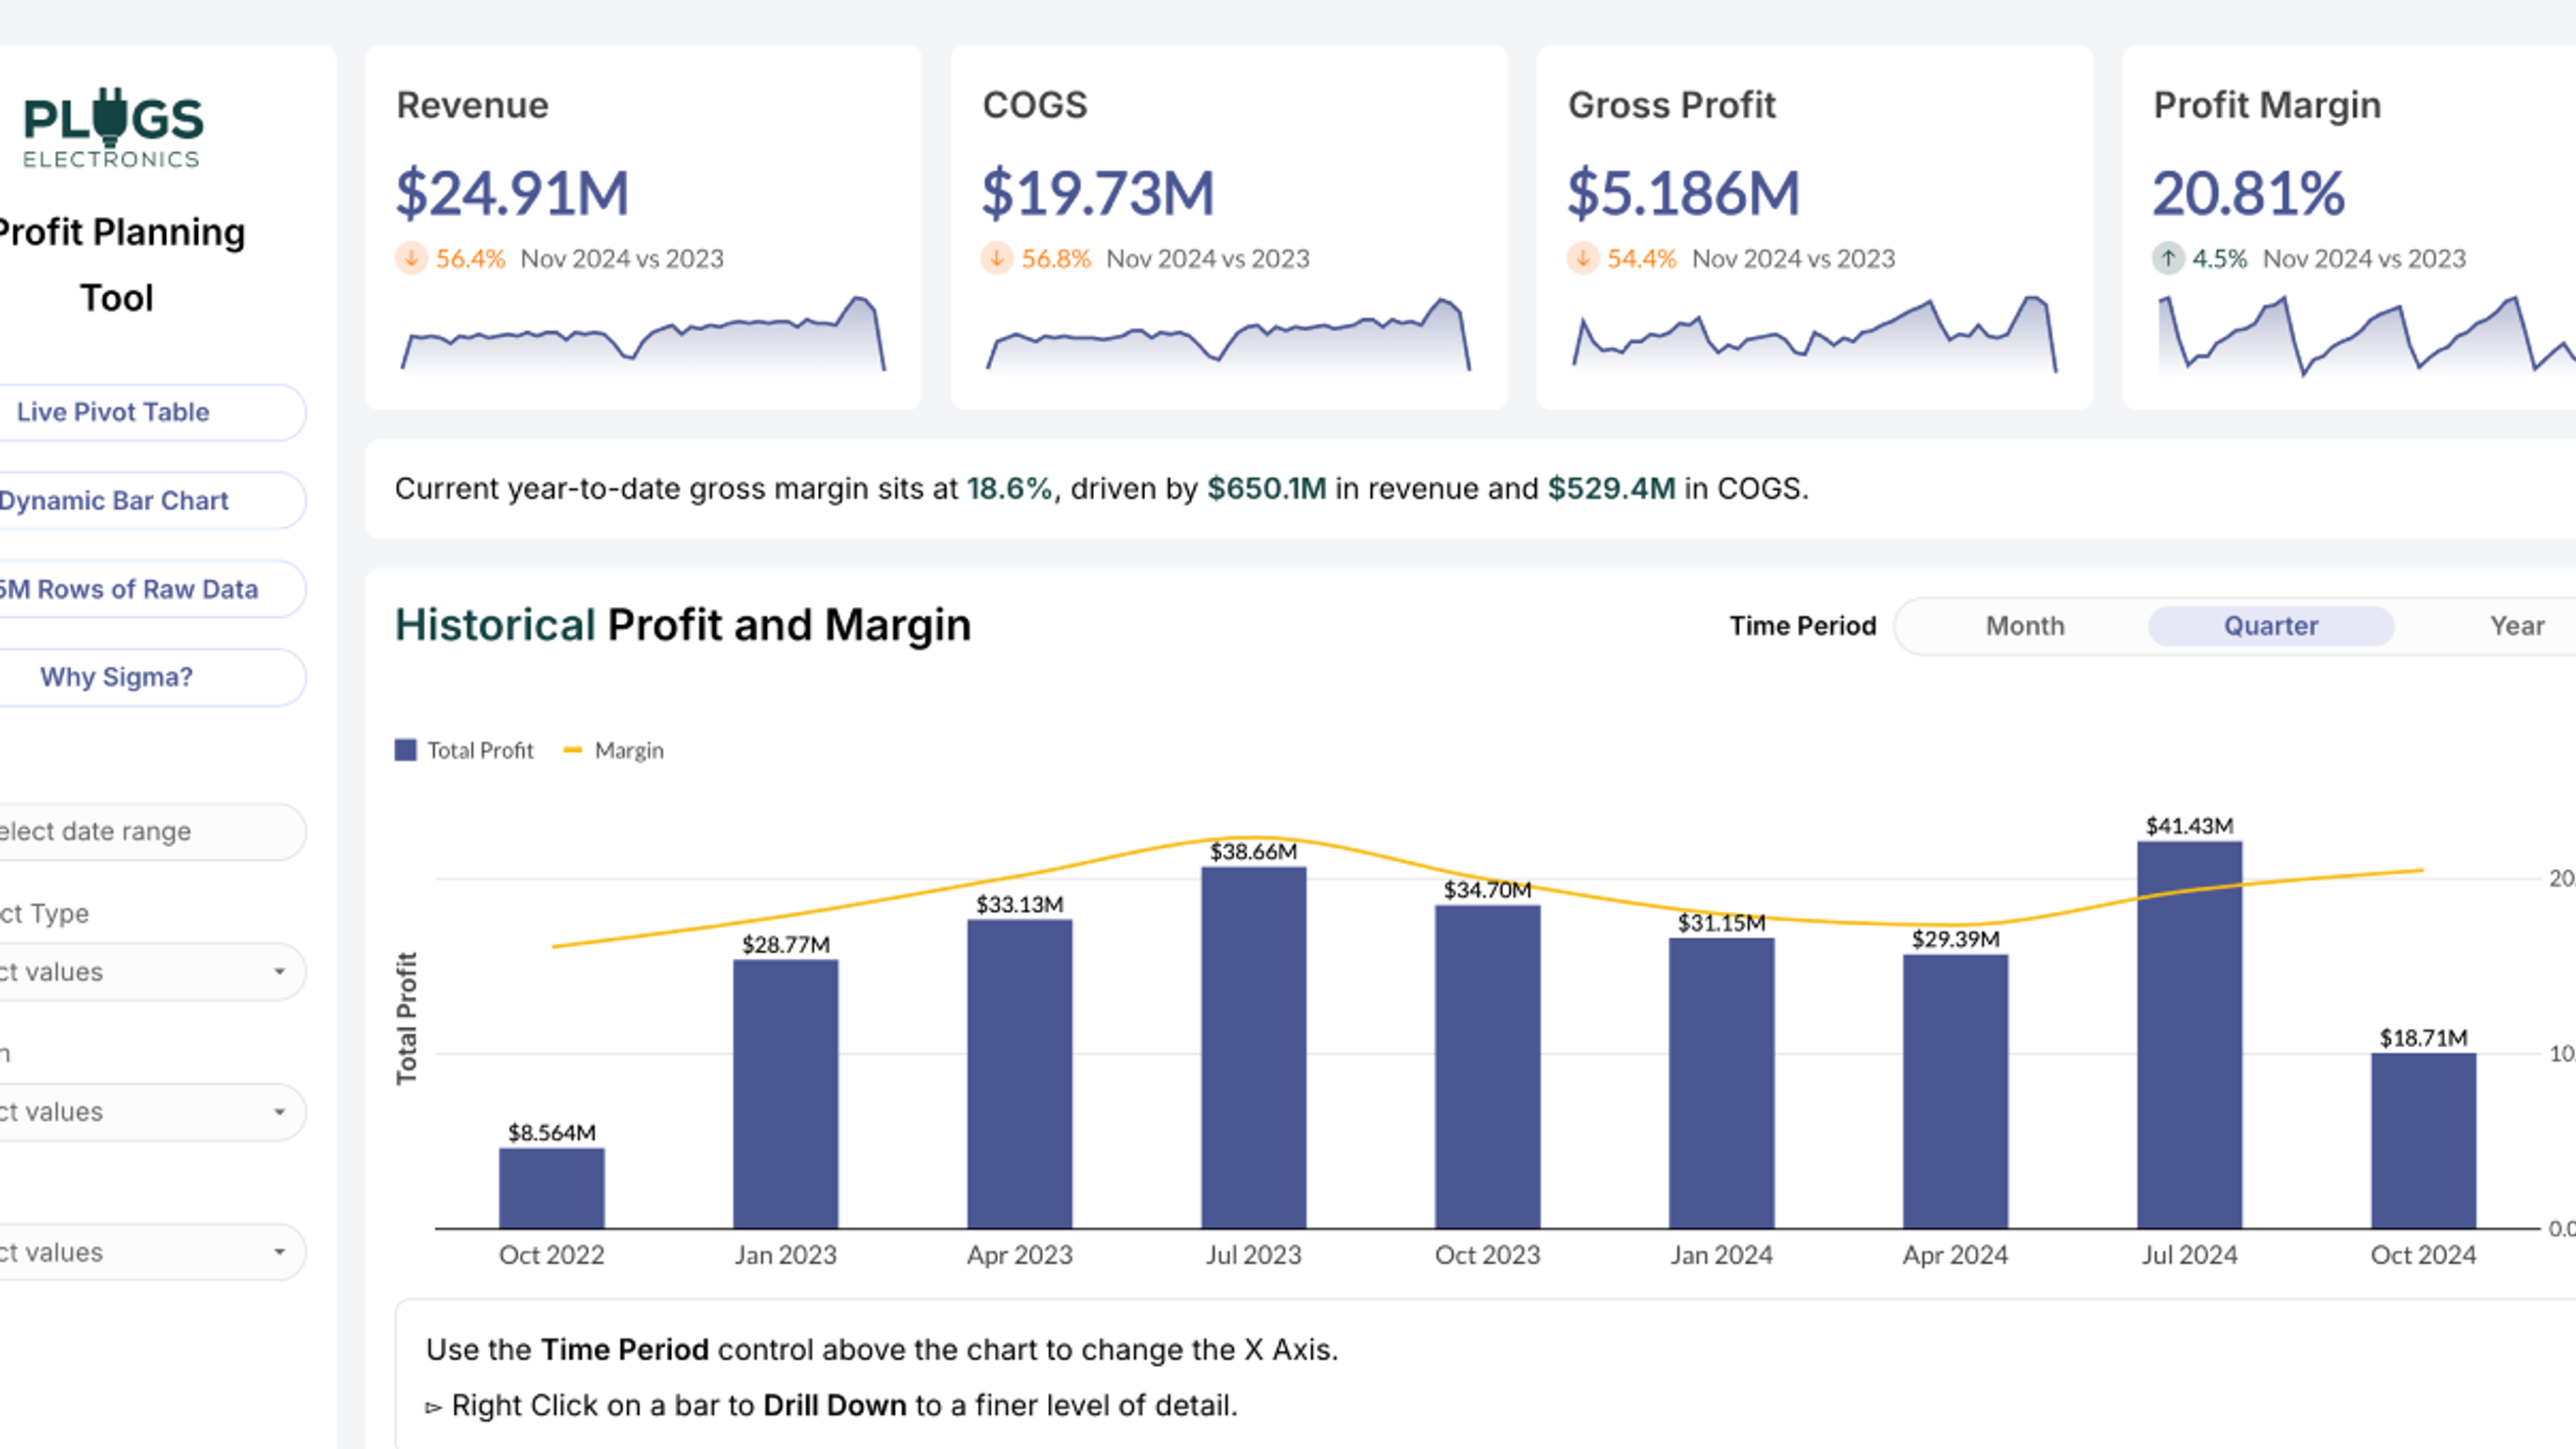
Centralized retail sales dashboard. Full SKU-to-state visibility into performance across regions and products.
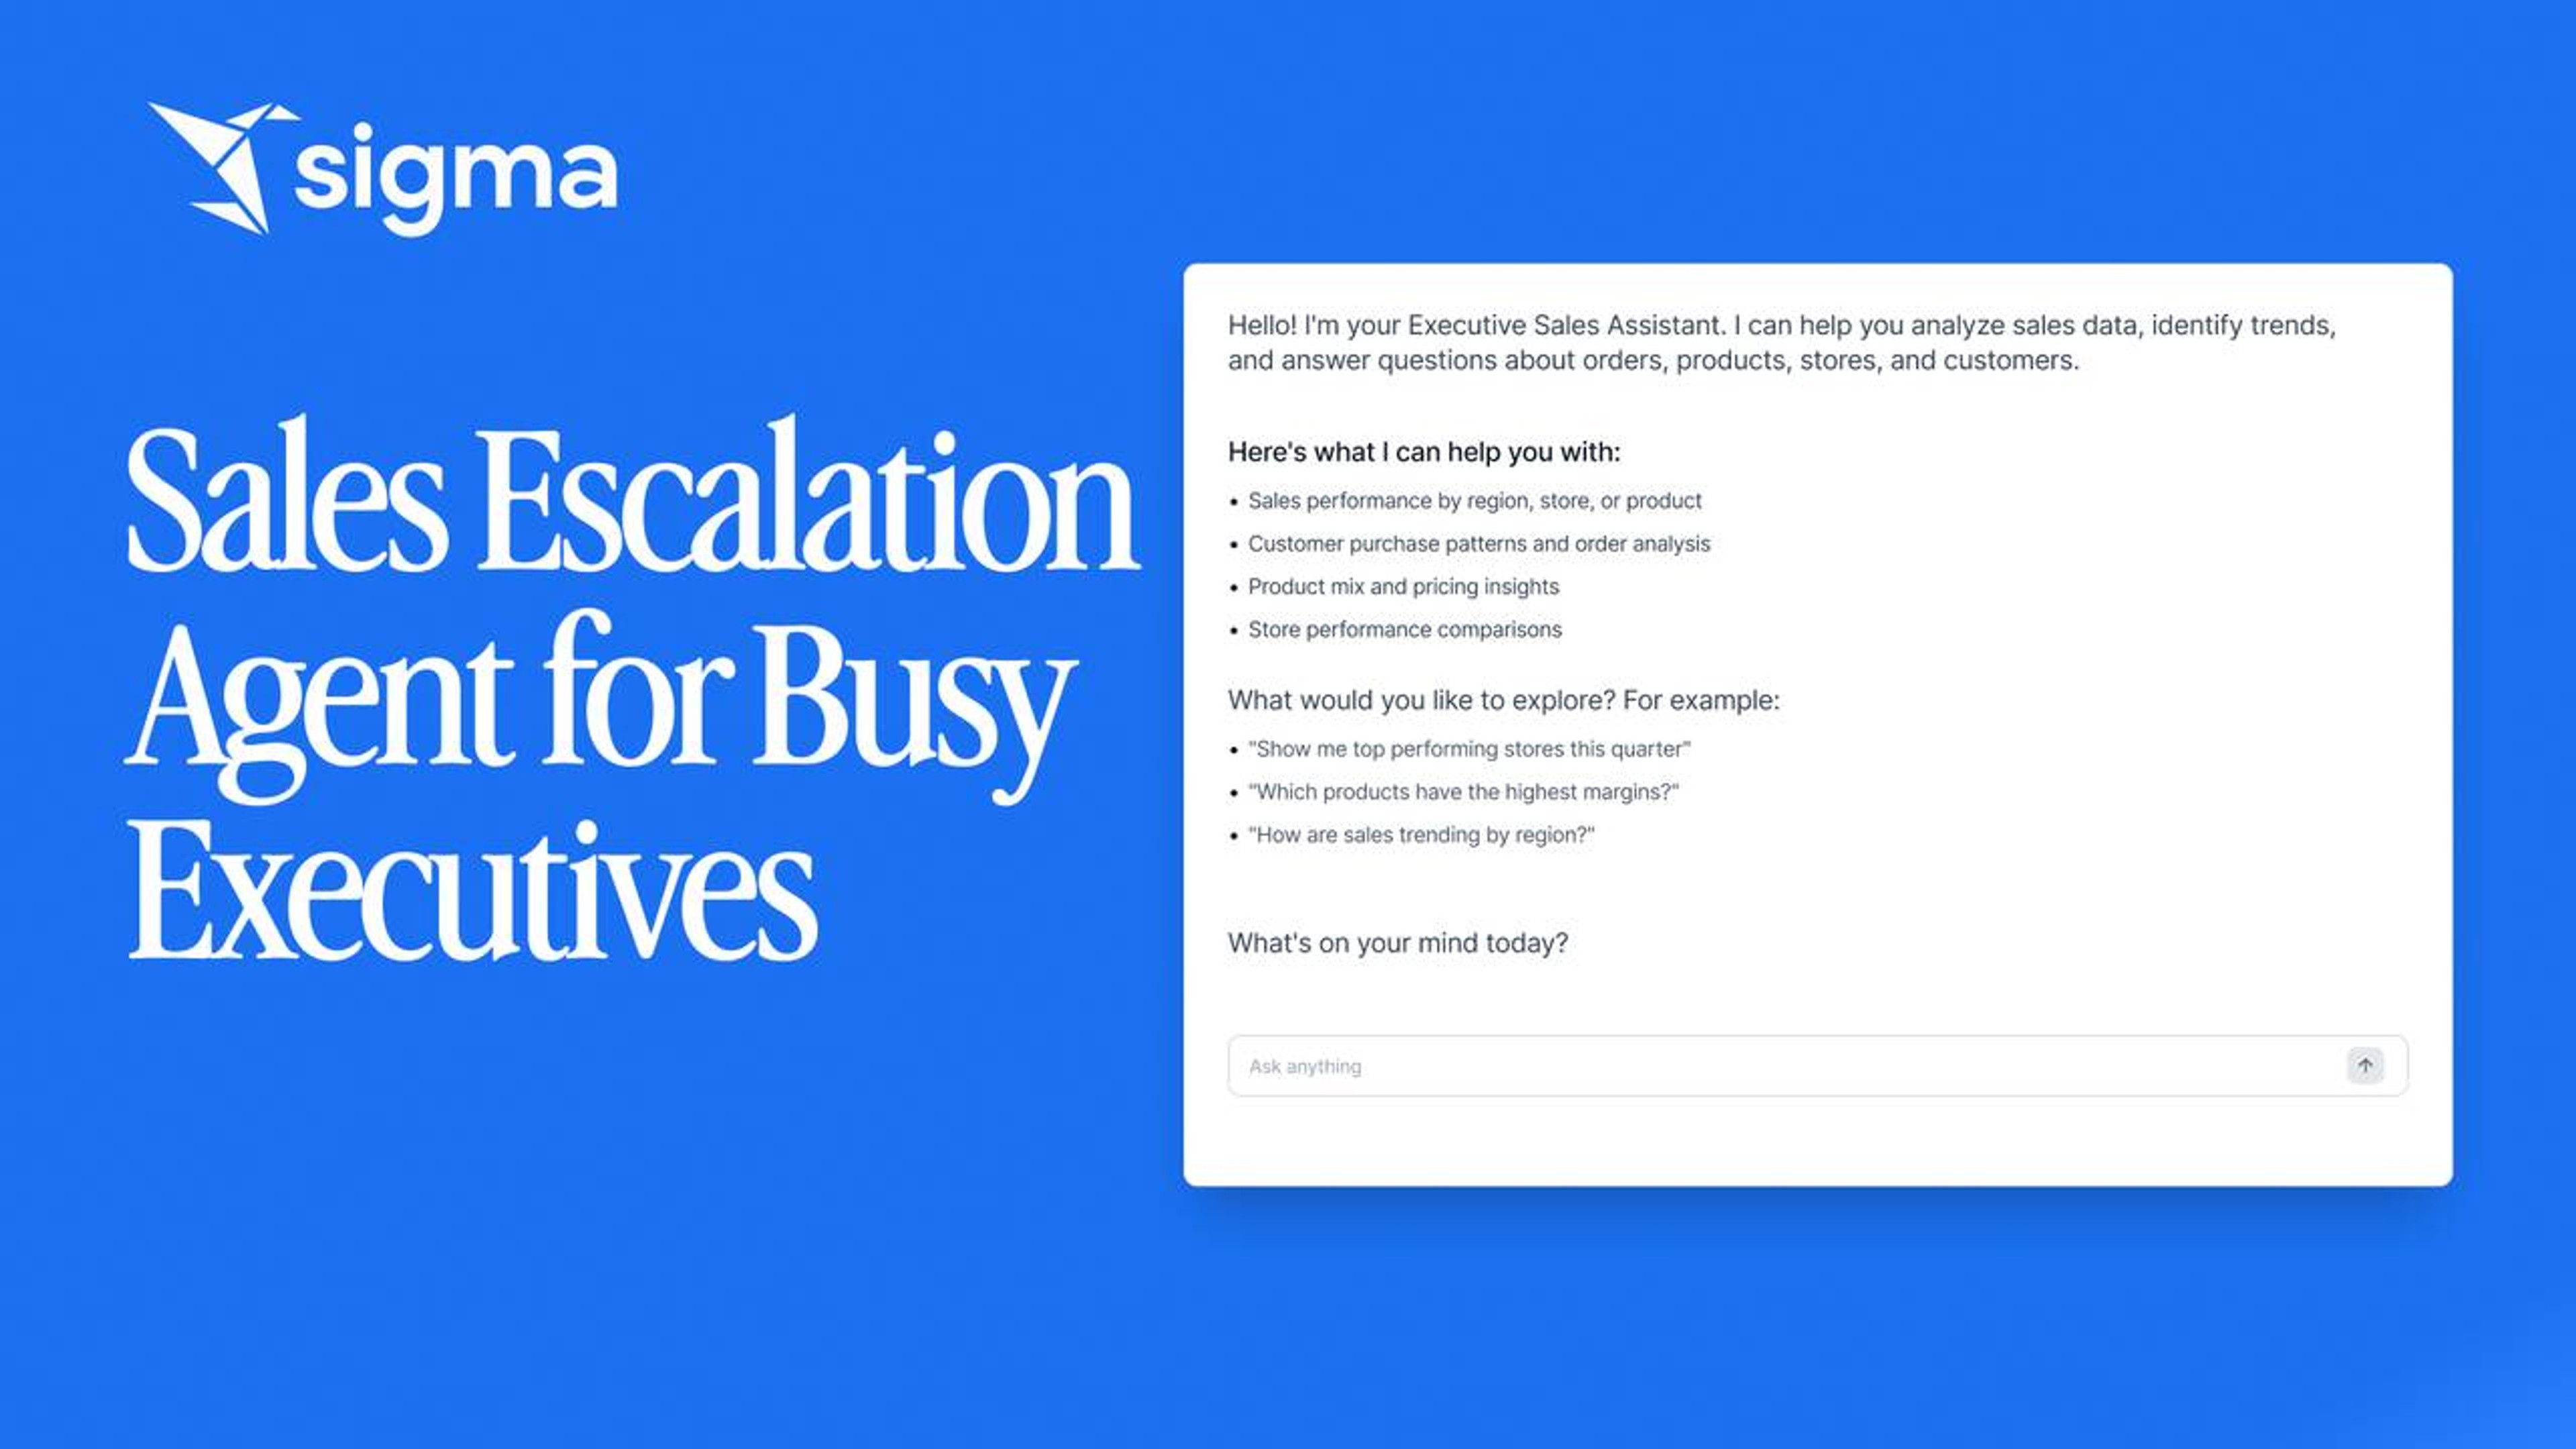
An exec workbook that runs on a natural-language interface. Ask, get a one-line recap, and escalate without leaving the page. Built for busy decision-makers.
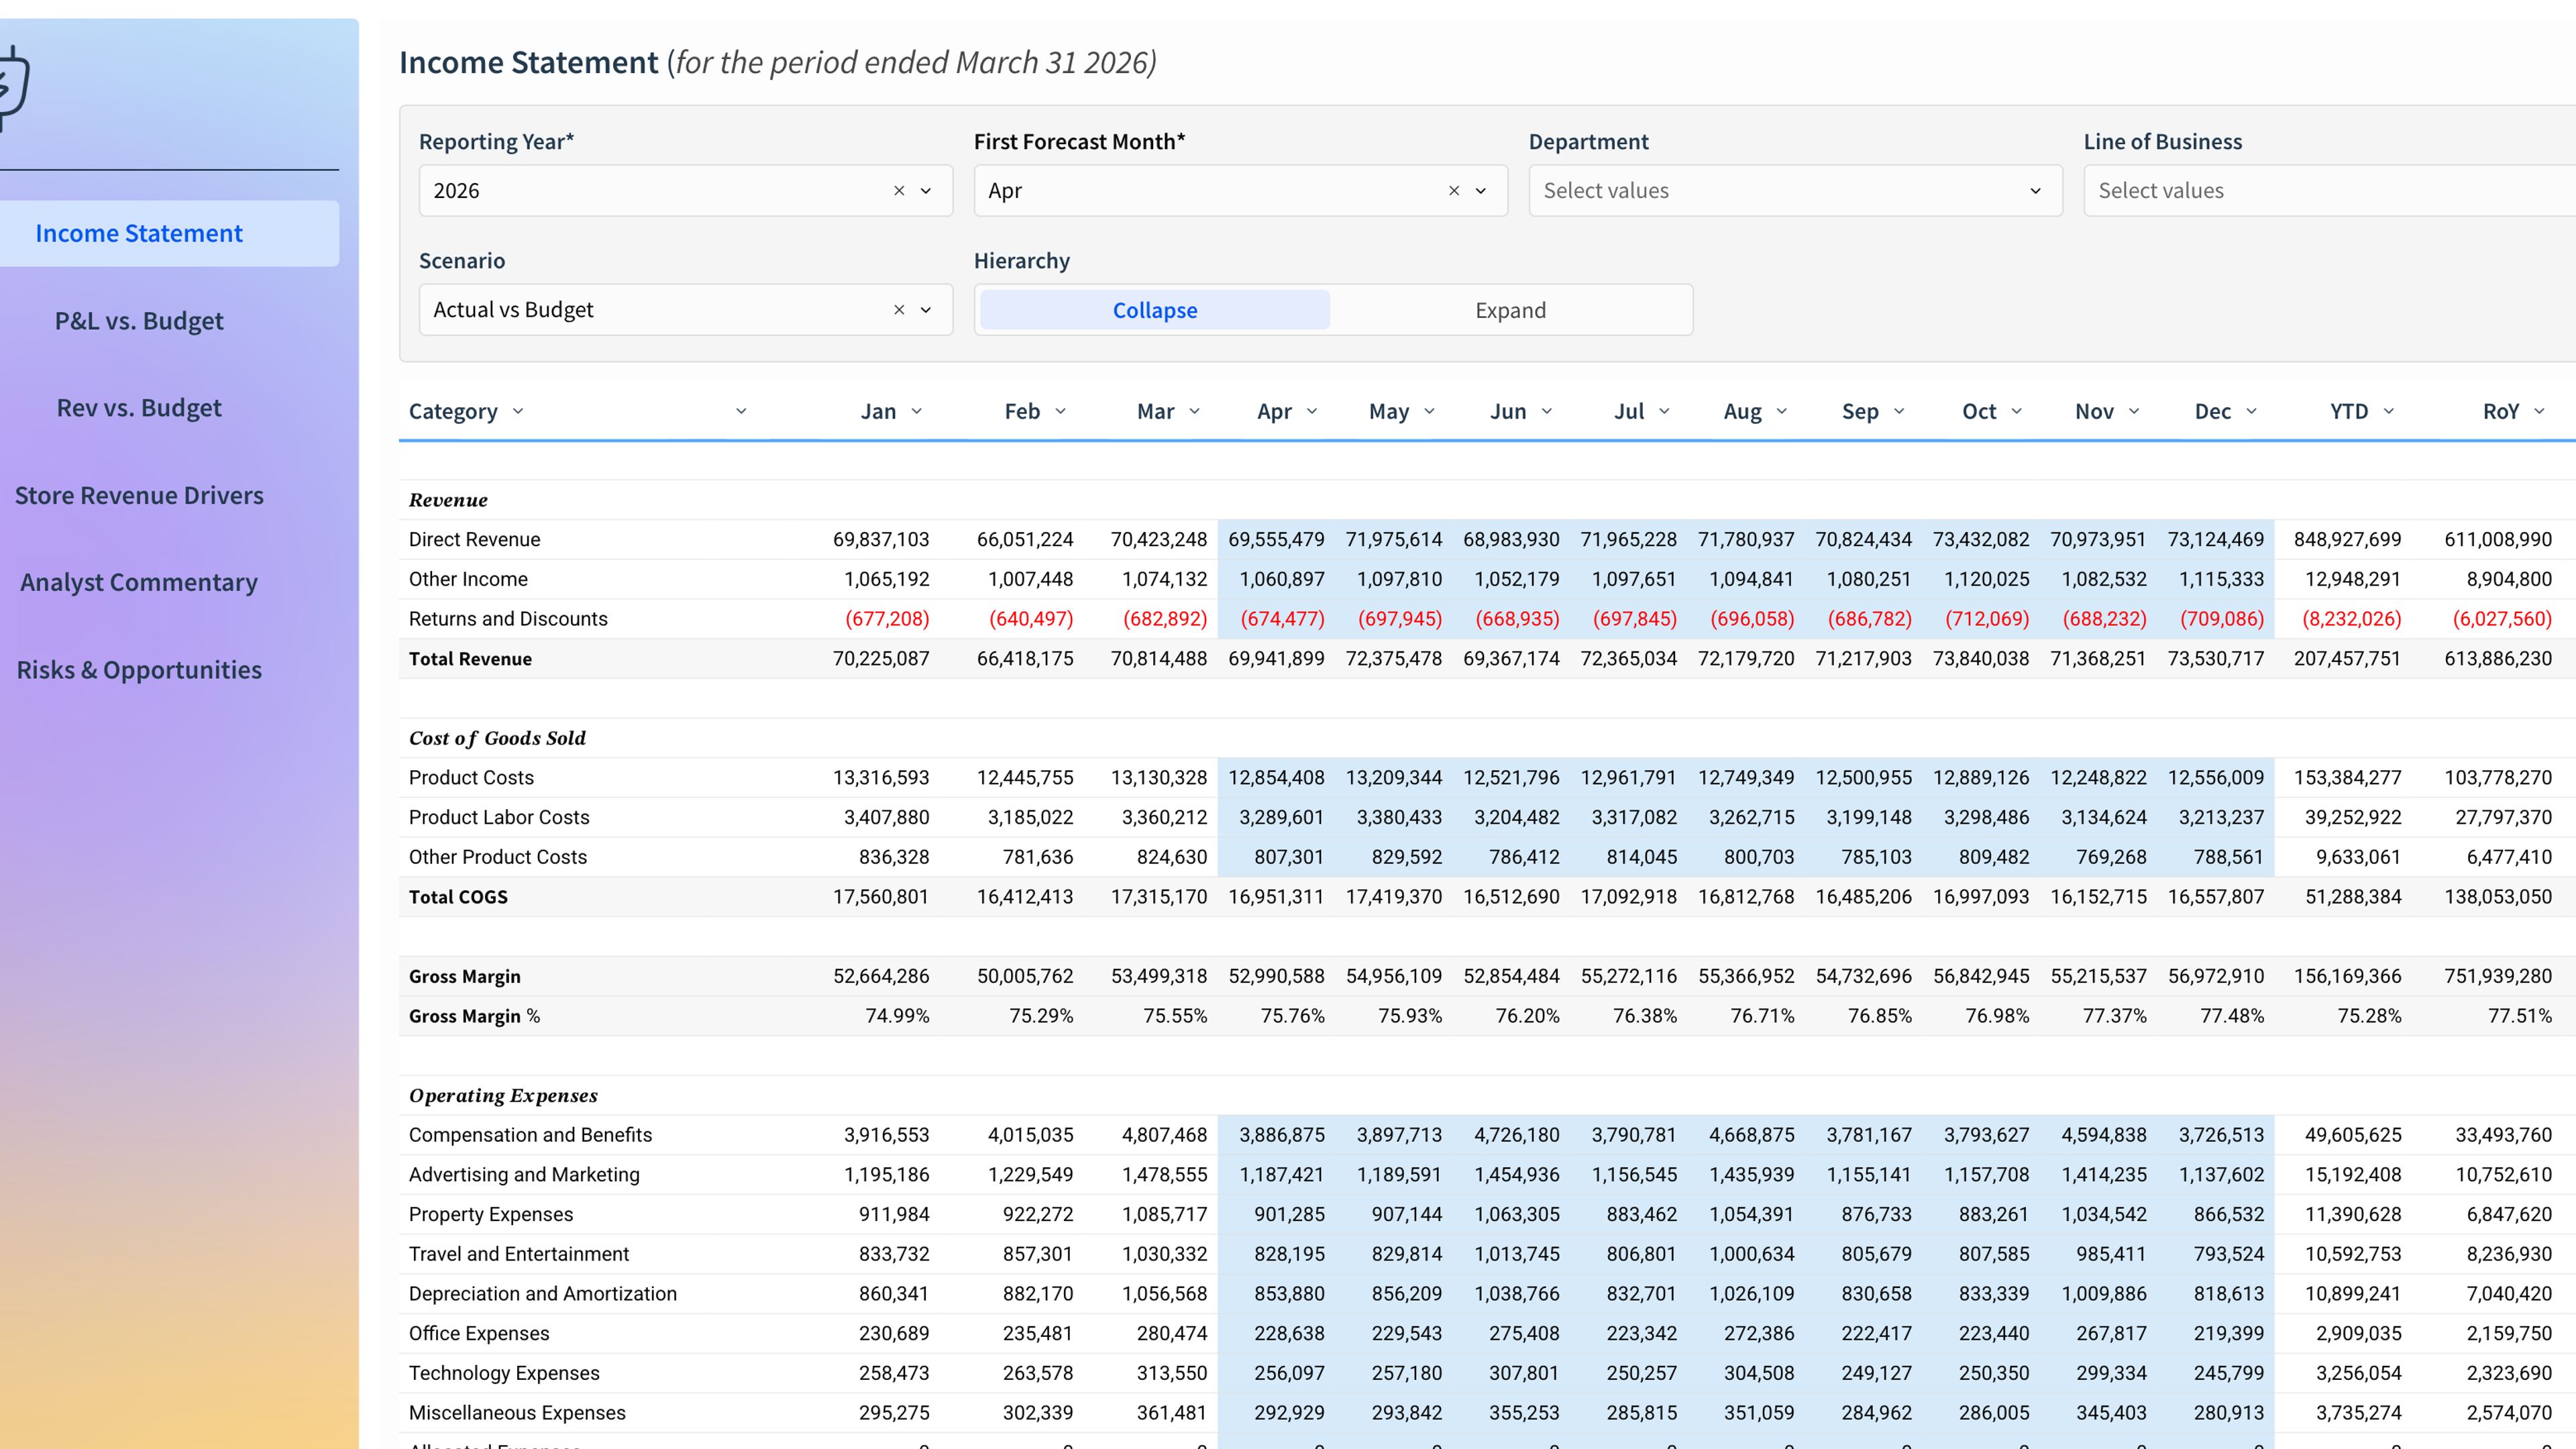
Live P&L with an AI agent that diagnoses variances, drills to payroll-level detail, and feeds scenario planning back to operating teams.
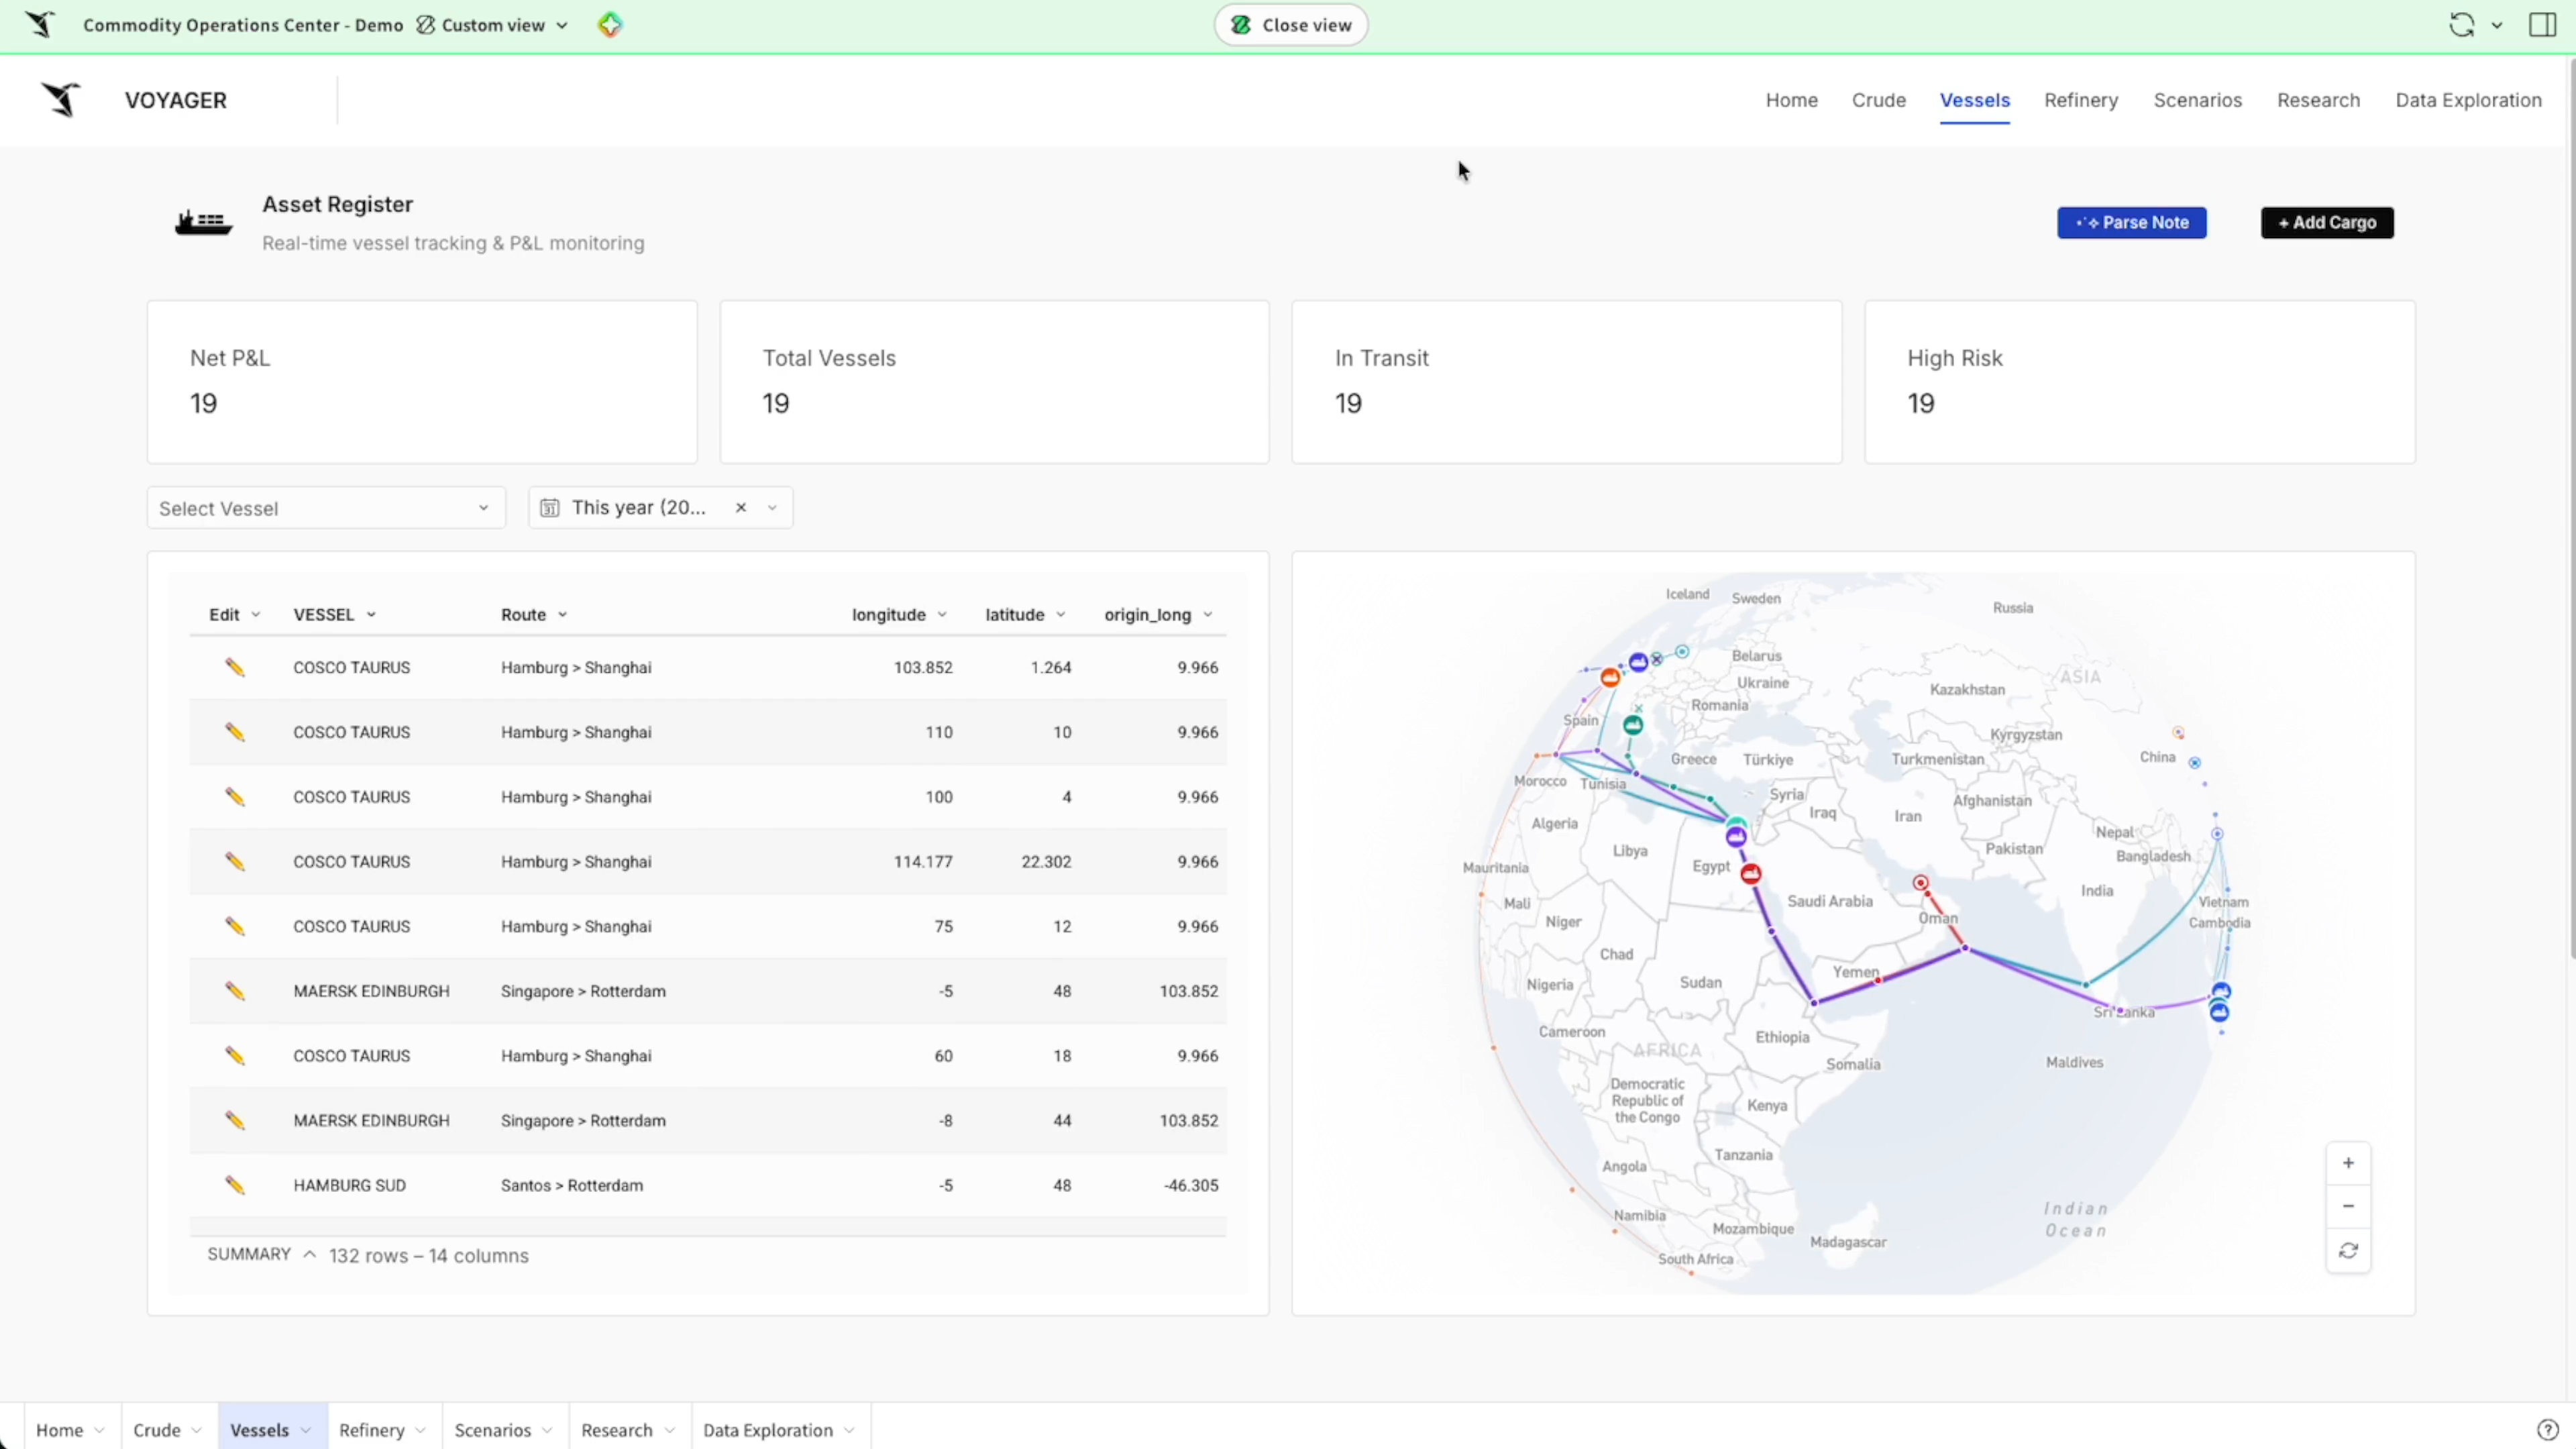
Give trading desks one live workspace to track vessels, cargo, and prices, ask an AI agent, and capture broker intel that writes straight back to the warehouse for the whole team, not one trader’s inbox.
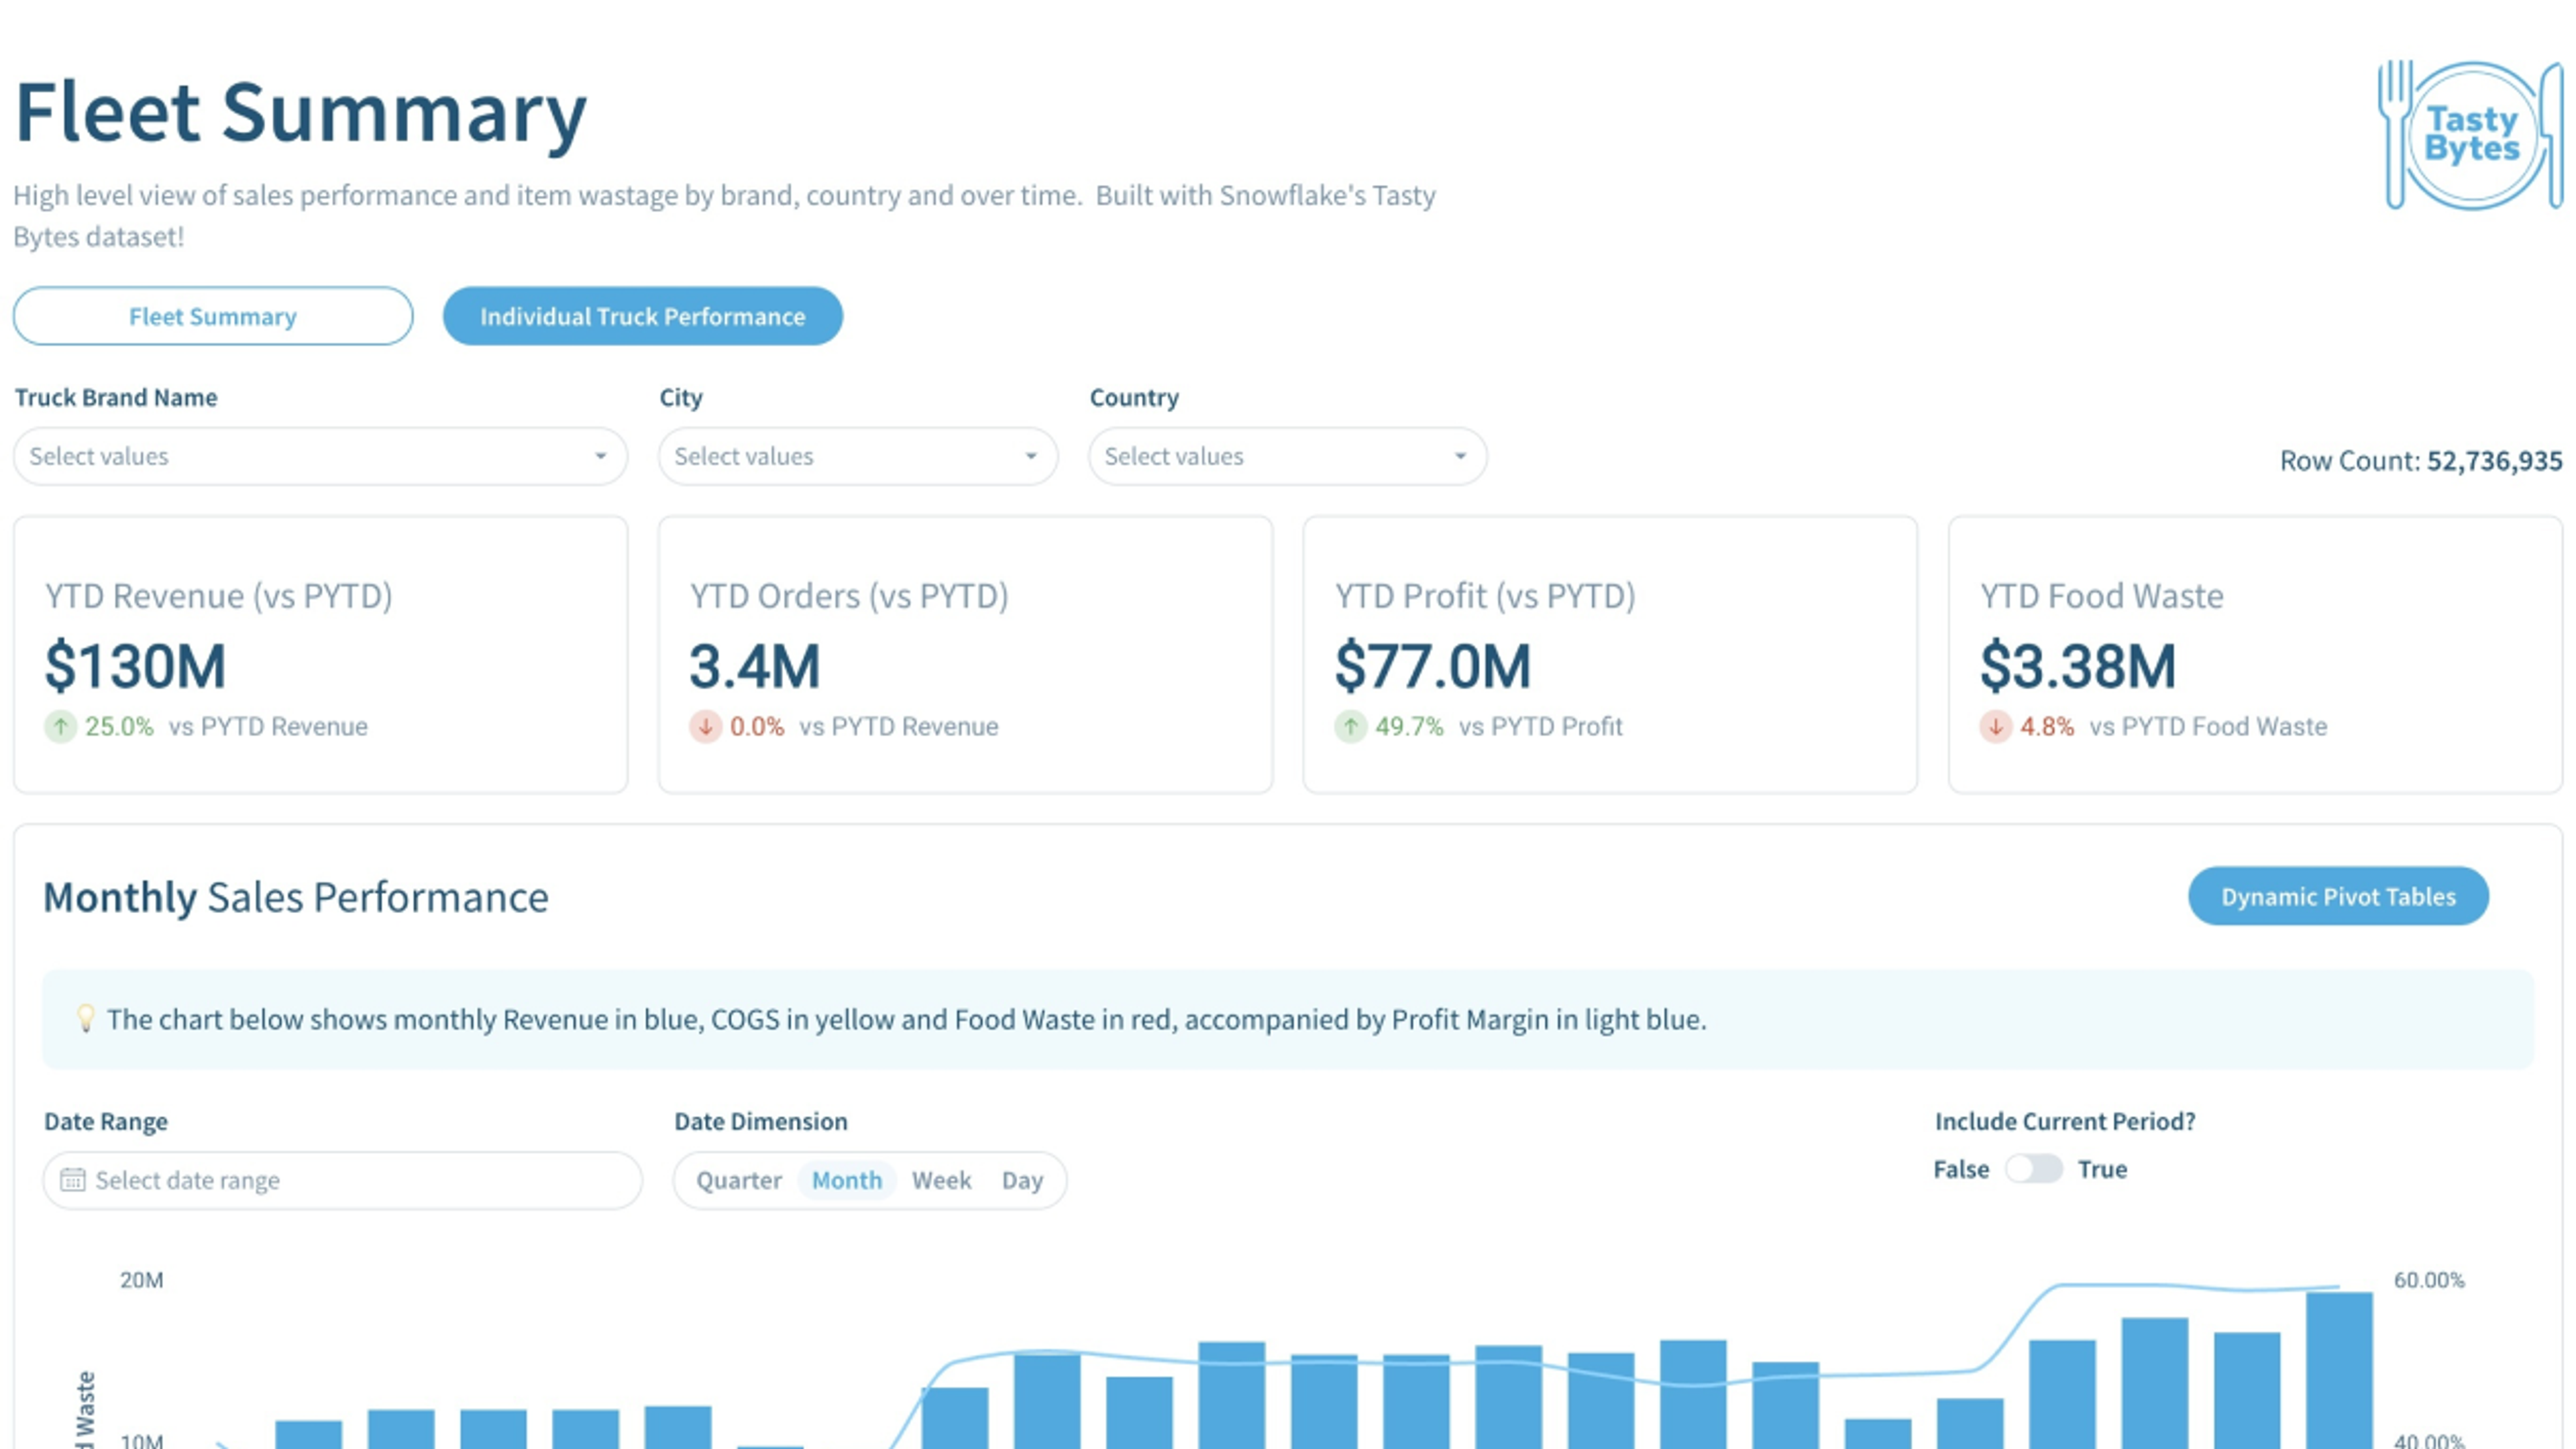
Track Tasty Bytes' global food-truck fleet. Executive summary plus deep-dive truck analysis with line-item visibility.
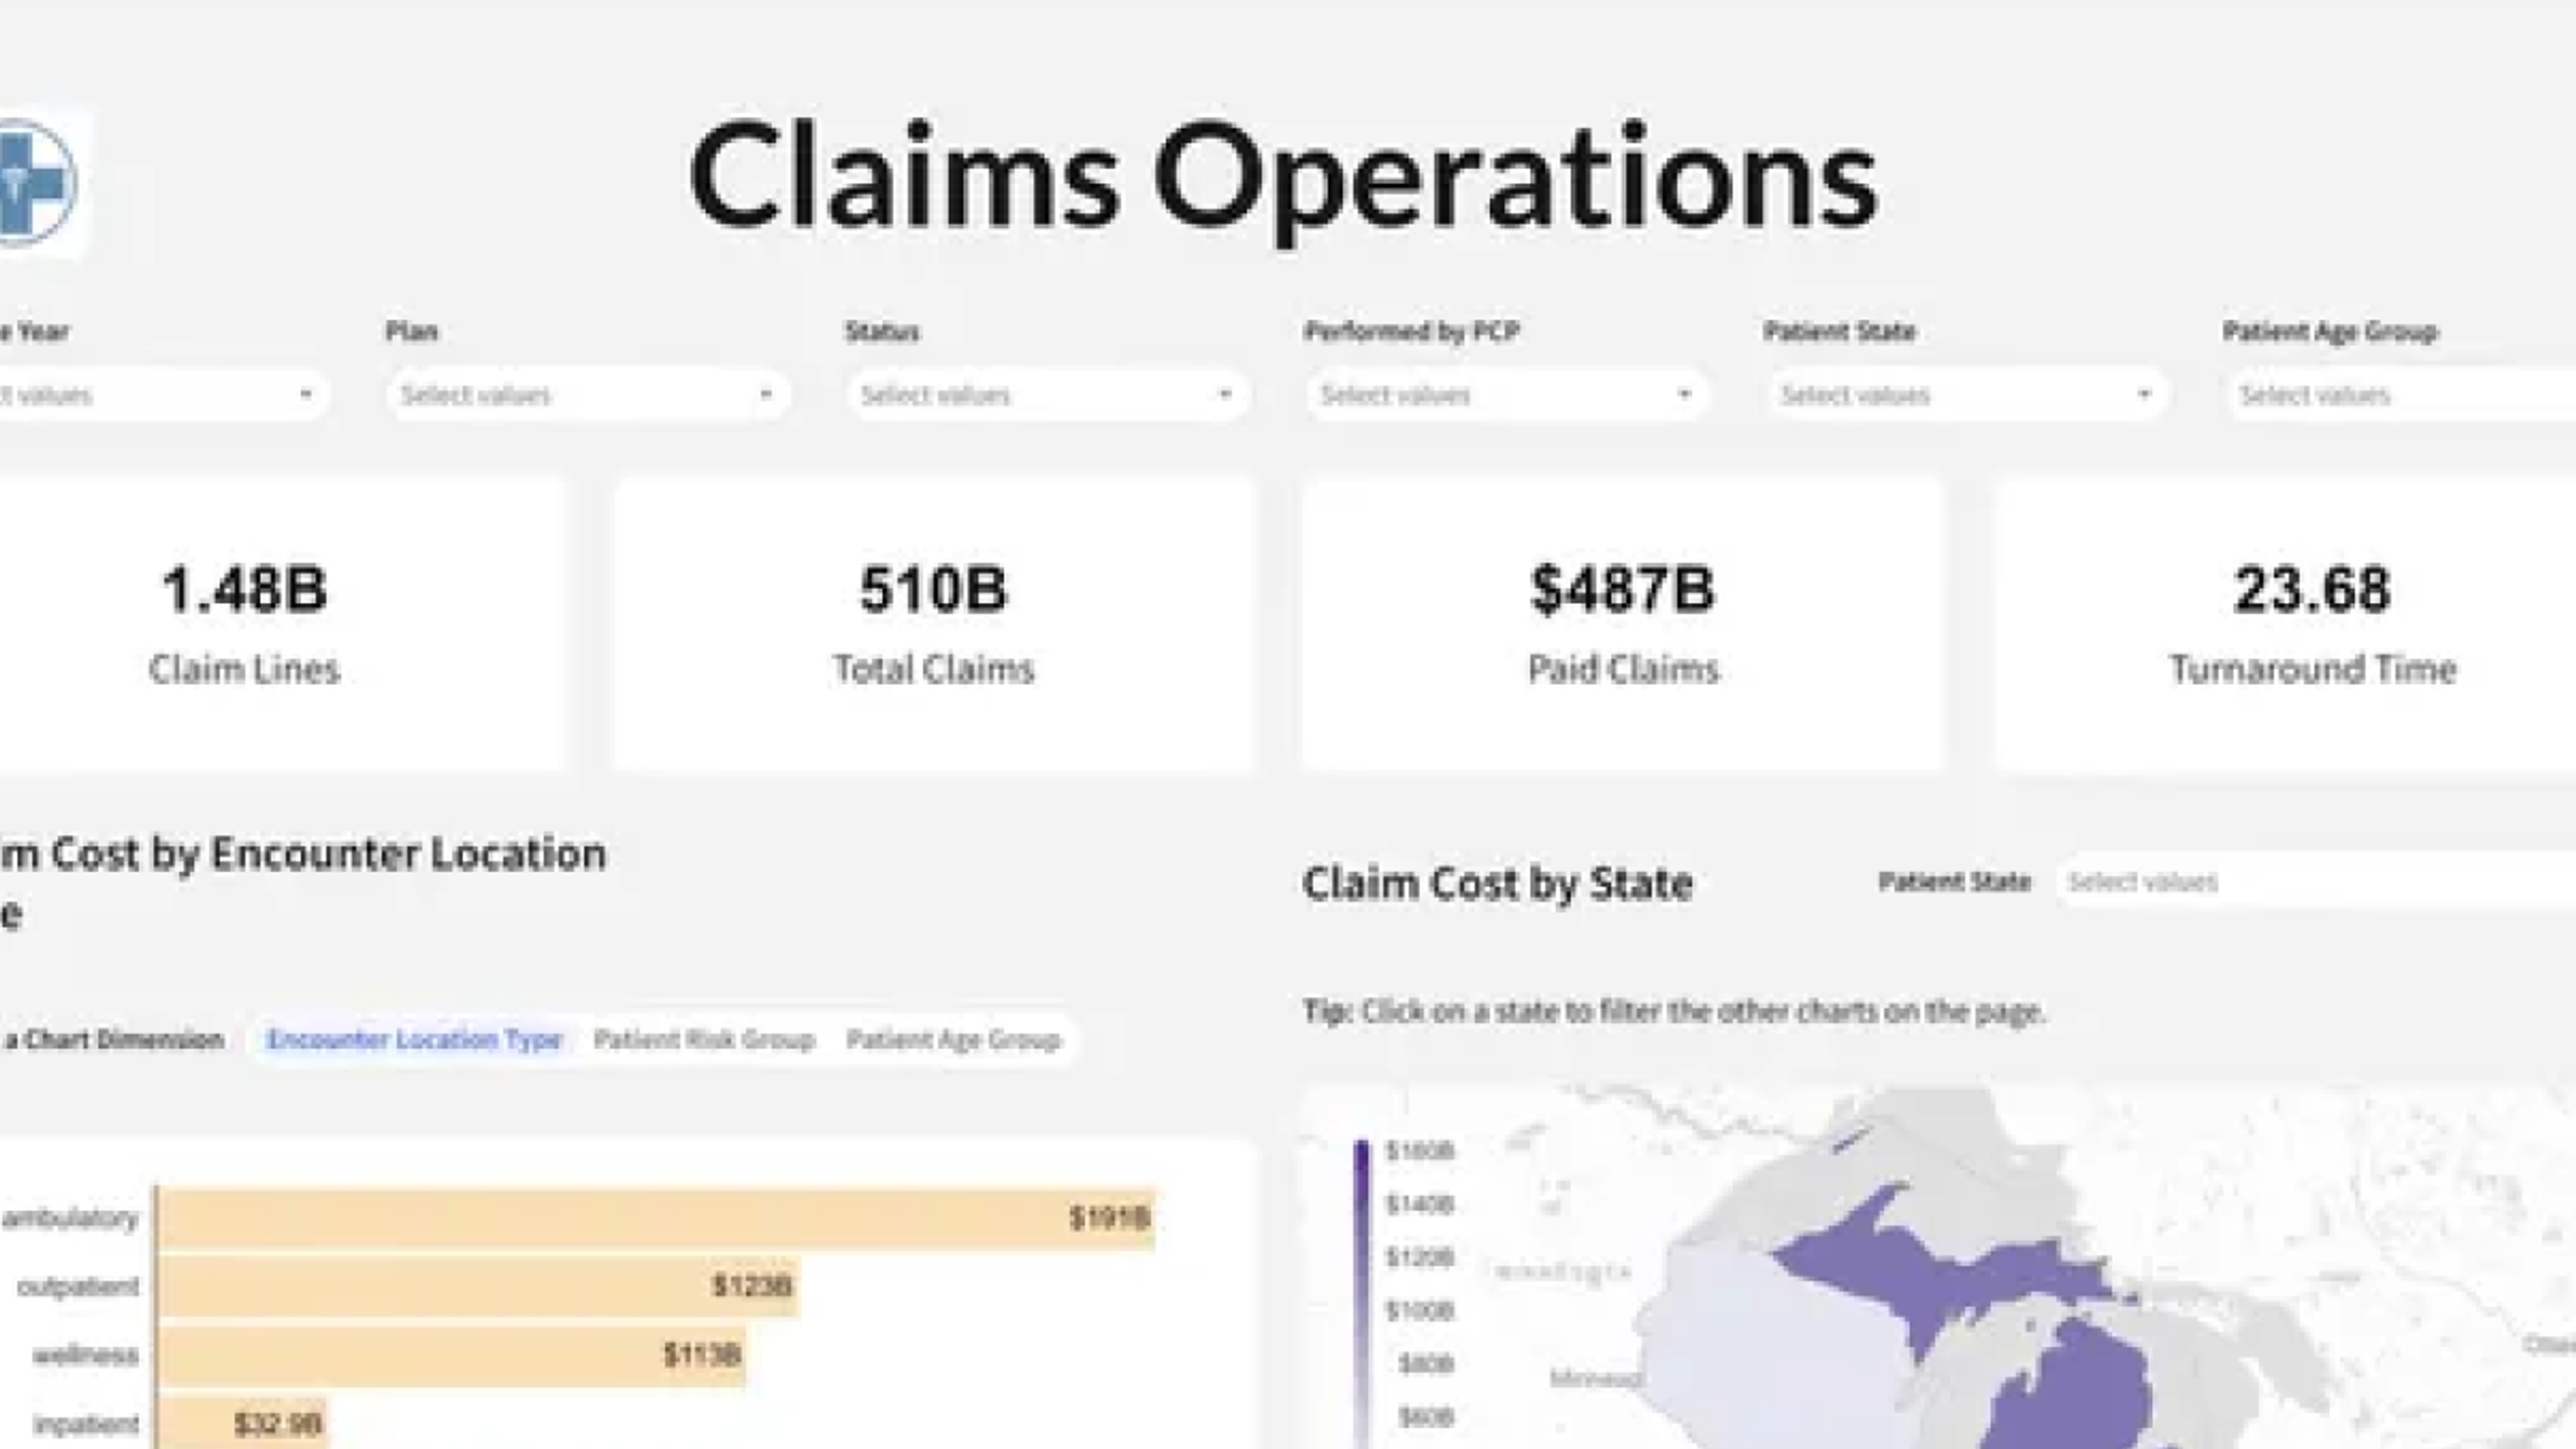
Analyze billions of claims rows to improve patient experience. Identify patients without primary care providers and suggest matches.
All 7 build on the same live, governed platform.
Own every forecast version
Model every lever on live data
Own your plan in one place
Project tracking you can act on
Reconcile every number in one place
Fix reference data without a ticket
To learn more about dashboards and BI on live warehouse data, bring your hardest request and schedule a Sigma demo.
Schedule demoStop buying a new tool for every workflow. Build it once on governed data, then scale it across the business.