
Sigma for dashboards
Dashboards that get to the answer
Finance matches the ledger and the subledger live on the warehouse, explains every exception, and signs off with a full trail.
Schedule demoEvery figure comes from a customer describing how they reconcile today, without Sigma.
A close pulls numbers from 12 reportsone model, spends a day a quarterno time at all on copy and paste, and leaves 1% of marginnothing behind on the table.
Sigma joins both sources live on the warehouse. Every break surfaces the moment your feeds land.
Analysts type the reason into an Input Table, so the explanation stays with the row it explains.
Actions route each exception to an approver. Audit history records who changed what, and when.
Match both systems. Explain the exception. Sign off and close
The ledger and the subledger are read in place, so a break shows up the moment the difference clears tolerance.
Sigma queries both systems where the data already lives, so the match runs on the rows your feeds just landed. Controller and auditor read the same governed number.
An analyst types the explanation, the adjustment, and the owner directly into the row. The number a controller signs is the number the board reads.
Sigma Agents watch the reconciliation as data lands, flag balances outside tolerance, and summarize what changed. Every call runs through the LLM provider you configure or a warehouse-native model.



Sigma queries your warehouse live, so a workbook reads what landed a moment ago.
Every edit carries a user identity and a timestamp, and existing warehouse controls still decide who can make it.
Sigma appends each correction as a row-level insert, so production tables stay as your pipeline left them.
Warehouse roles and row-level security govern the workbook. There is no second permission layer to maintain.
Audit history on an Input Table records the complete trail, so a disputed figure has one traceable owner.
Every app here runs on live warehouse data, writes back, and keeps the trail an auditor asks for.
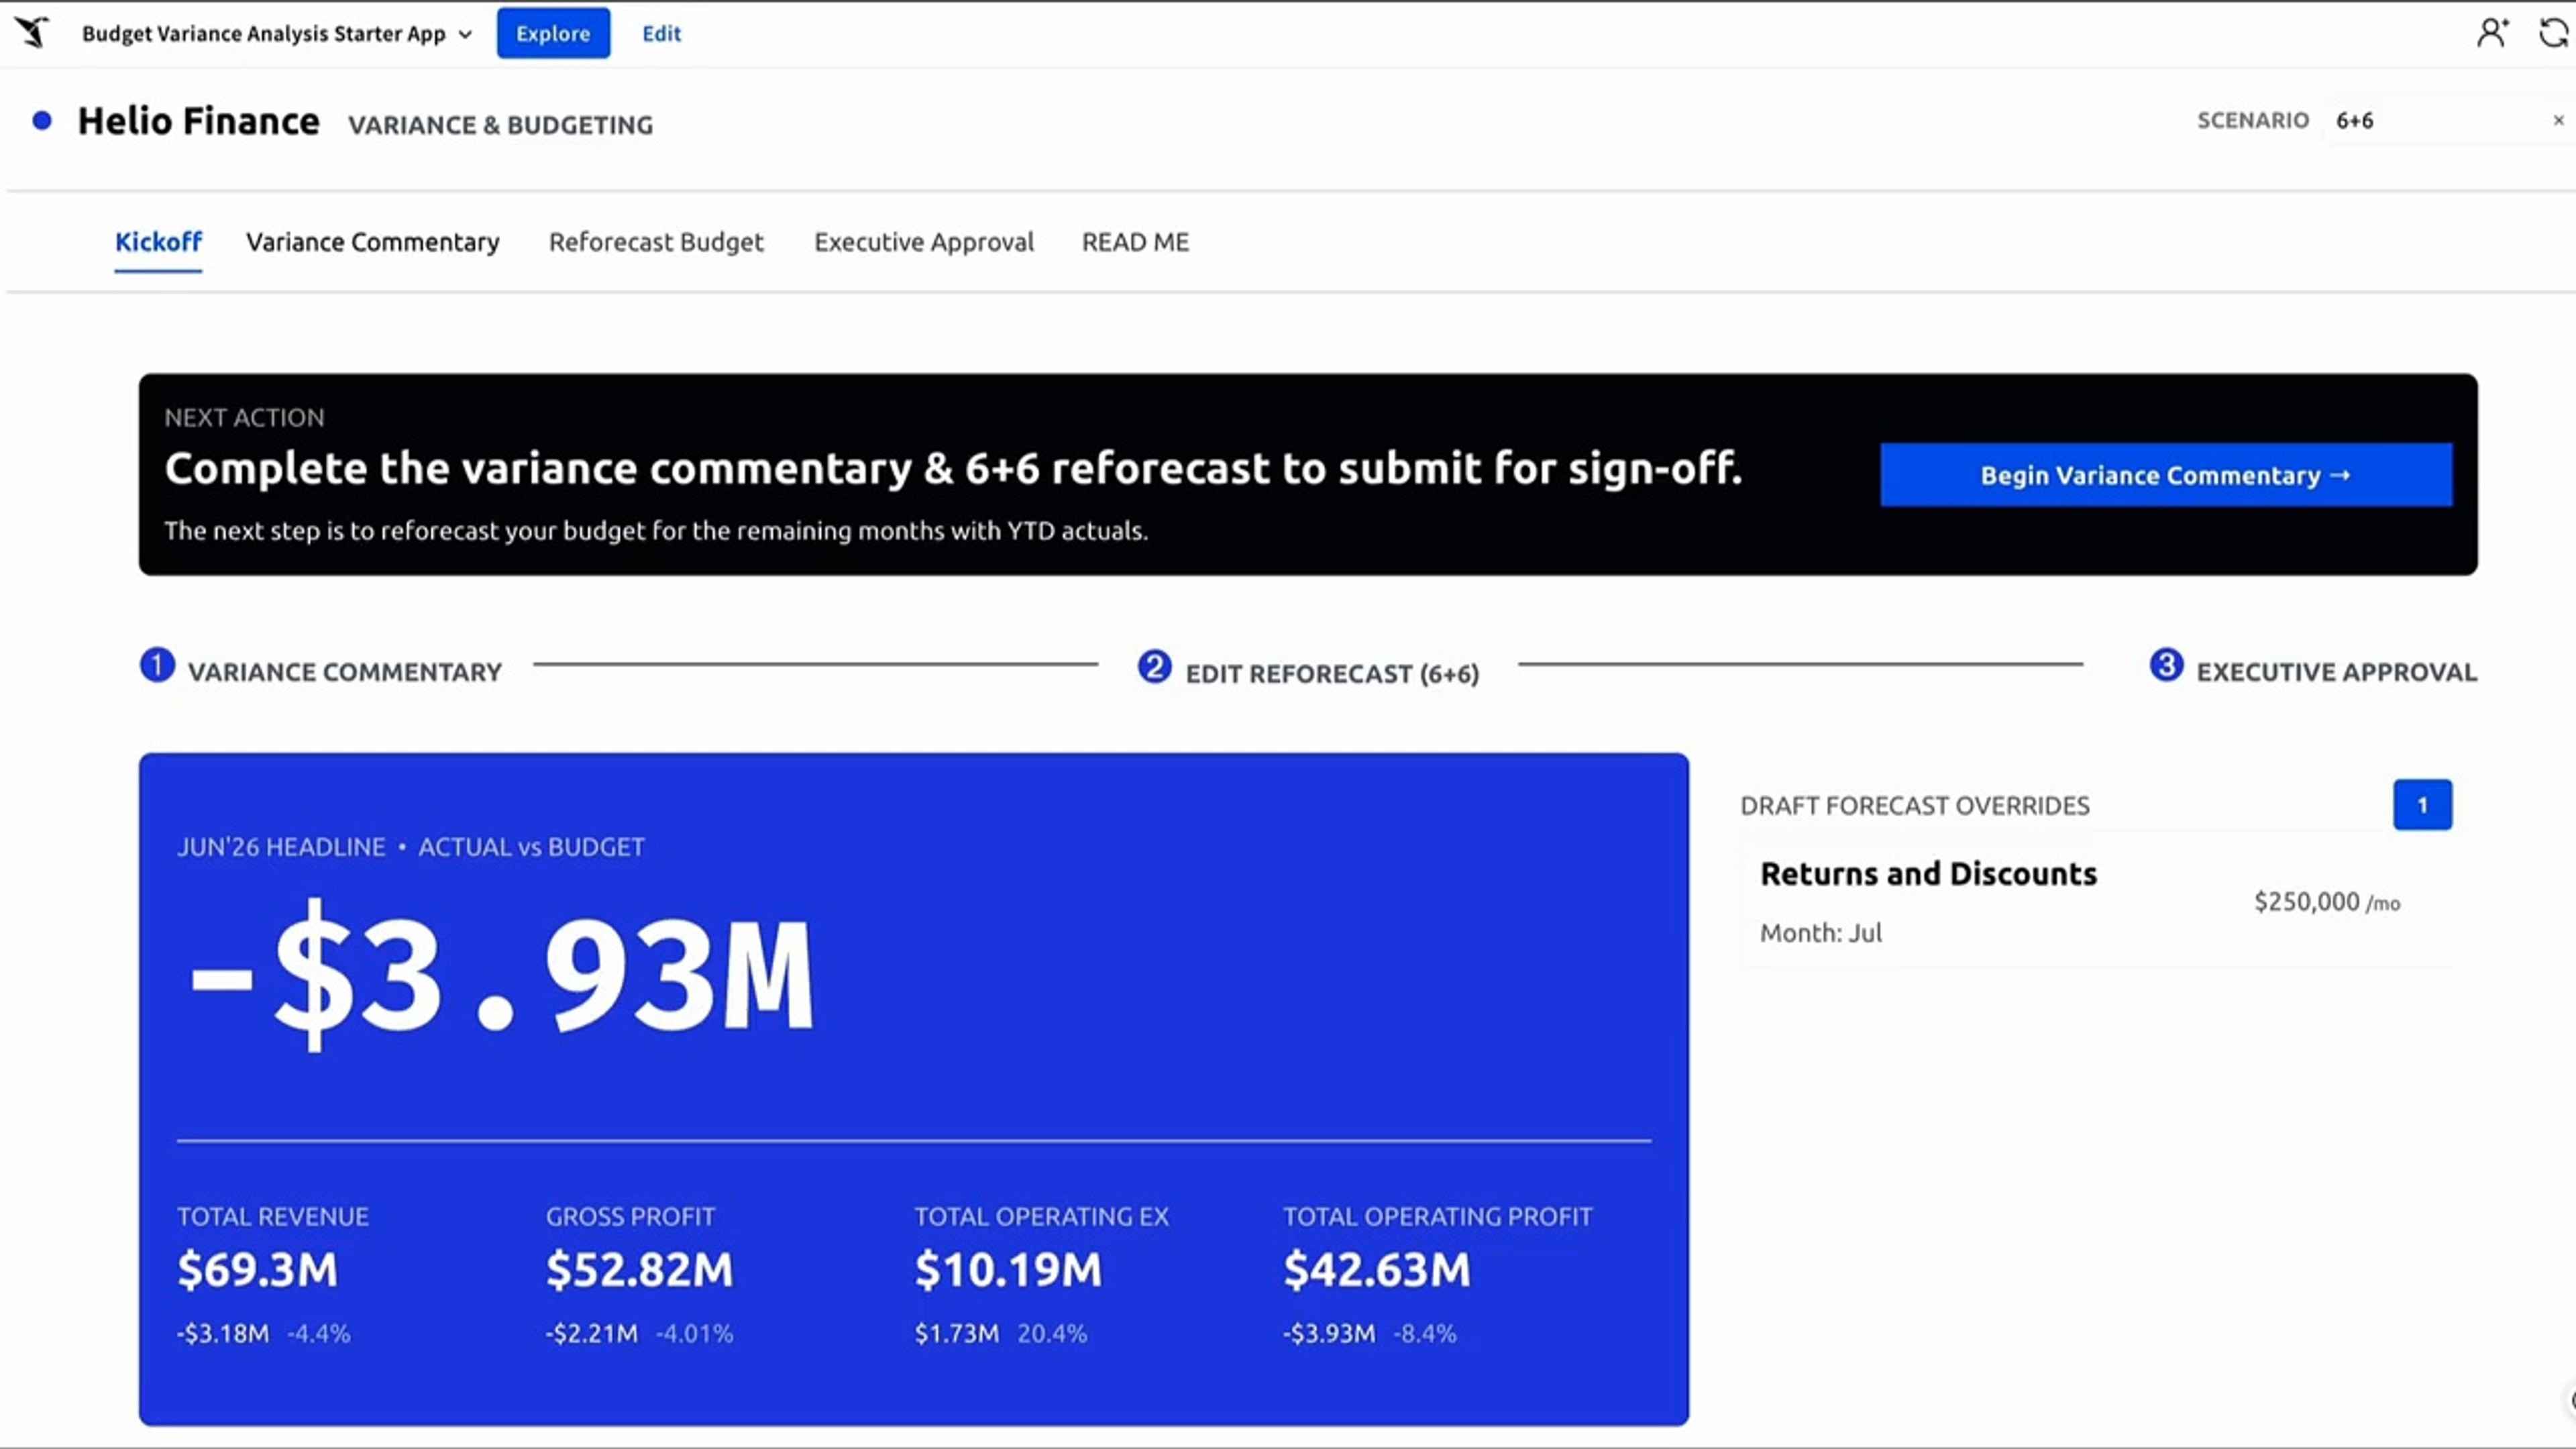
Move from variance analysis to an approved reforecast in one workflow, with commentary and overrides that write straight back to your numbers.
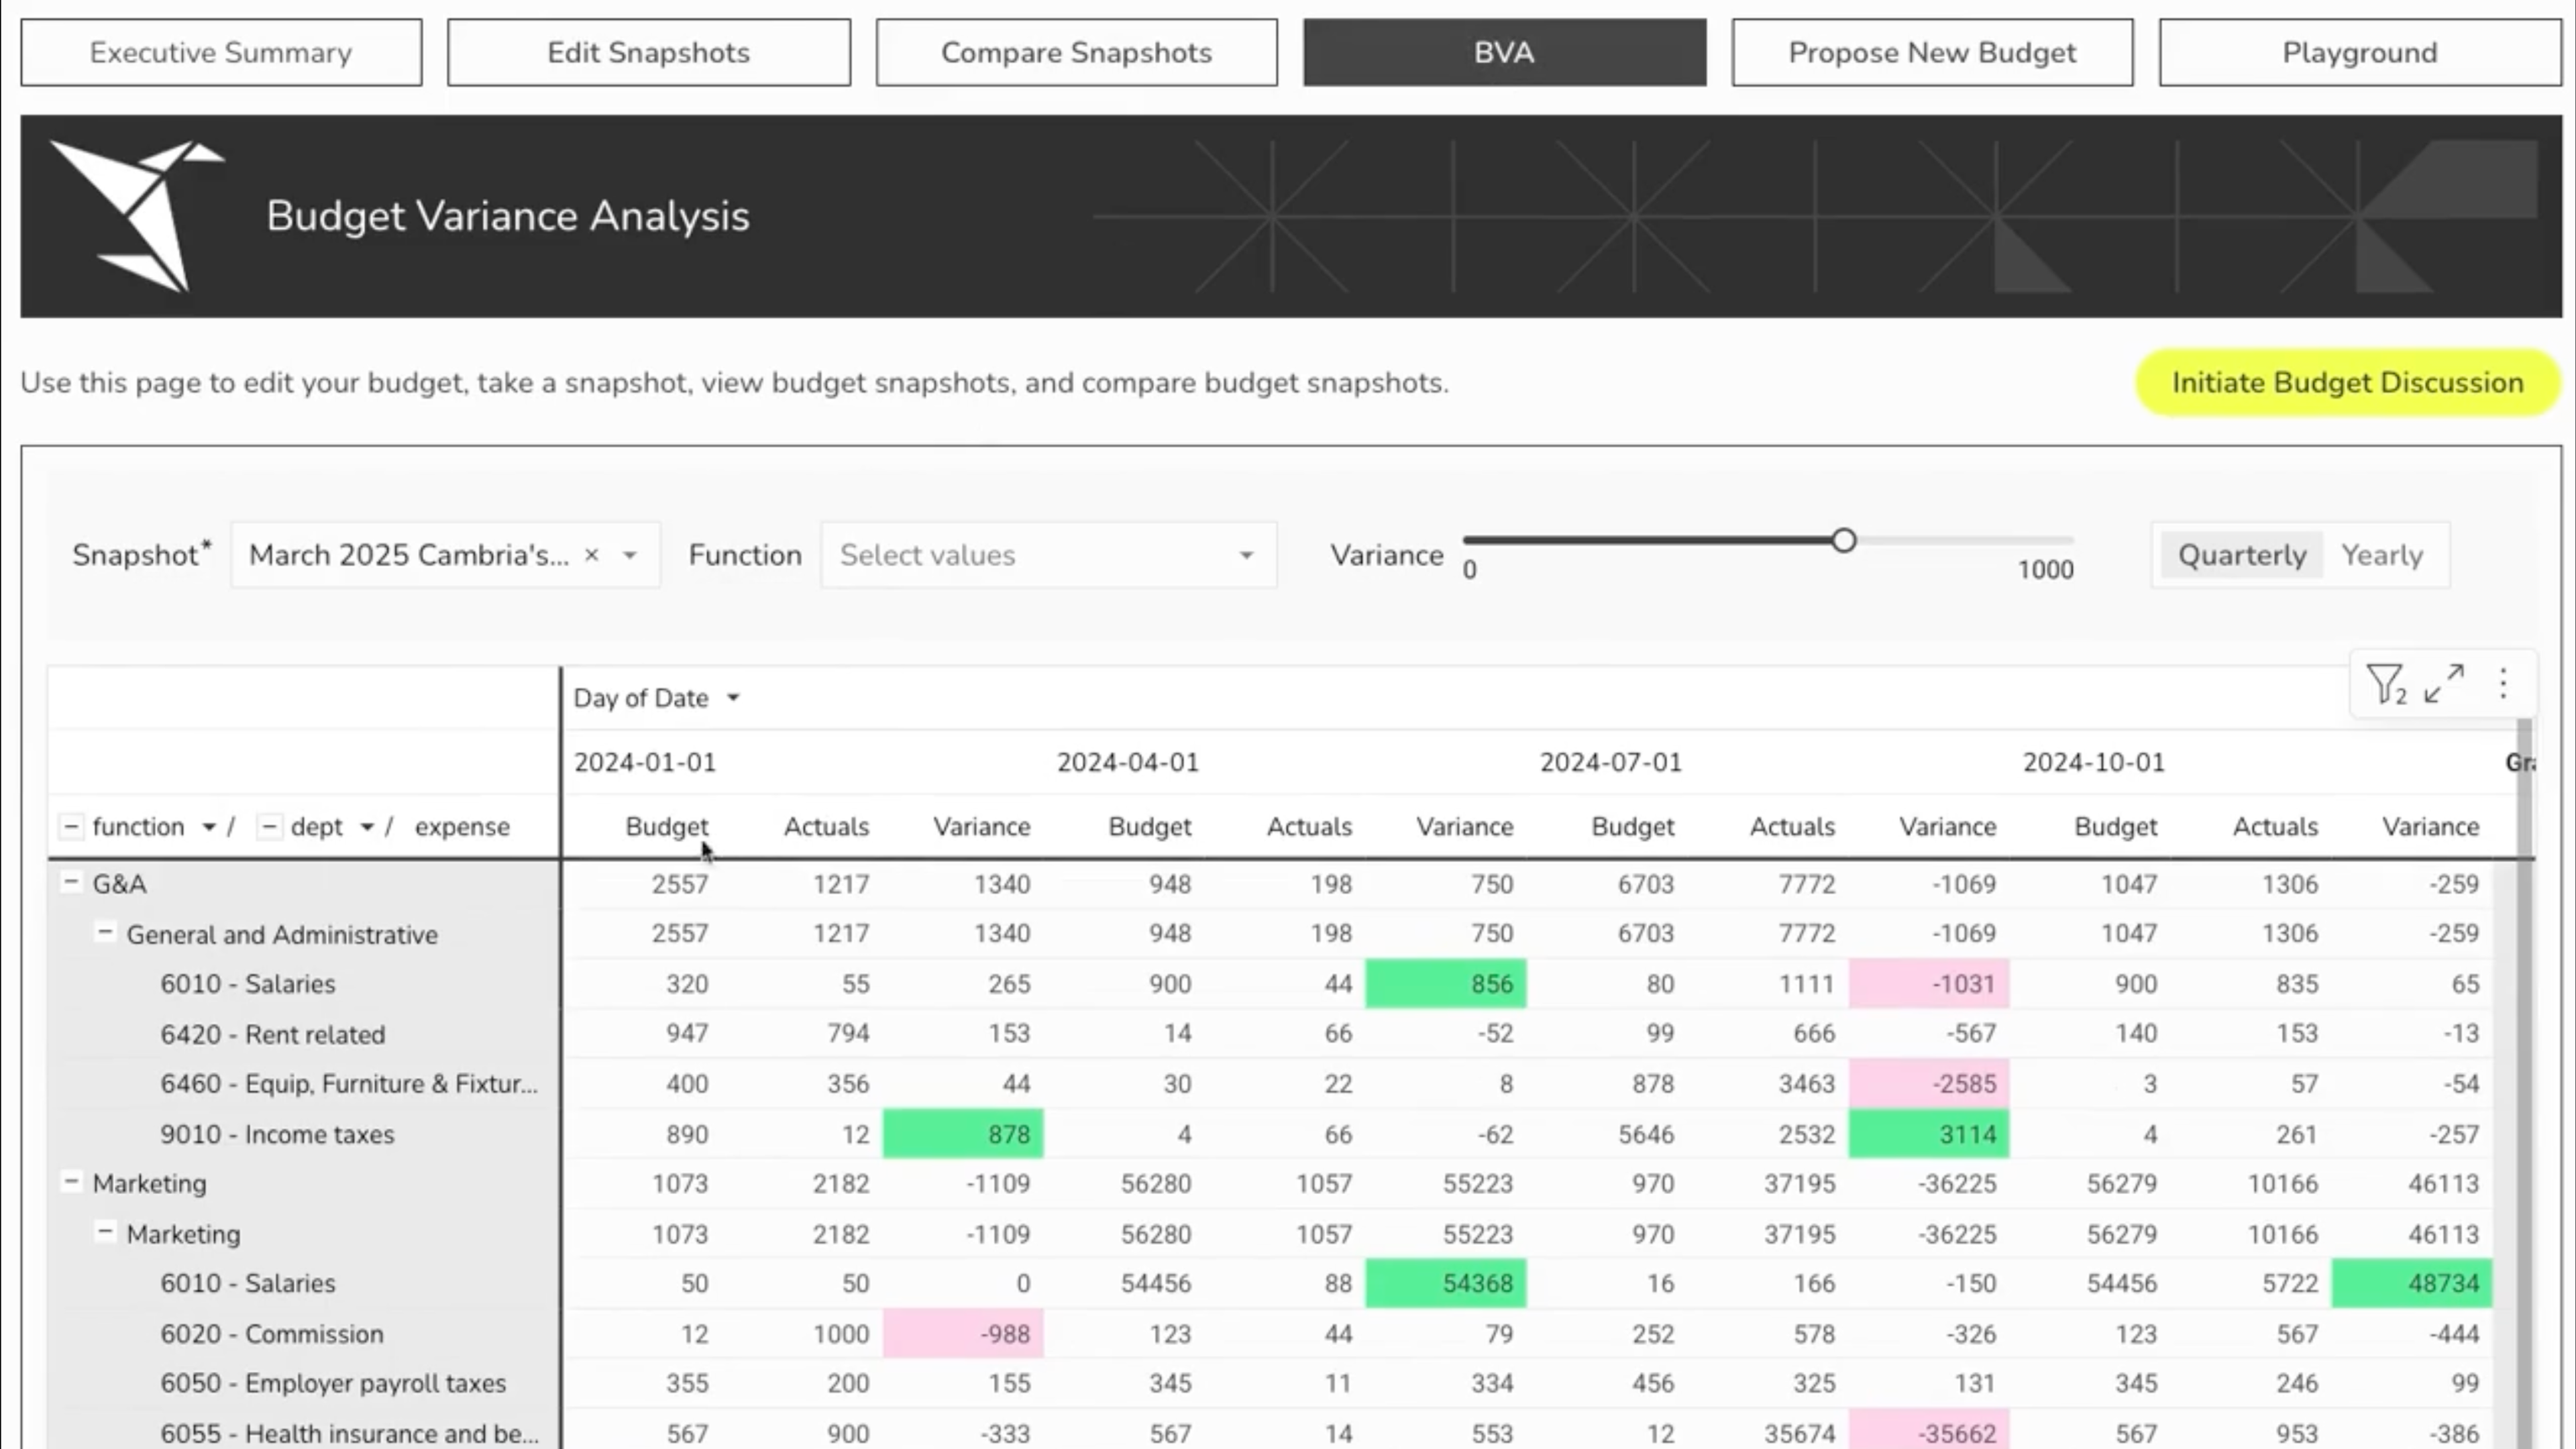
Analyze budget vs. actuals on live data. Track variances, update forecasts, and route approvals in a governed AI app.
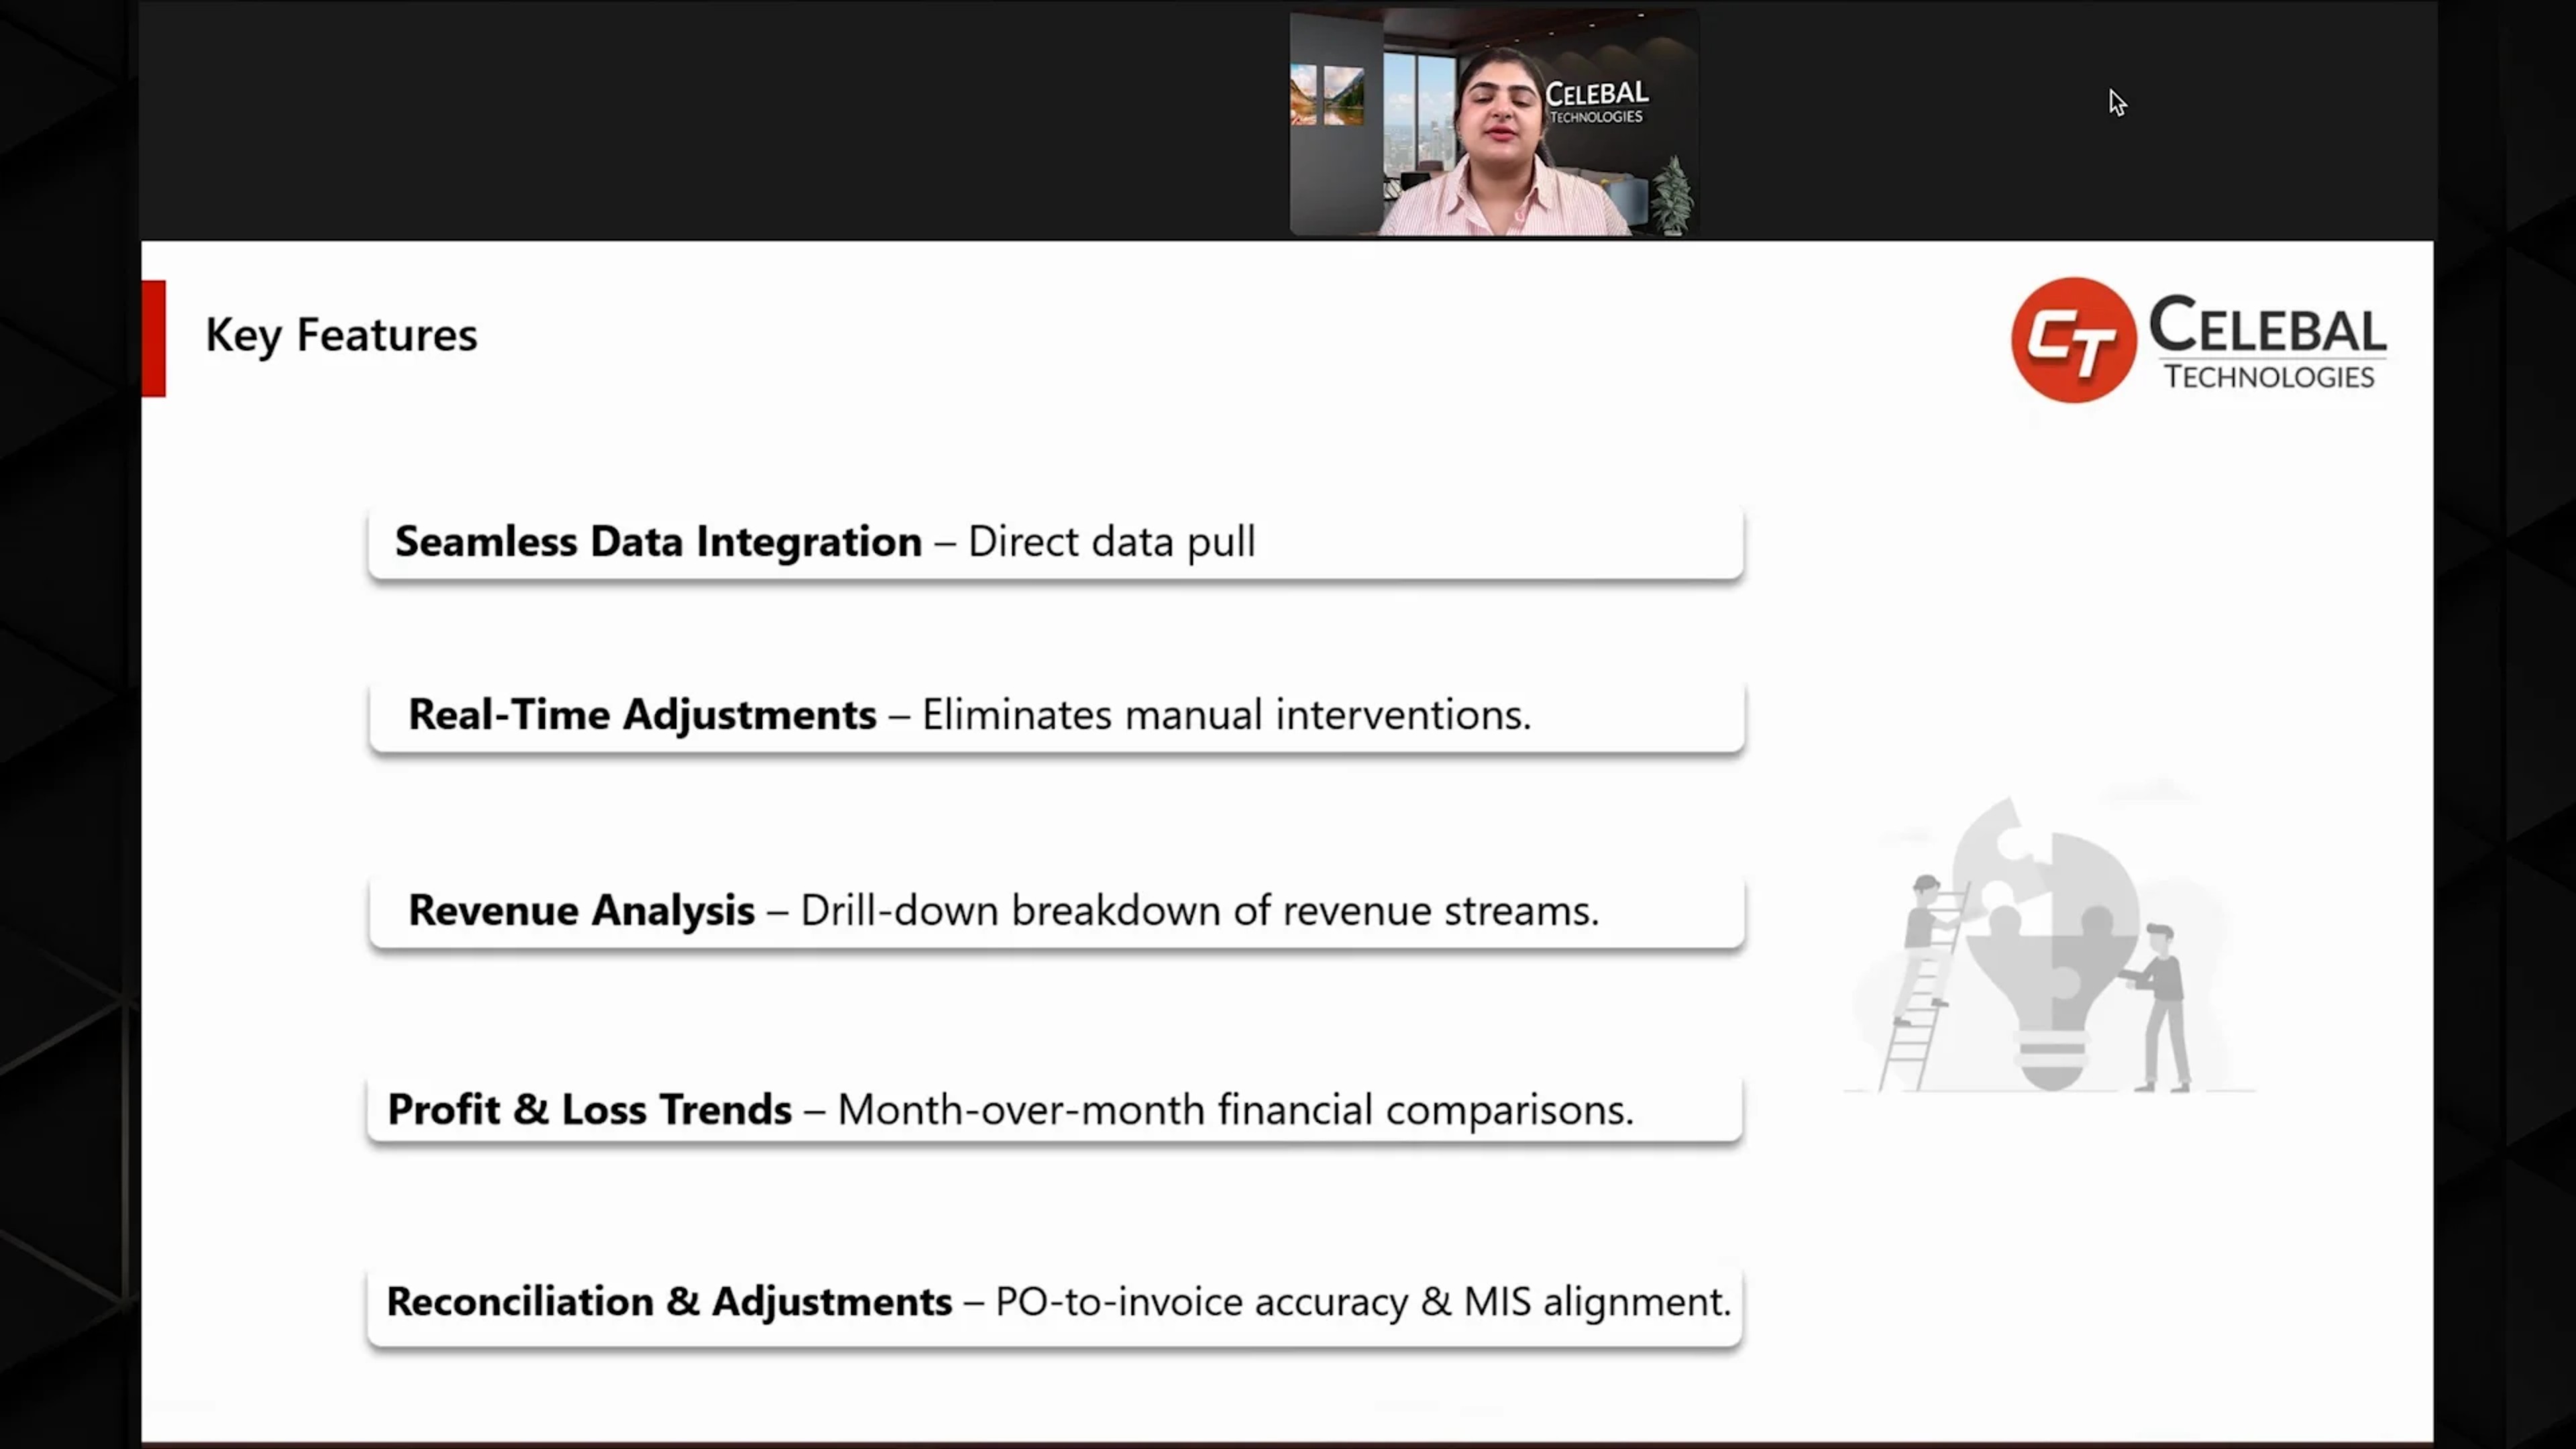
Centralize financial data and automate reconciliations. Real-time insights for complex month-end close processes.
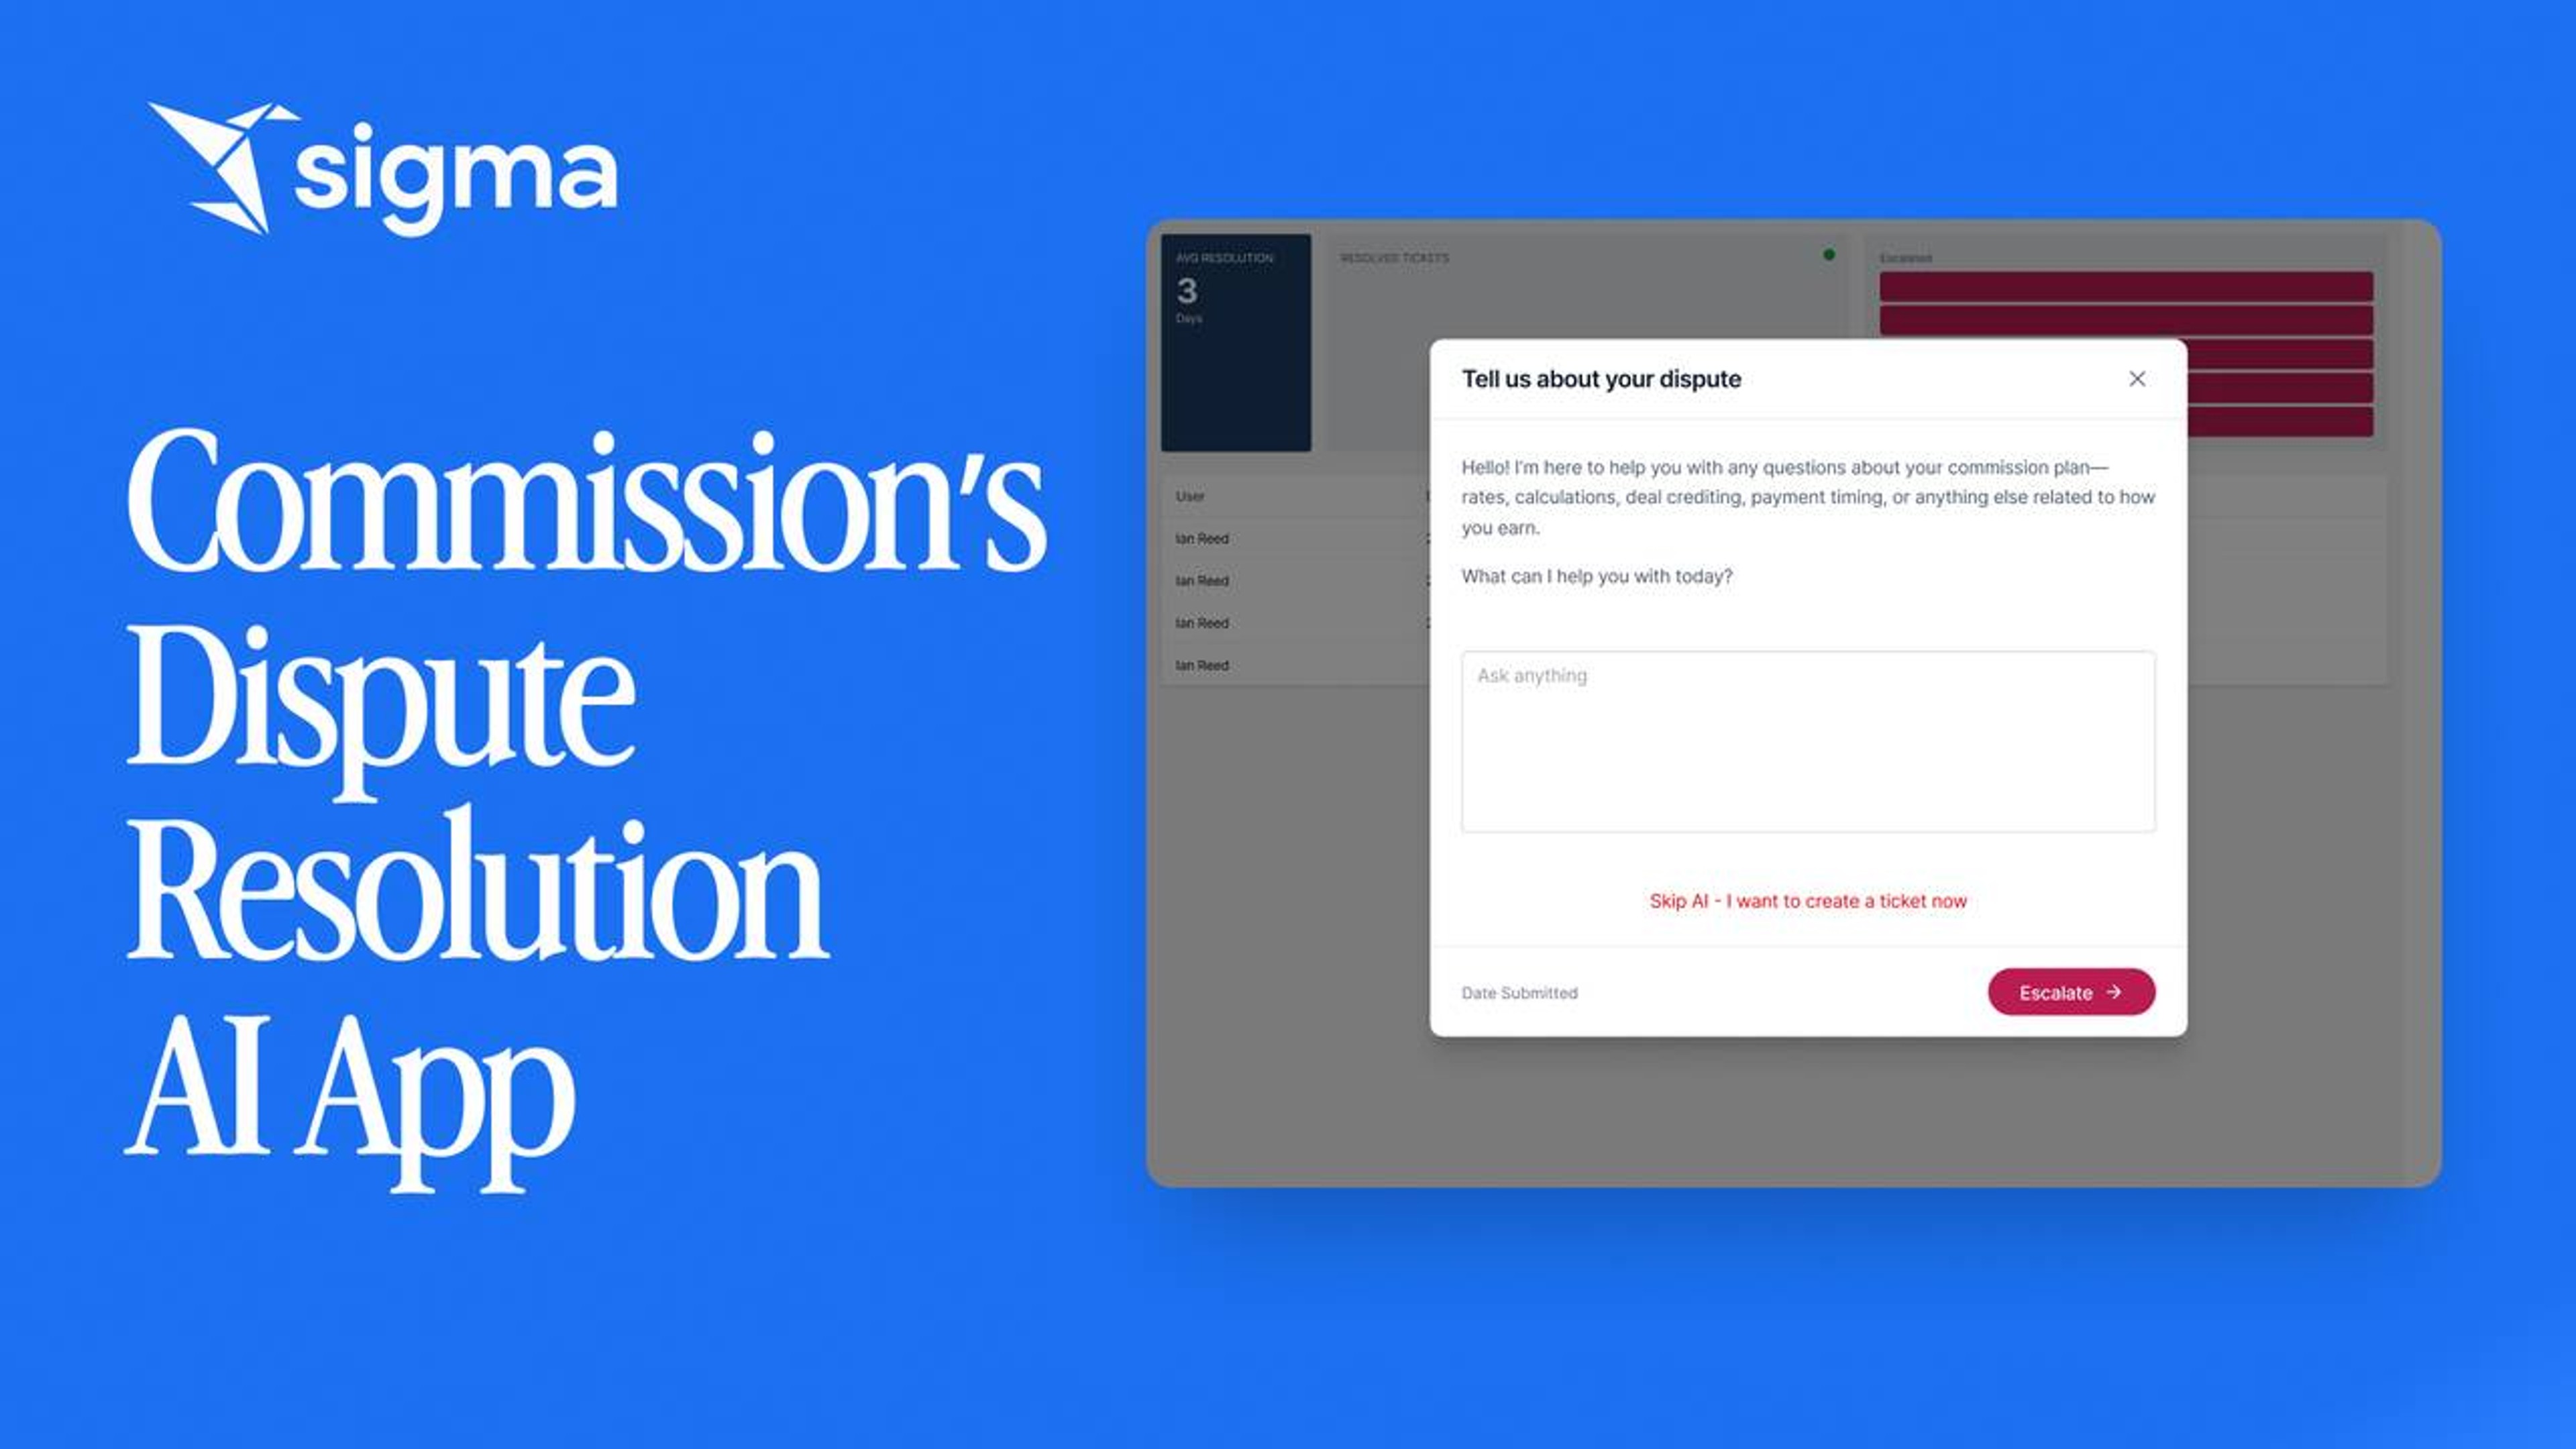
Cut commission disputes by 75 percent. An AI app gives reps the structure behind their payouts, lets them submit tickets, and lets ops resolve cases in one place.
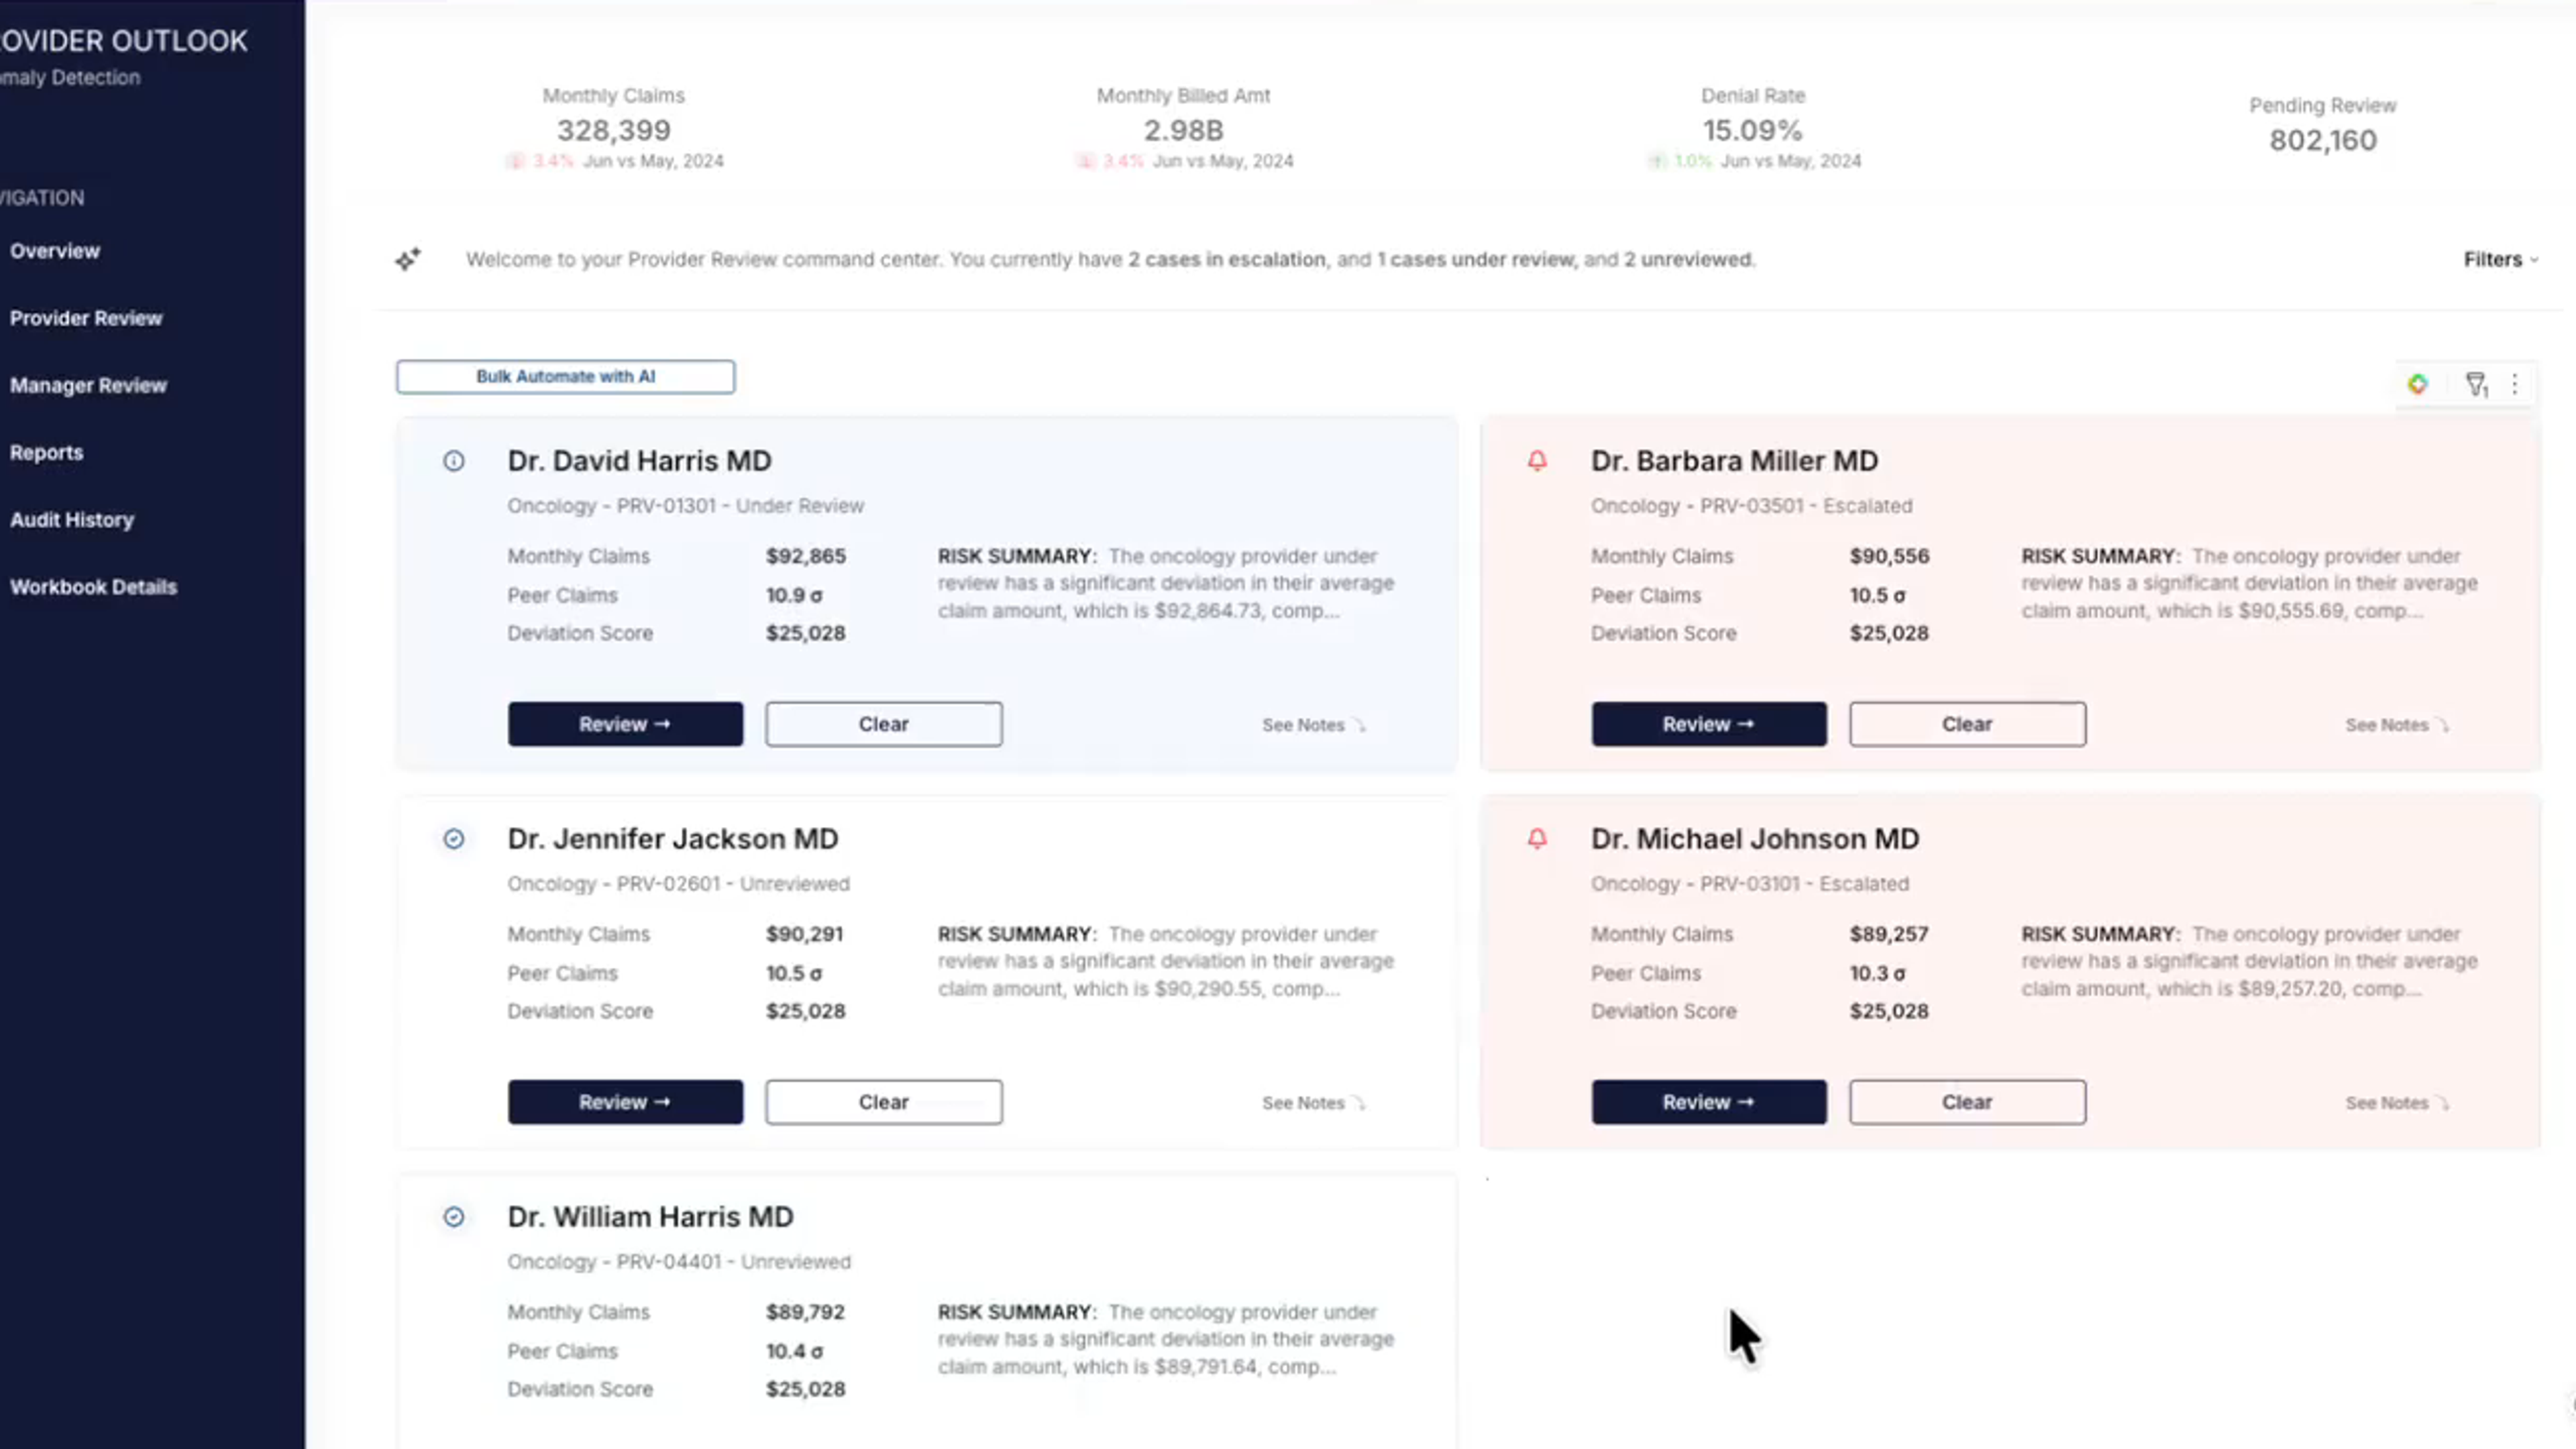
Surface the providers with the most outlier behavior, then work every case with notes, files, and escalation in one place, backed by a full audit trail.
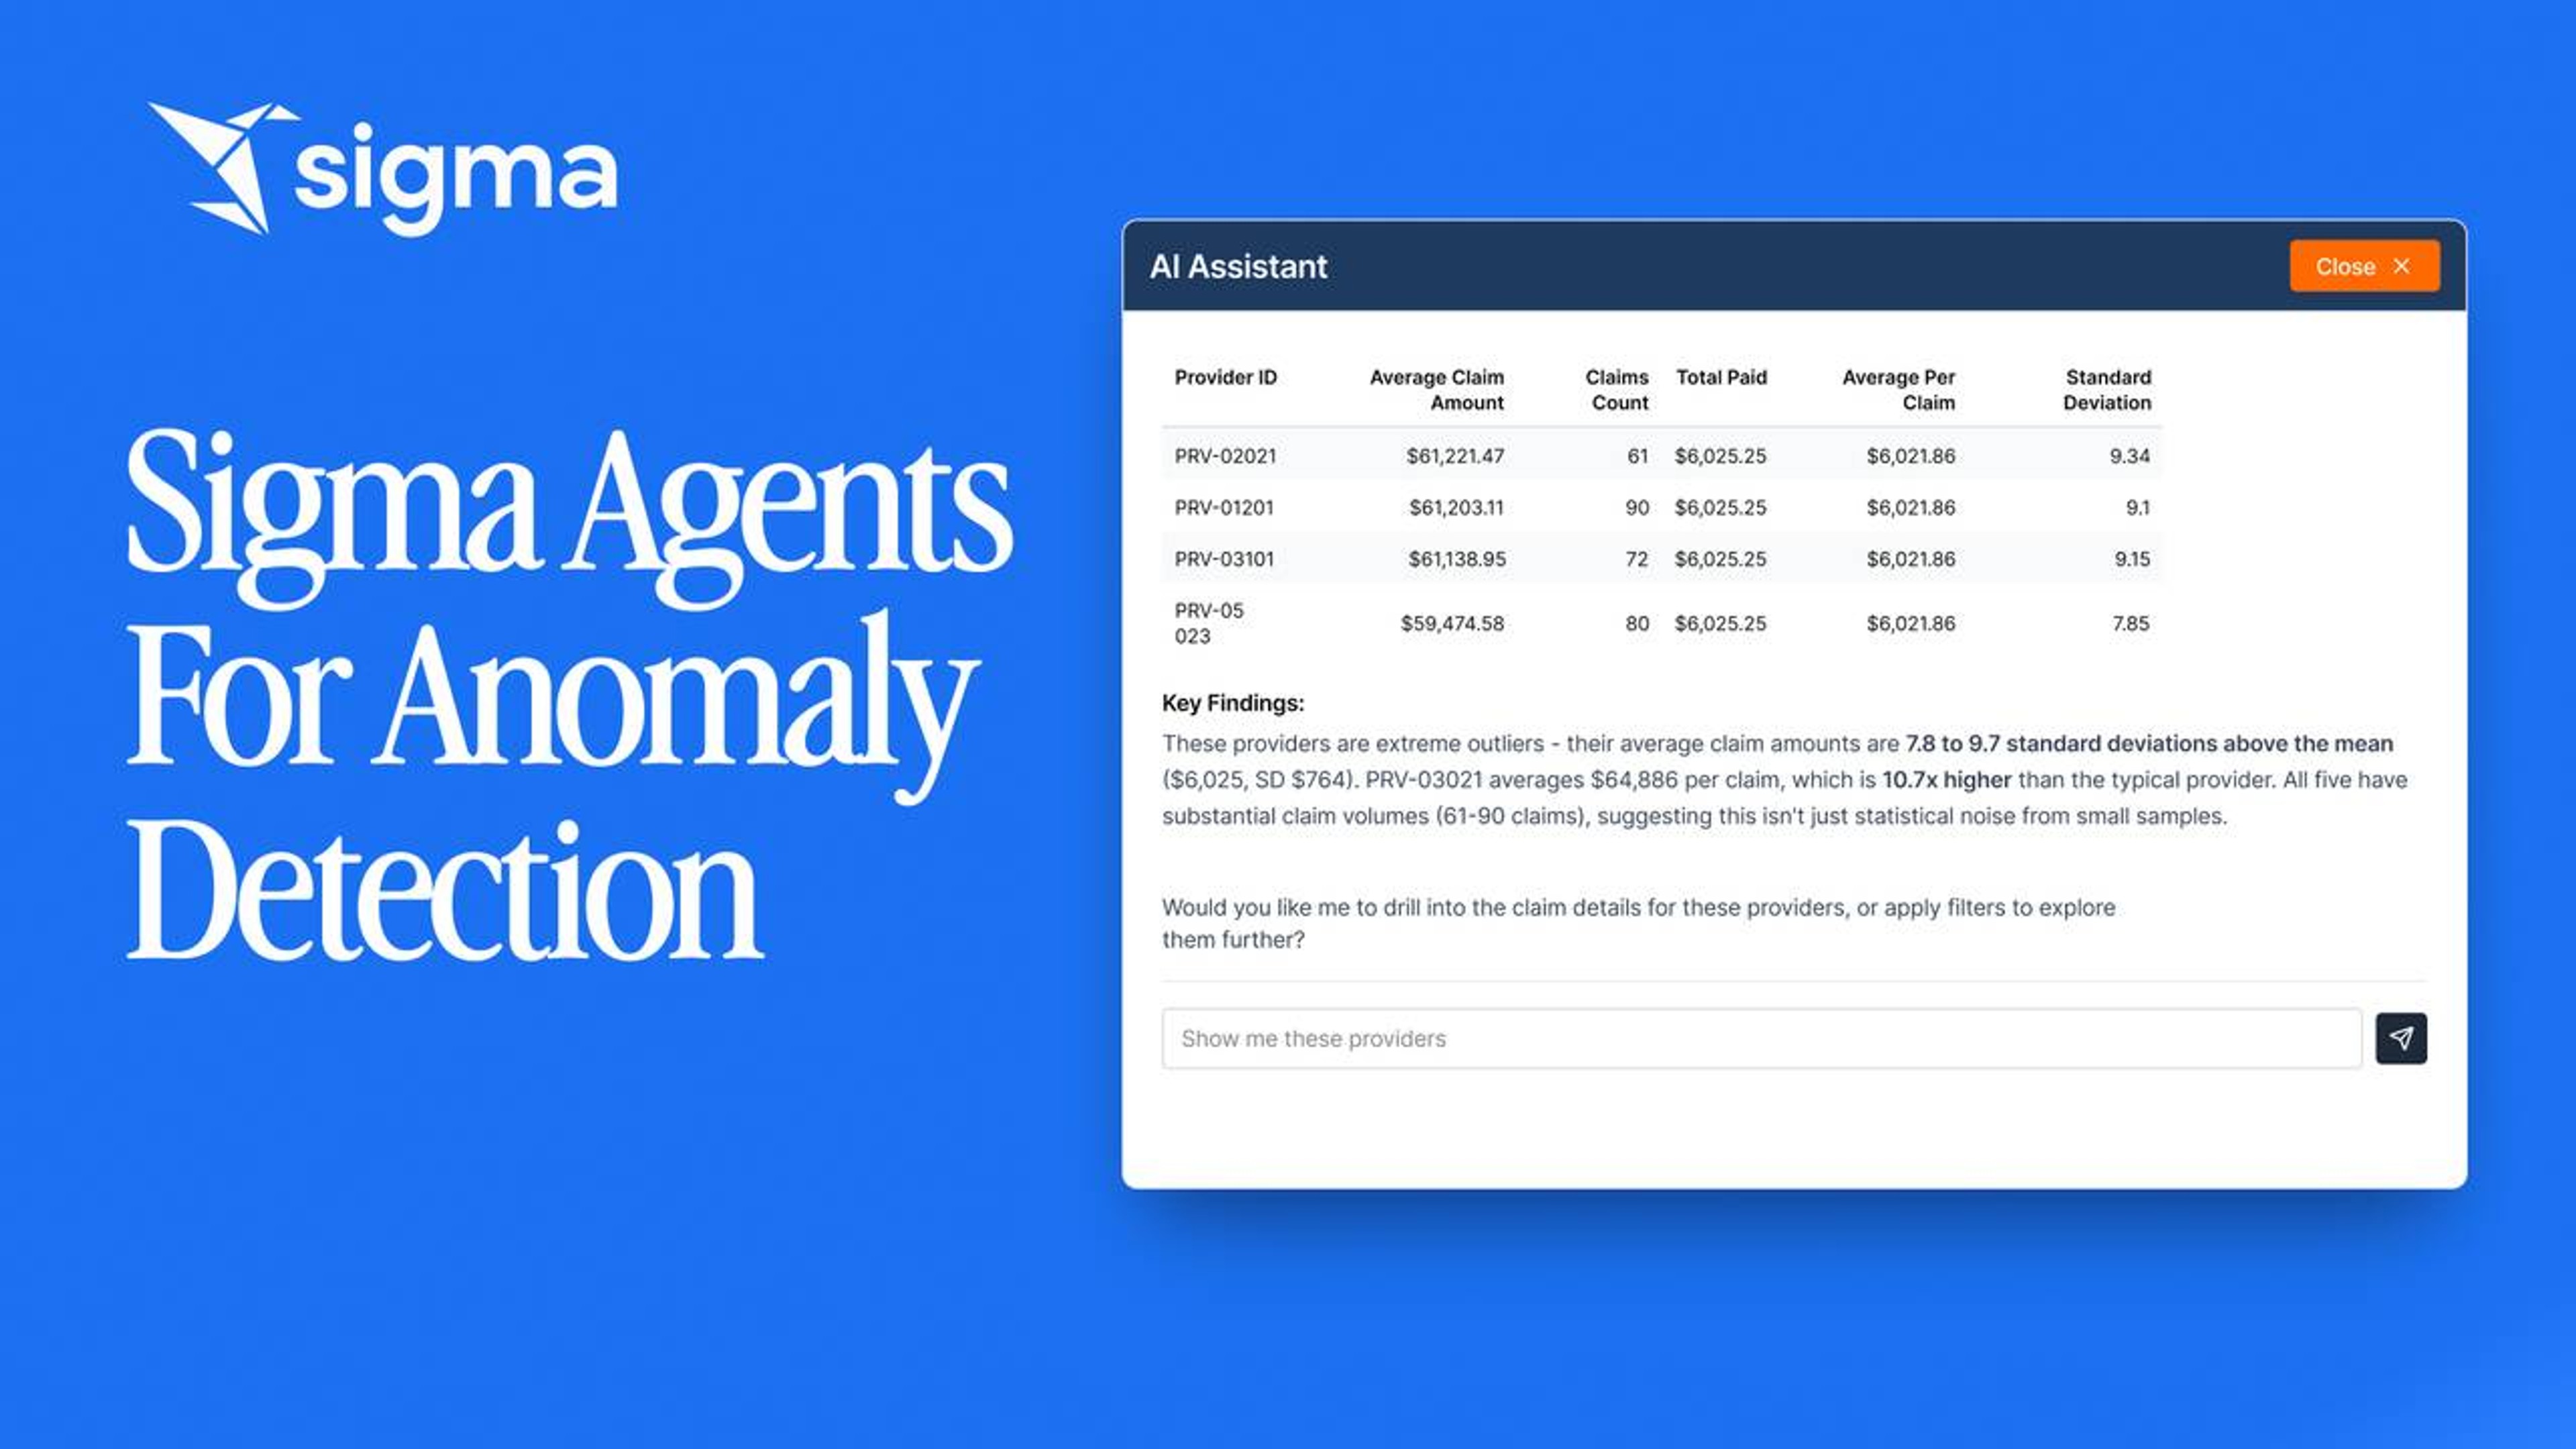
Four differentiators in one app. A claims analyst pulls live data, drills with a spreadsheet UI, writes back changes, and chats with an agent that summarizes the case.
All 7 build on the same live, governed platform.
Dashboards that get to the answer
Own every forecast version
Model every lever on live data
Own your plan in one place
Project tracking you can act on
Fix reference data without a ticket
See a live reconciliation on your own warehouse data, and swap period-end scrambling for a close that runs continuously.
Schedule demoStop buying a new tool for every workflow. Build it once on governed data, then scale it across the business.