
No exports. Excel on the cloud.
It looks like a spreadsheet, but it scales to billions of rows and updates your warehouse in real-time. Stop exporting to CSV.
Request a DemoAbout Spreadsheets in Sigma
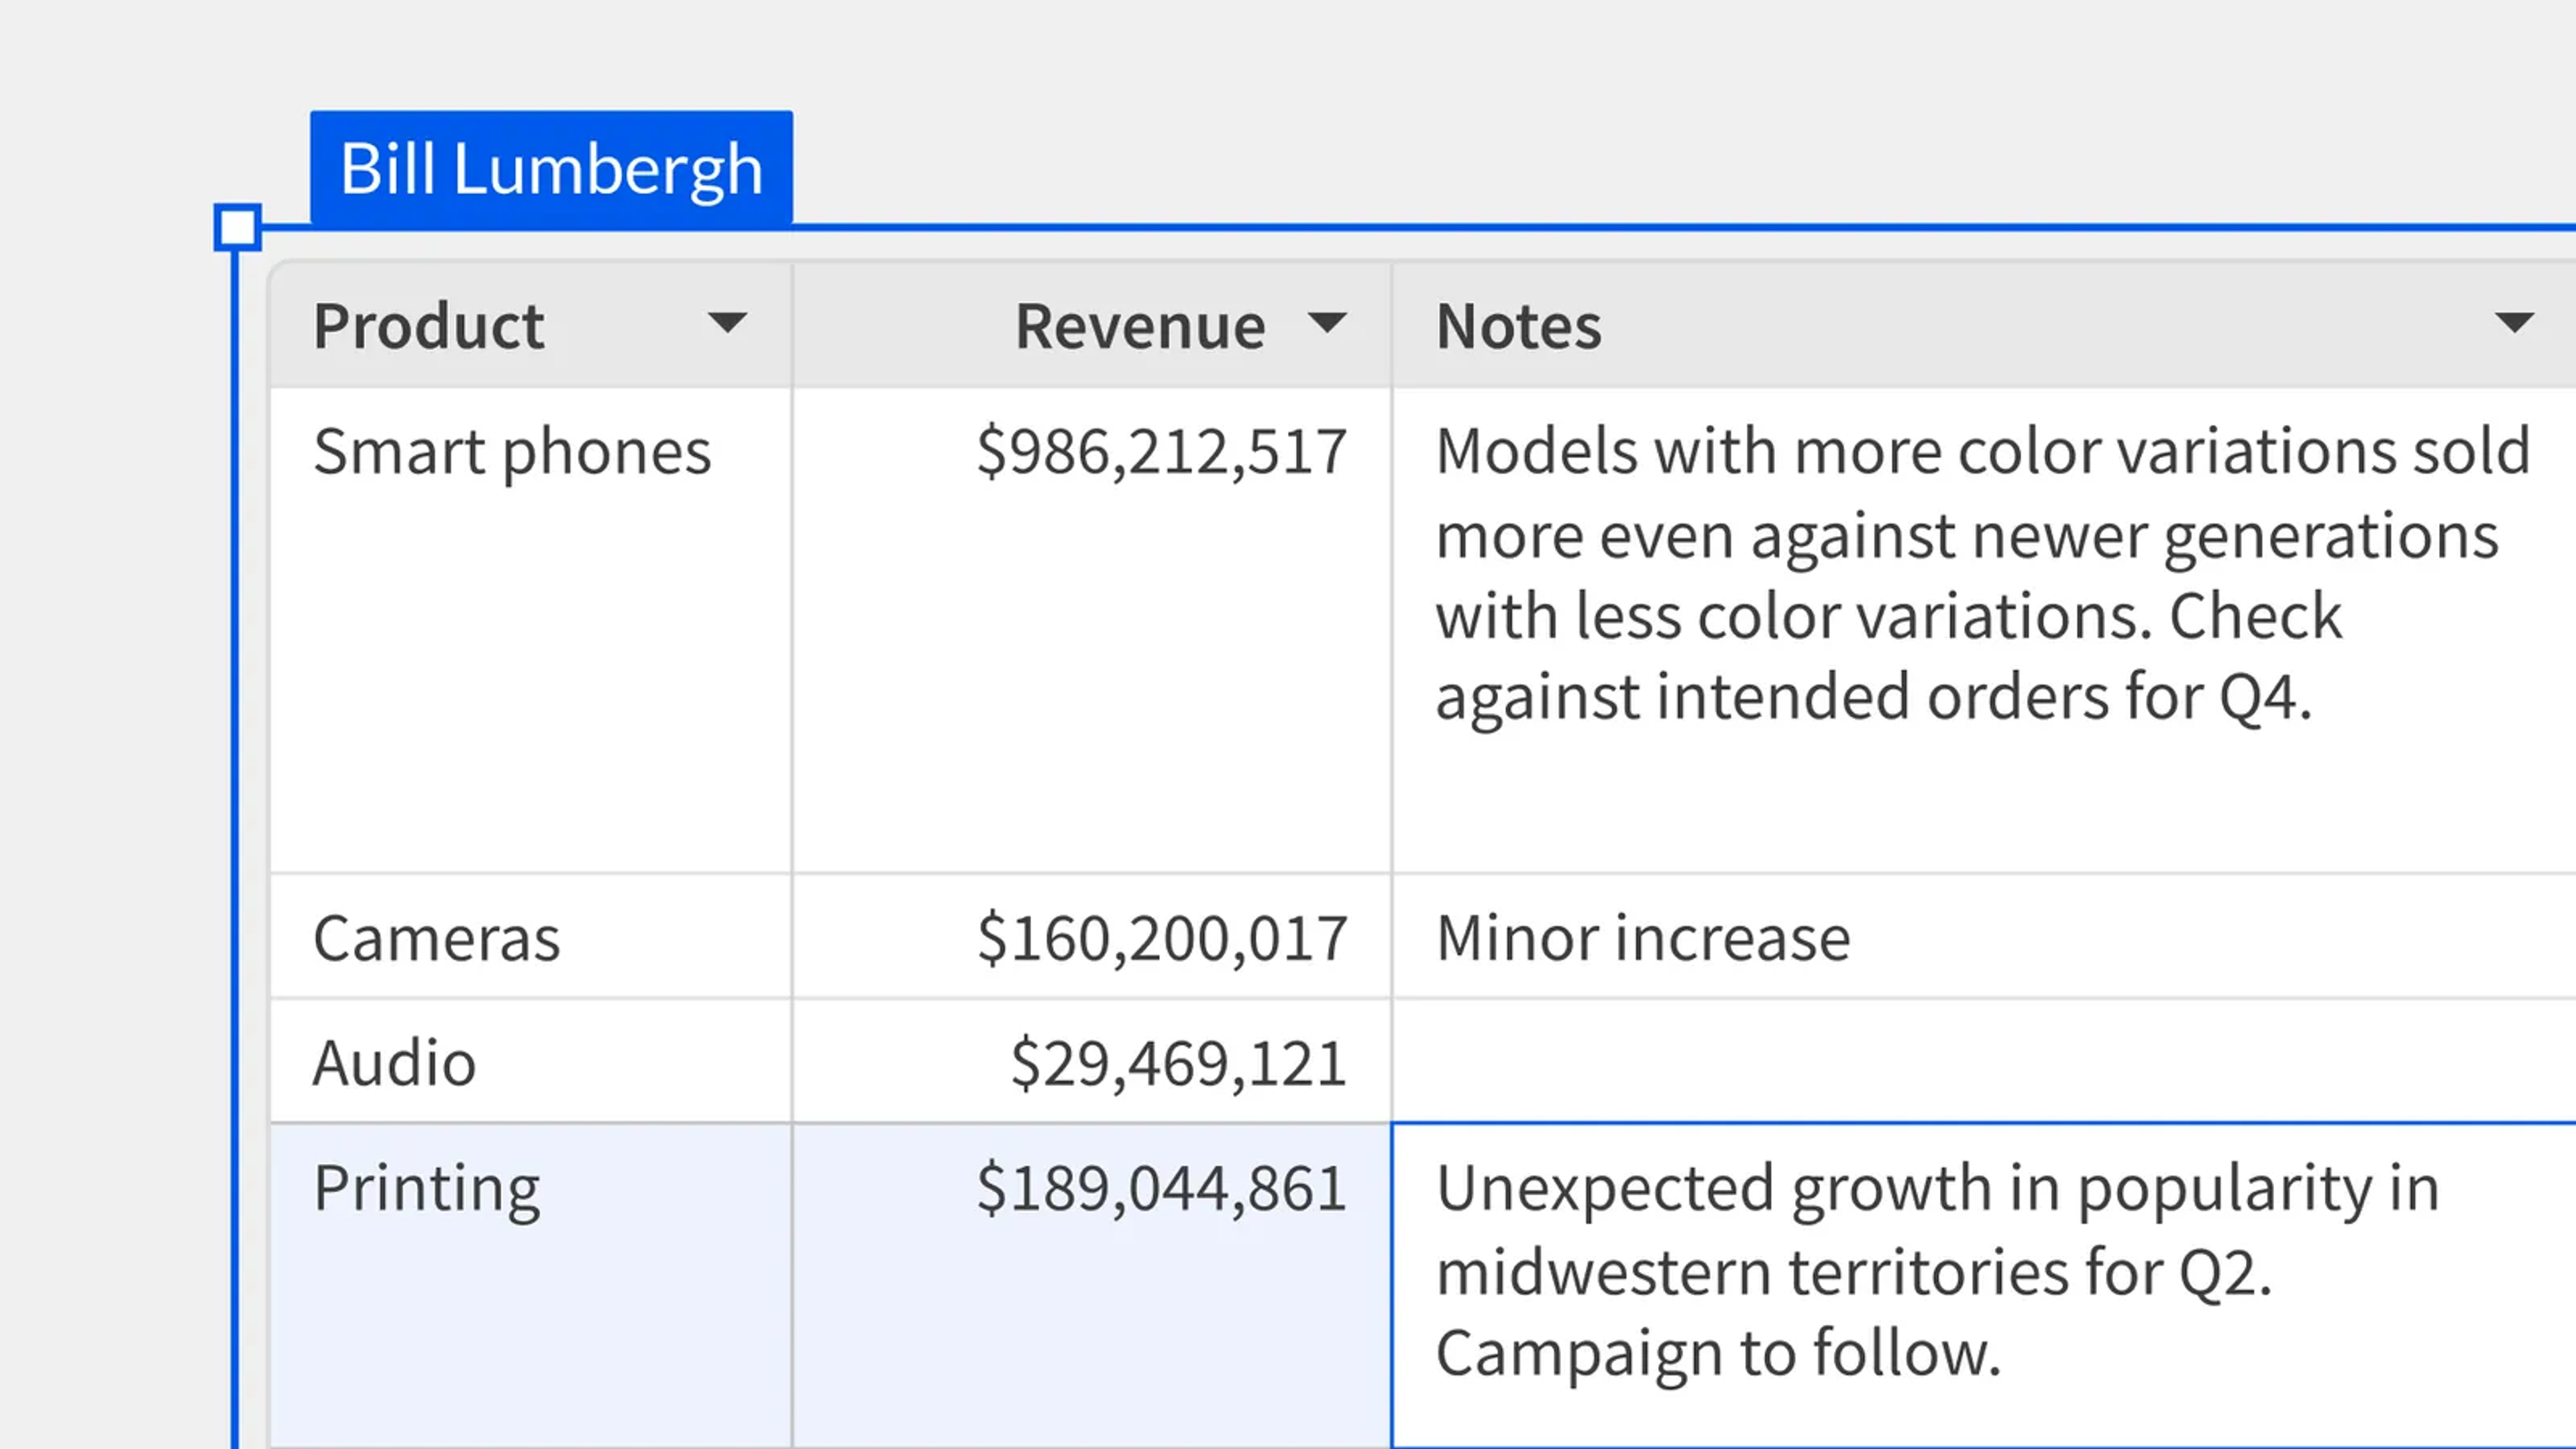
Teams don’t want to give up Excel. They want to fix it. Sigma keeps the grid, formulas, and pivots people rely on, but runs them on live warehouse data. With Sigma there is no need for exports, version chaos, or row limits. Just governed flexibility at enterprise scale.
Trusted by finance and corporate strategy teams at leading global enterprises
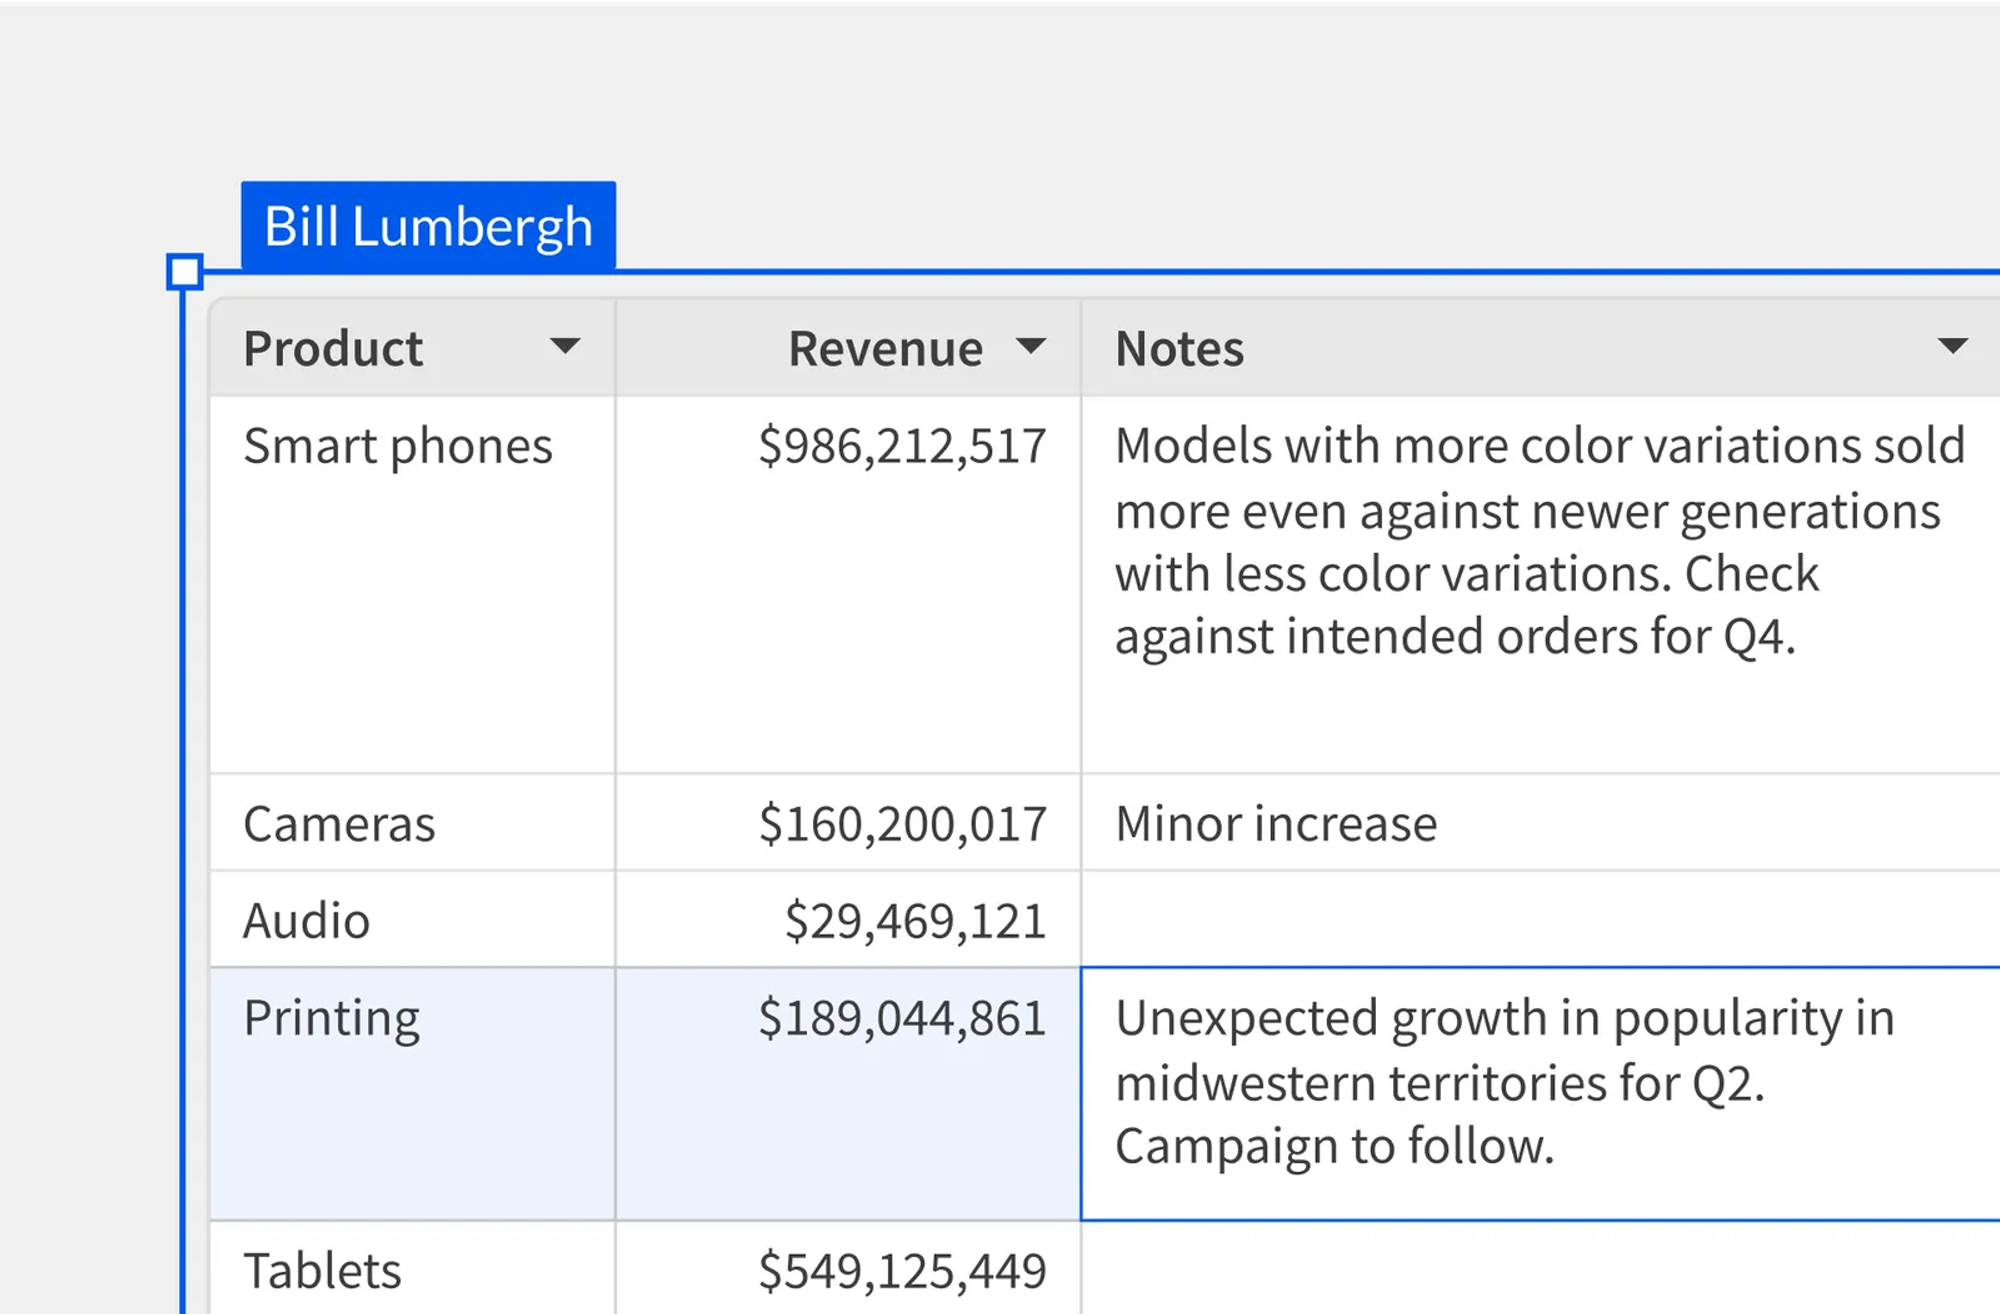
Familiar to everyone
Skip the training curve. Sigma's spreadsheet interface lets teams work with formulas, pivots, and filters—just like Excel—but connected to live warehouse data.
Writeback for planning
Capture human inputs alongside live data. Input tables let you type budgets, goals, and scenarios directly into Sigma, then compare them to actuals in real time.
Every change tracked
Built-in audit trail shows who changed what, when—no more emailing files or wondering which version is correct.
Work the way you know
The only platform where you can analyze data, input new values, and trigger warehouse actions in a single, governed loop, all from a familiar interface
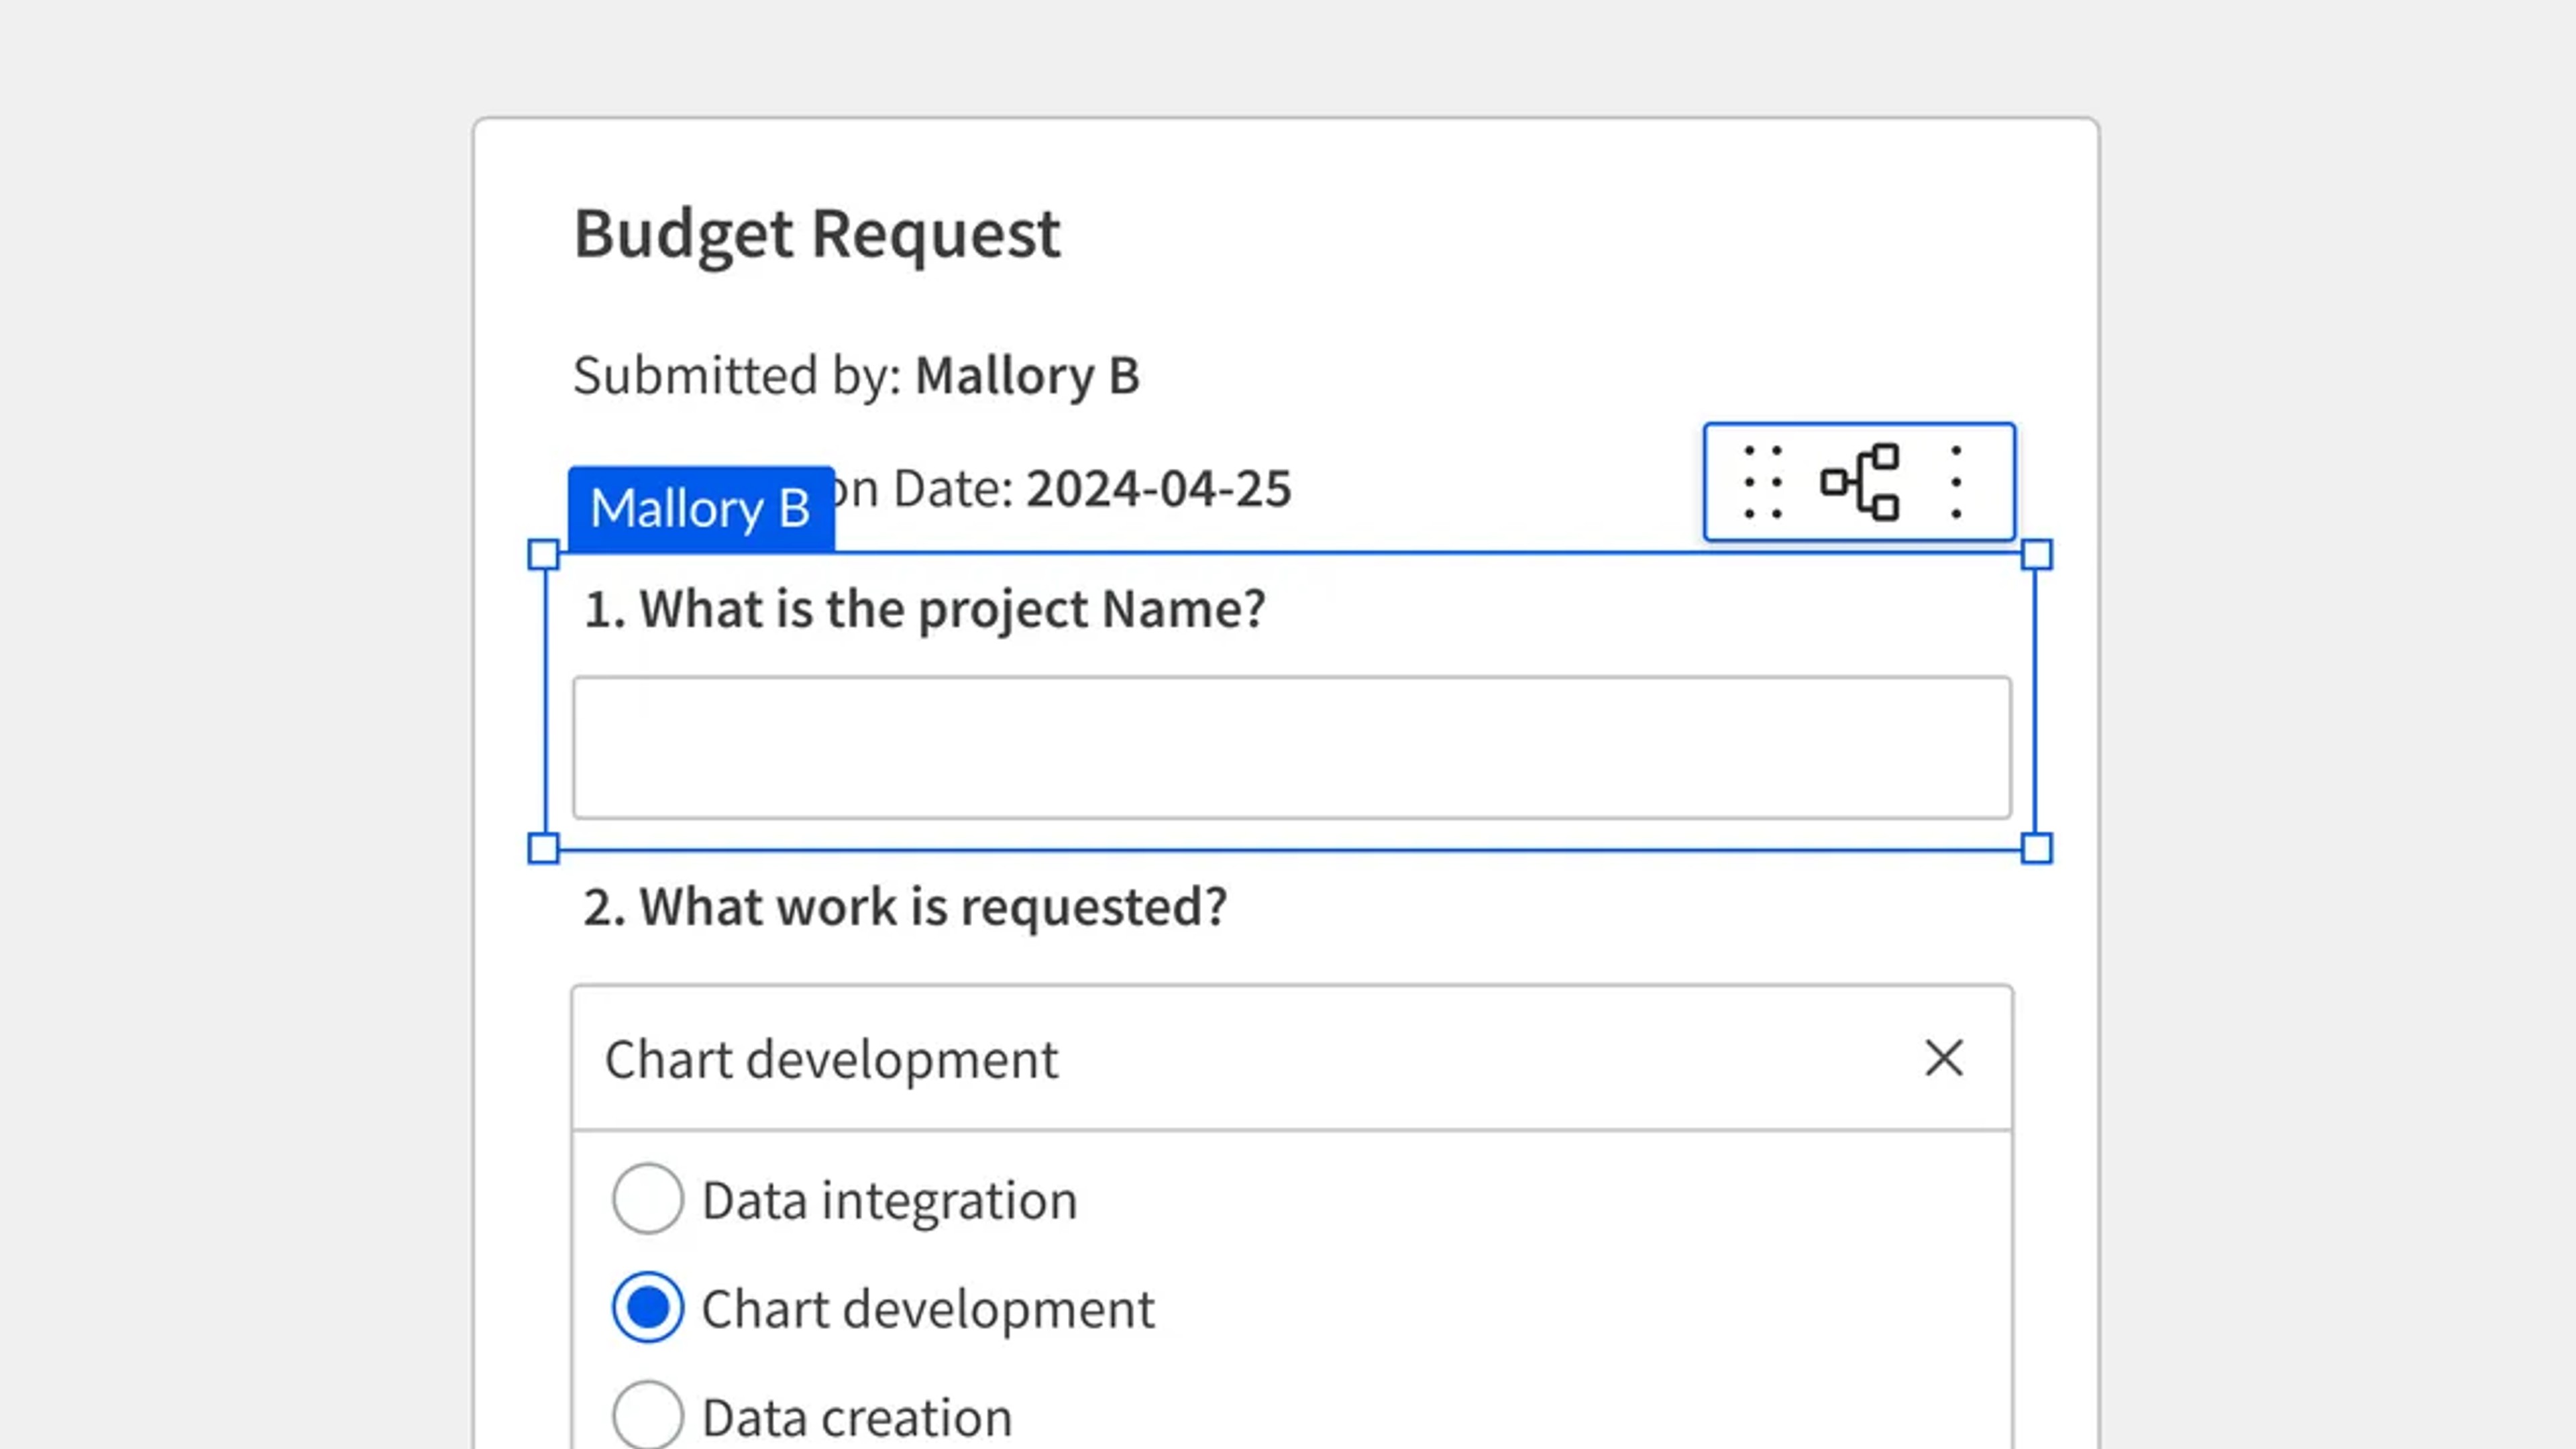
Plan and write back with Input Tables
Input Tables are built for the moments when humans need to add or change values, not just analyze them.
- Type budgets, targets, and scenarios alongside live actuals
- Edit cells or paste rows into Input Tables
- Write updates back to a warehouse table
- Keep a full audit trail of changes
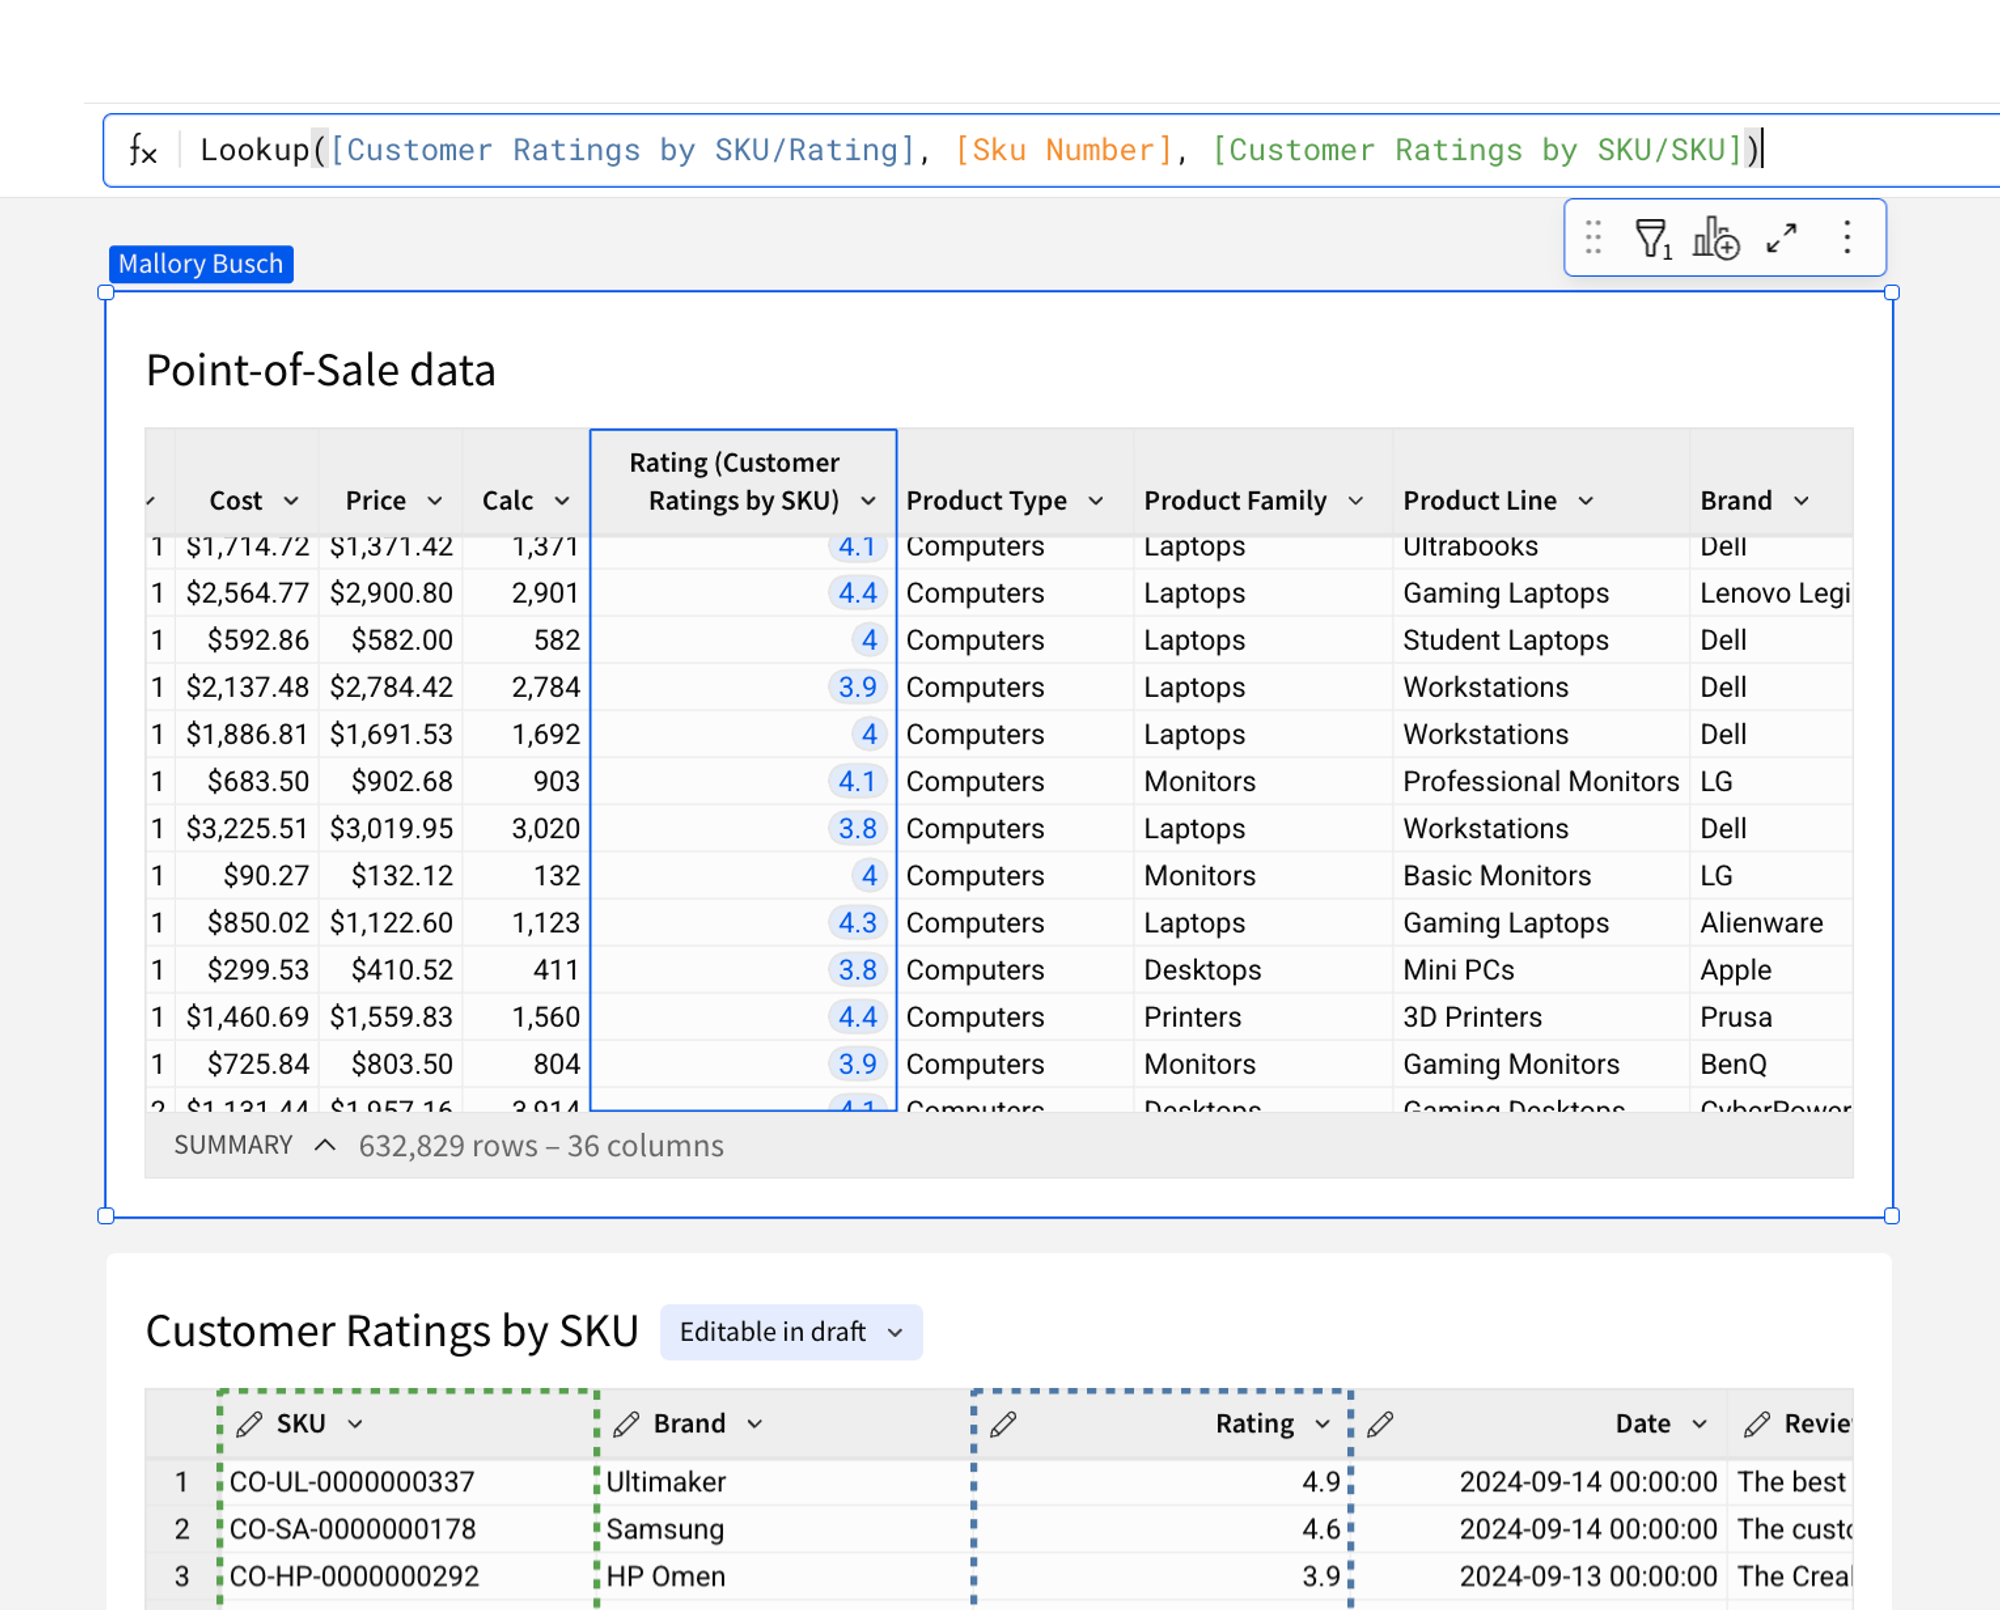
Use familiar formulas
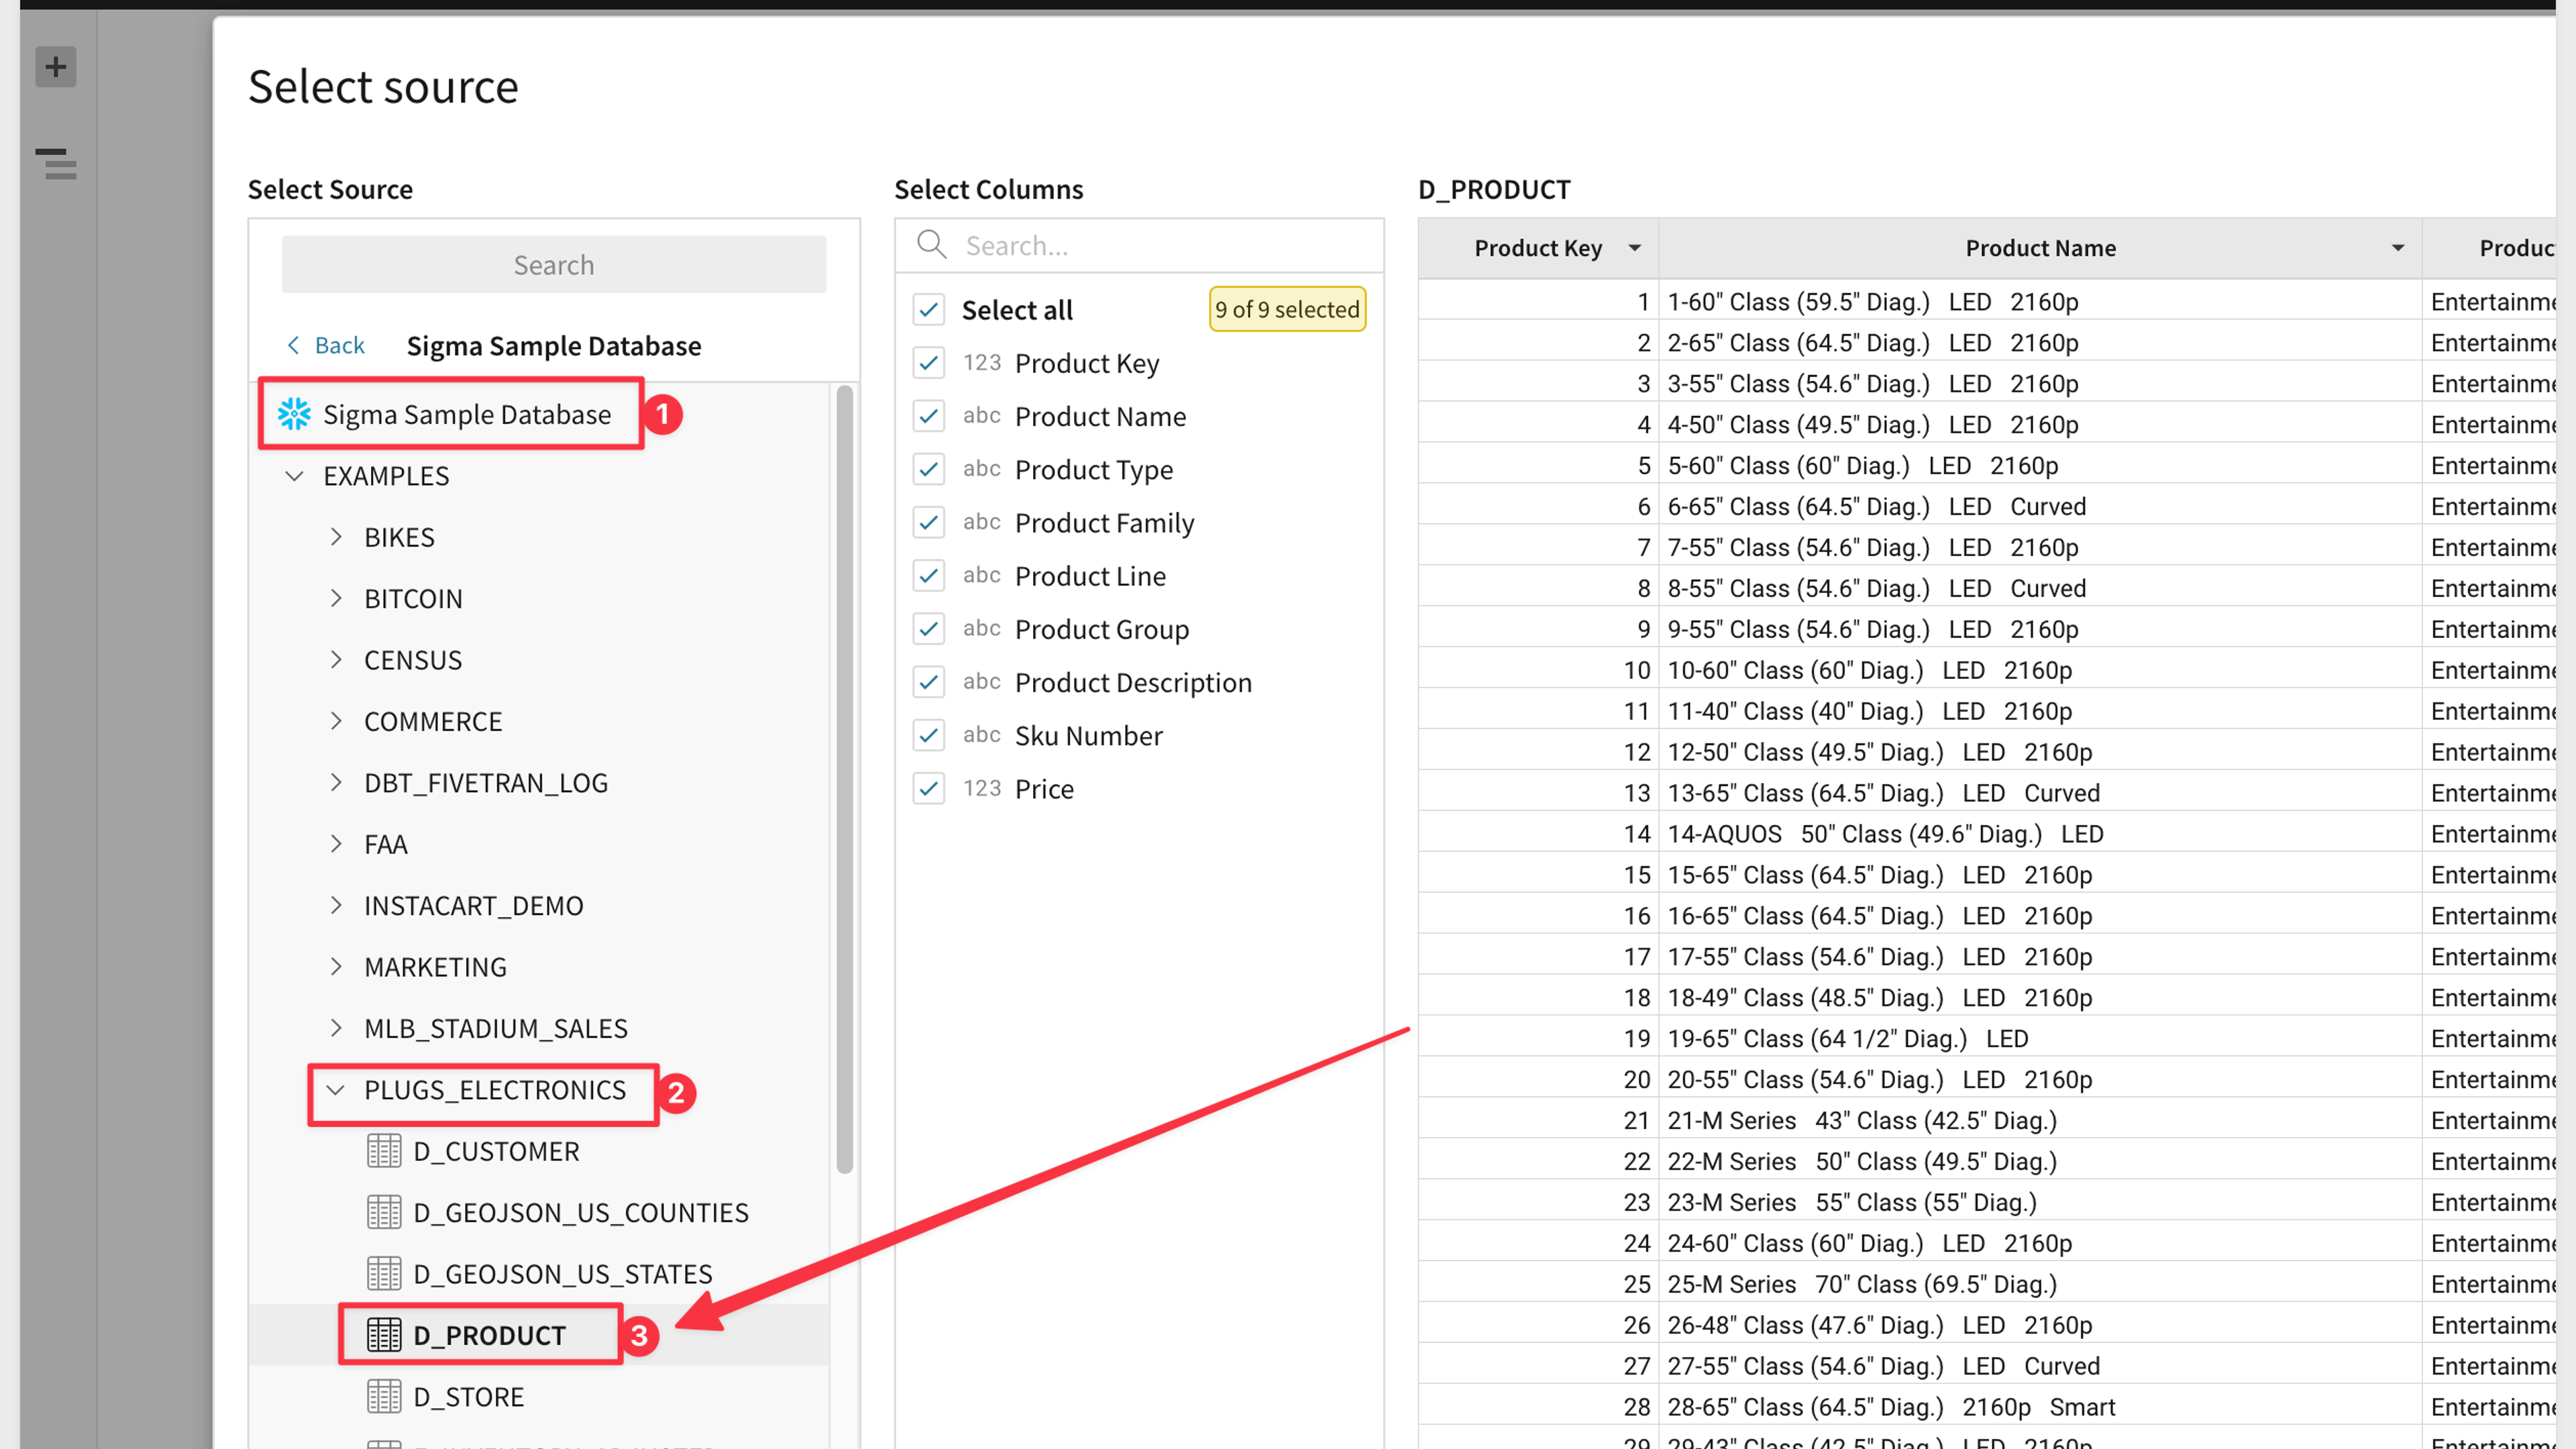
Work with 200+ functions on billions of rows of live data in your warehouse. No proprietary coding required.
- Logical & Text: Clean and manipulate strings at scale.
- Window & Rank: Perform advanced analytics across partitions.
- Date & Time: Handle complex time-series logic easily.
AI in spreadsheet columns
Use AI Query to generate new values from your data and bring the result back into the spreadsheet. Once it’s in a column, you can filter, pivot, and chart it like anything else.
- Create AI-derived fields as columns you can analyze
- Use AI Query functions to call a warehouse function and return results to the sheet
- Keep your workflow in one governed workbook, on live warehouse data

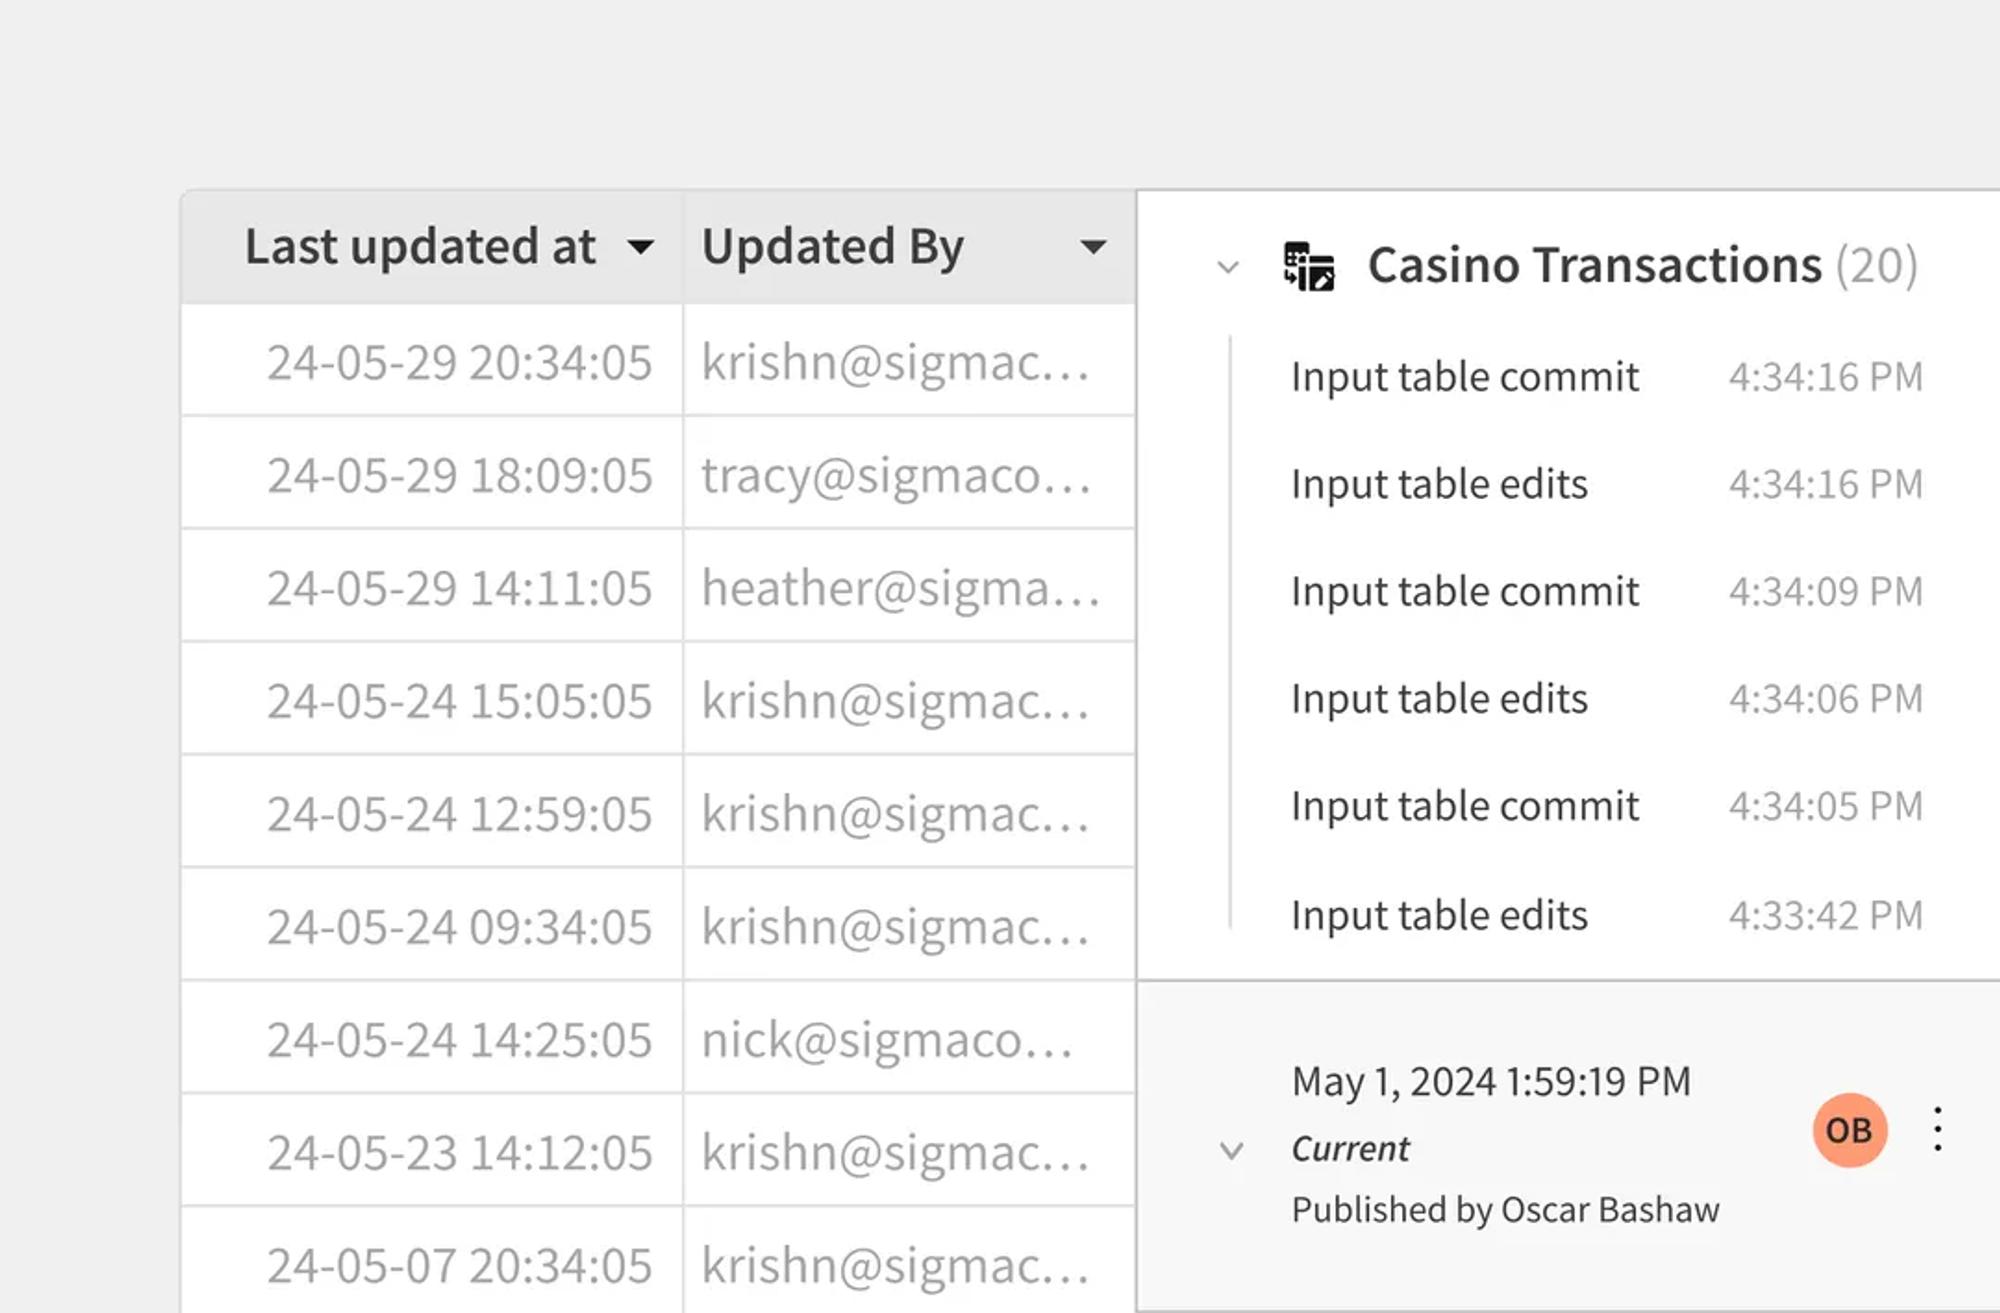
Audit Every Edit
Unlike Excel, every cell change is tracked. Who edited what, when, and why. Complete audit trail for compliance and rollback.
- See who changed what, and when
- Reduce version confusion from emailed files
- Enable audit logging when you need a longer-running activity record
Customers who excel in Sigma
See how organizations use Input Tables to work inside the warehouse.

 Customer Story
Affirm’s Josh Cho turned dashboards into AI Apps with Sigma—automating reviews, improving accountability, and winning Data App Builder of the Year.


Related Resources
Building AI Applications with Sigma Input Tables
Learn how easy it is to enable governed data entry through forms or a spreadsheet UI.
Sigma Input Tables Overview
Understand the fundamentals behind adding data into Sigma without overwriting your source data
Sigma Input Tables Quickstart
Walk through the guided steps required to recreate three unique use cases that leverage Sigma input tables.
Sheets and Input Table FAQs
Common questions about Sigma's spreadsheet experience.