Best Big Data Analytics Tools in 2026

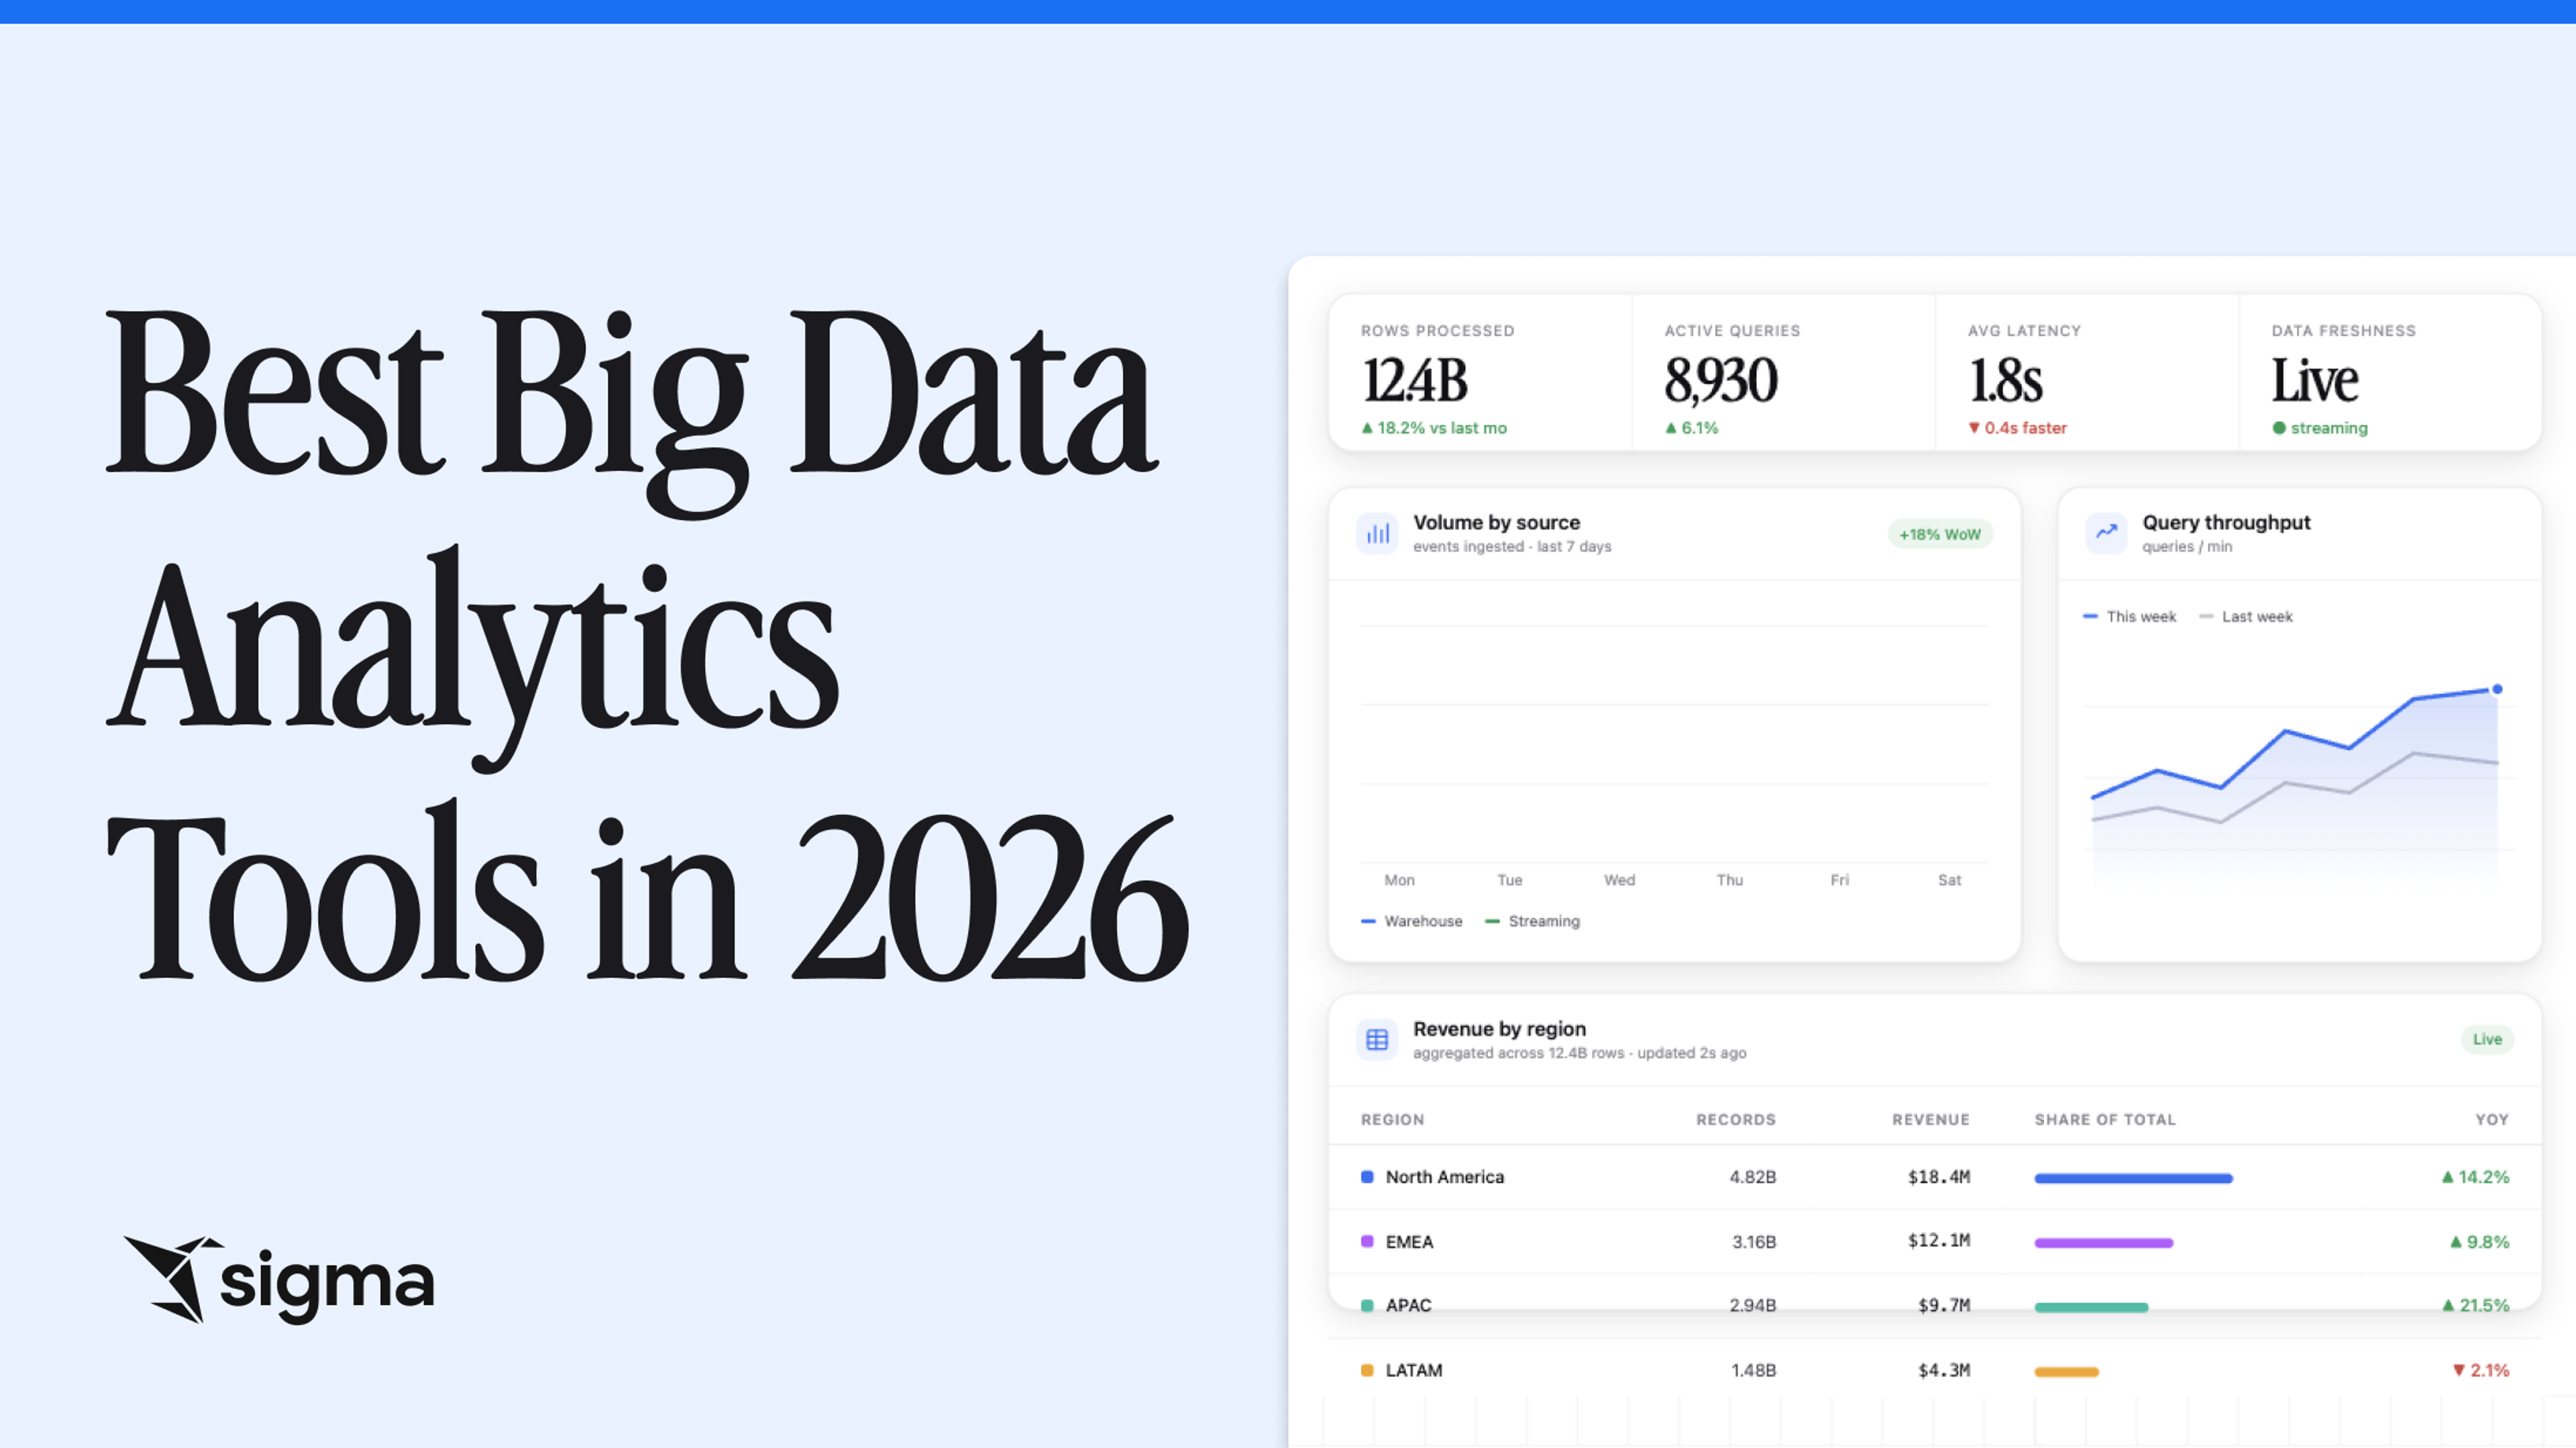
Big data analytics tools are the interface layer between the cloud data warehouse and everyone who needs to work with its data, from business users and analysts to AI agents. They cover dashboarding, self-service exploration, AI-assisted analysis, writeback, and agentic workflows on governed data.
The architectures underneath big data analytics now matter more than the chart libraries on top. Some big data analytics tools compute directly on the cloud data warehouse as warehouse-native compute. Others extract data into proprietary engines, replicate governance, and produce snapshots that drift out of date.
This article evaluates five big data analytics tools across architecture, AI grounding, self-service, governance, and pricing.
How we evaluated the big data analytics tools
We evaluated the big data analytics tools on the key criteria that typically matter during real evaluations.
- Architecture. Warehouse-native architecture keeps data fresh and governance intact, while extraction creates copies that age and duplicate security models.
- Interface and self-service. The interface decides how many people can use the platform without routing through engineering. Spreadsheet, search, drag-and-drop, and code-based semantic layers each fit different teams.
- Governance. Contextual metadata governance, row-level security, column masking, audit trails, and lineage are automatically carried over when inherited from the warehouse and must be reconciled when not.
- AI and agentic depth. Grounded AI answers questions using the same metric definitions, permissions, and lineage as the rest of the platform, so responses stay accurate and traceable. Ungrounded AI guesses, and the answers drift the moment they leave the demo.
- Pricing model and predictability. Per-user, consumption-based, and capacity-based structures reward different team shapes. Role-based pricing can drive seat inflation when work does not align with role lines, and capacity-based models can gate AI features behind a higher tier.
Governance and self-service are close to table stakes at this tier. Every platform in this guide claims both, and the meaningful differences show up in implementation detail rather than headline capability.
Comparing the five big data analytics tools at a glance
Architecture, pricing model, and AI depth are where the platforms genuinely diverge, and those three carry most of the weight when a team is choosing where to place a multi-year bet.
| Platform | Architecture | Pricing model | AI depth |
|---|---|---|---|
| Sigma | Warehouse-native, no extracts | Per-user (View, Act, Analyze, Build) | Routes through the governed stack, with warehouse and Sigma controls applied |
| Power BI | In-memory import or DirectQuery connections | Per-user + capacity (Fabric) | Copilot requires pre-modeled DAX measures |
| Tableau | VizQL queries via Hyper engine or live query | Per-role (Viewer, Explorer, Creator) | Einstein Trust Layer, Agentforce |
| Looker | Warehouse query via LookML semantic layer | Annual contract, sales-led | Gemini grounded in LookML definitions |
| ThoughtSpot | Search engine on live connections | Per-user or usage-based | Spotter Semantics layer |
Architecture drives cost and trust. The interface decides how many people can actually use the tool, and governance determines whether the platform is safe to expand across the business. AI depth shapes what work the tool can take off the data team's plate, and the pricing model determines how many people in the company actually have access to the tool.
1. Sigma
Sigma is the runtime layer to build and scale analytics, apps, and agents on live cloud data warehouse data. It sits between your warehouse and the AI tools generating against that data, making the artifacts they produce governed, auditable, permissioned, and traceable.
Its key features include a spreadsheet interface that compiles to warehouse SQL, Input Tables for native writeback, Sigma Assistant for natural-language analysis and app-building, and Sigma Agents configured within a workbook context.
Pros
- Live queries on warehouse data mean formulas, filters, and pivot tables execute against current data rather than a stale snapshot.
- The spreadsheet interface removes the SQL bottleneck. Anyone who can write a SUM formula can analyze billion-row datasets.
- Writeback through Input Tables closes the loop from analysis to action without exporting to another platform.
- AI features inherit row-level security and column masking from the warehouse, so Sigma Assistant and Sigma Agents stay governed by the caller's existing permissions.
Cons
- Sigma runs on a cloud data warehouse and does not store data itself, so teams without a data warehouse need that foundation in place first.
- Sigma Agents are currently configured within a single workbook context and cannot chain across multiple agents.
- Sigma's visualization library is focused on the charts most teams actually use, so analysts who rely on highly specialized chart types may find the catalog narrower than they expect.
Pricing
Sigma offers four license tiers (View, Act, Analyze, Build). Pricing is not publicly listed and requires contacting sales. A 14-day free trial is available.
Who is Sigma best for?
Sigma fits enterprise data teams already running on a cloud data warehouse who want business users to self-serve, build AI Apps, and act on live data without breaking governance.
2. Microsoft Power BI
Microsoft Power BI is a business intelligence platform for the Microsoft ecosystem and a core workload inside Microsoft Fabric. Its key features include DirectQuery for live warehouse connections, the DAX formula language, and a Copilot suite that covers DAX generation, web modeling, and report authoring inside Fabric.
Pros
- Deep Microsoft integrations make adoption straightforward for organizations already running on Azure and Microsoft 365.
- A large user community and extensive learning resources shorten ramp time for new analysts and reduce reliance on vendor support.
- Copilot's DAX generation and report authoring skills automate common modeling tasks for teams already invested in the Fabric stack.
Cons
- DAX creates a skill dependency for teams without SQL or modeling experience.
- Performance can lag with large datasets, particularly with complex DAX formulas.
- Copilot requires capacity-based Microsoft Fabric licensing and struggles with unstructured and NoSQL data without heavy ETL work.
Pricing
Power BI Pro is $14 per user per month, and Premium Per User is $24 per user per month, both billed annually. Microsoft Fabric capacity pricing starts at a higher level and varies by SKU. Copilot is available only in the capacity-based Fabric tiers, not in the Free, Pro, or PPU tiers.
Who is Power BI best for?
Power BI fits organizations that are already deeply integrated with Microsoft tooling and have analysts comfortable with DAX and tolerant of the in-memory refresh model.
3. Tableau
Tableau is a business intelligence platform built on VizQL, a query language that translates drag-and-drop actions into queries against the Hyper engine or a live connection. Its key features include Tableau Pulse for AI-powered metric intelligence and the Einstein Trust Layer applied across AI features.
Pros
- Drag-and-drop authoring makes it possible for analysts to build interactive dashboards without SQL.
- A broad connector catalog spans cloud warehouses, SaaS applications, files, and databases, so most data sources are reachable without custom integration work.
- Tableau Pulse delivers metric monitoring, LLM-driven Q&A, and pace-to-goal tracking on top of curated metrics.
Cons
- Some users note that licensing costs add up quickly as more users need access, and role-based pricing can inflate seat counts when work does not align with role lines.
- Some users report that while simple calculations are straightforward, complex table calculations are difficult to express.
- Users report slow performance and scaling issues under heavy database load.
Pricing
Tableau Standard is $15 per Viewer, $42 per Explorer, and $75 per Creator per month, billed annually. Tableau Enterprise is $35, $70, and $115, respectively. Every deployment requires at least one Creator license.
Who is Tableau best for?
Tableau fits teams that prioritize visualization depth and exploratory dashboard design, particularly organizations running on Salesforce.
4. Looker
Looker is Google Cloud's enterprise business intelligence platform built around LookML, a code-based semantic layer. Its key features include the LookML modeling language, Git-based version control over metric definitions, and a managed MCP server for agentic integration.
Pros
- Native integration with BigQuery and other Google Cloud services fits teams standardized on GCP.
- LookML enables Git version control and pull requests over metric definitions.
- The semantic layer enforces consistent metric definitions across large organizations and grounds AI queries.
Cons
- LookML creates a steep learning curve for non-developers and can bottleneck data requests with the engineering team.
- Some users report that self-service capabilities are limited such that customizing complex dashboards sometimes requires developer support.
- Looker depends on Google Cloud, which can complicate multi-cloud or non-GCP warehouse deployments.
Pricing
Looker pricing is not publicly listed and requires contacting sales. Annual commitment terms apply. The editions are Standard, Enterprise, and Embed, each including 10 Standard users and two Developer users, with monthly API call ceilings of 1,000, 100,000, and 500,000, respectively.
Who is Looker best for?
Looker fits engineering-led data teams on Google Cloud who treat metric definitions as version-controlled code and have the capacity to maintain LookML.
5. ThoughtSpot
ThoughtSpot is a business intelligence platform built around natural language search that lets users query and analyze enterprise data by typing questions in plain language. Its key features include search-driven queries, Analyst Studio for SQL, Python, R, and visual analysis, and an Agentic MCP Server available to all customers.
Pros
- Strong NLP and search capabilities power the natural language query experience.
- The search interface lets non-technical users ask their own questions and get answers in seconds.
- Scalable architecture supports enterprise workloads across live connections to Snowflake, Databricks, and Redshift.
Cons
- Some users report gaps in custom PDF reports and print-ready report formats.
- There are concerns that customization is limited compared to traditional BI tools, especially for highly customized, presentation-ready reports.
- Some users note that content management is difficult and that finding the right dashboards is hard.
Pricing
ThoughtSpot pricing is not publicly listed and requires contacting sales.
Who is ThoughtSpot best for?
ThoughtSpot fits organizations that want search-driven self-service for non-technical users, where typing a question matters more than building a curated dashboard.
How to choose the right big data analytics tool
The right choice depends on where your data sits today, who needs to work with it, and how much of the workflow you want the platform to carry beyond the chart.
1. Start with architecture
When your data already lives in a cloud data warehouse, a warehouse-native platform keeps queries on live data and avoids the duplicate security models that extracts create.
2. Match the interface to your users
A code-based semantic layer rewards organizations that treat metric definitions as version-controlled code. A search or spreadsheet interface serves non-technical users who need answers without having to build dashboards. Teams running most of their stack on Microsoft tooling should weigh that integration against the DAX learning curve.
3. Test how each platform grounds its AI
Answers built on governed semantic definitions stay trustworthy, while answers run against ungoverned copies drift out of date. Ask each vendor to show how its AI features inherit row-level security, apply column masking, and respect metric definitions at query time.
4. Check for writeback and action
A dashboard ends at the chart. Real workflows need the platform to take input, run logic, and write results back to the warehouse. Confirm whether the platform handles writeback natively or routes that work to a separate app-builder.
5. Model pricing against real access needs
Model pricing against how many people actually need access, and check whether the model scales with value or caps usage. Per-user, consumption-based, and capacity-based structures each reward different team shapes.
Our verdict: Sigma is the best big data analytics tool
Across architecture, governance, self-service, and the path from analysis to action, Sigma is the strongest fit for enterprise data teams choosing a platform in 2026. Sigma runs every query live on the cloud data warehouse, lets business users build on billions of rows through a spreadsheet interface without SQL, and closes the loop from question to action inside the same governed environment.
Three capabilities set Sigma apart from the rest of the field:
- A runtime layer between your warehouse and your AI. Sigma turns what AI generates against your data into production-ready software. Every workbook, AI App, and agent runs against the warehouse with row-level security and column masking applied at query time.
- Spreadsheet familiarity at warehouse scale. Formulas, filters, pivot tables, and sorting compile into SQL and run inside the warehouse, so the person who builds a model in Excel can build it in Sigma on billions of rows of live data. Input Tables handle writeback, and Report Builder produces audit-ready paginated reports.
- Governed AI Apps and agents on warehouse data. Sigma Assistant lets users analyze data and build apps in plain language. Sigma Agents extend that into configured workflows where a builder defines what the agent can see, how it should behave, and which actions it can run.
Together, these capabilities put Sigma on a different footing from other big data analytics platforms. The other four tools each solve part of the problem: Power BI at the Microsoft-integrated seat price, Tableau at visualization depth, Looker at code-governed semantics, ThoughtSpot at search-first self-service.
Sigma delivers it all on one platform: the architecture, the interface, the AI, and the action layer. They all point to the same outcome. Business users work with live warehouse data in a familiar spreadsheet, IT maintains the guardrails, and AI Apps and agents run on the same governed foundation as everything else.
If your team is already on a cloud data warehouse and evaluating where to invest for the next few years, Sigma is the platform to beat.
Get a demo or try Sigma free and see it on your own data.