Automated Data Insights: What They Are and How They Work

Most dashboards sit unused, waiting for someone to open them. Important signals slip past the people who could act on them because nobody happened to check the right tab on the right day. Automated data insights fix that by inverting the model: the system surfaces the finding and delivers it to the owner, with enough context to act. This guide covers what automated data insights are, why they matter now, how they differ from the reporting you already run, and what it takes to generate them well.
Key takeaways
- Automated data insights only work if the three layers of data, detection, and delivery are connected. Live warehouse data feeds detection logic tuned for precision, and findings route to the owner in the channel where they already work.
- Precision decides whether an automated data insights program survives. High alert volume erodes trust fast, and once users tune out the noise, they miss the real signals too.
- When implementing automated data insights, tune for precision first, tier by severity, and attach a clear next step to every alert so each one leads to a decision rather than another notification to ignore.
What are automated data insights?
Automated data insights are recurring signals, anomalies, trends, or explanations that a system surfaces directly from live data, without a person first writing a query, building a chart, or manually interpreting the result. They range from a simple threshold alert ("revenue dropped below $X") to a fully reasoned explanation from an AI agent, as long as the system does the initial work of finding and framing it.
The strongest automated data insights programs share three traits. Any of them can appear in weaker forms in less mature setups:
- Continuous detection. The configured logic determines what counts as notable and then applies it continuously rather than waiting for a person to initiate each analysis.
- Live or recently refreshed data. The finding reflects the current state of the business rather than last week's snapshot.
- Push-based delivery. The insight arrives as a notification via email, Slack, or an application, rather than sitting in a tool waiting for someone to open it.
Together, these traits shift analytics from something users have to remember to check into something the system delivers on its own.
Common forms of automated data insights
Automated data insights take several forms, each answering a different question about the data:
- Threshold alerts fire when a metric crosses a fixed boundary, such as daily row counts dropping to zero.
- Anomaly detection learns normal behavior from history and flags deviations, including patterns nobody set a threshold for.
- Trend detection monitors directional change over time rather than a single point-in-time spike.
- Root-cause and driver analysis explains why a metric moved, such as "Northeast sales declined primarily due to a 30% drop in Q3 promotional spend combined with a 15% increase in competitor pricing."
- Natural language summaries translate analytical output into a readable narrative, so the findings arrive in business terms.
- AI agent explanations combine detection, investigation, and recommendation into a single response, and a person can question the reasoning in follow-up.
A mature automated data insights program usually runs several of these forms at once, matched to the metrics that matter most.
4 reasons automated data insights matter now
Automated data insights matter now because data volumes and business questions keep growing, while human review capacity doesn't.
1. Data volume has outgrown manual review
A large share of enterprise data remains unused, and volumes continue to climb. Most analyst teams cannot review that surface area by hand. Detection logic that runs continuously against the warehouse scales with the data instead of competing with it for attention.
2. Business users expect insights to find them
Many business users now prefer proactive insight delivery over static pages they must monitor manually. The expectation set by consumer and workplace software, where the important event finds you, now applies to data.
3. Insights arrive while there's still time to act
Speed compounds into financial results. The value of an insight decays with the decision window it fits inside. A pricing anomaly caught early on can trigger a change to the promotion or the discount schedule. The same anomaly, if it surfaces three weeks later, is documentation of what already went wrong. Automated detection compresses the gap between when a condition appears in the data and when the person who can act on it sees it, which is the difference between changing an outcome and explaining it.
4. Coverage extends to questions nobody thought to ask
Threshold alerts catch the failures you anticipated. ML-based detection catches the ones you didn't, because it learns what normal looks like and flags anything that deviates, including problem types the team has never encountered. Manually built charts can't cover those unknown unknowns because they encode questions someone already asked.
Automated data insights vs. dashboards, scheduled reports, and analyst requests
Each common insight channel carries a dependency that automated insights remove: someone remembering to look, a schedule that ignores what actually happened, or a queue waiting on analyst capacity. The table below compares the four at a glance.
| Channel | Trigger | Timing | Best for |
|---|---|---|---|
| Dashboards | User opens the page | Whenever someone checks | Exploratory review and standing KPIs |
| Scheduled reports | Calendar (e.g., Monday 9 a.m.) | Fixed cadence, regardless of what happened | Recurring recaps for known audiences |
| Analyst requests | Ticket filed with the data team | Depends on team capacity | Novel, one-off questions |
| Automated data insights | A condition in the data is met | Immediately, when it matters | Ongoing monitoring and time-sensitive action |
Dashboards
Dashboards provide insights passively. They answer the questions someone thought to ask when building a chart and provide those insights only when someone opens them. Important signals go unnoticed for days because the person who would recognize the anomaly was looking at a different page. Automated data insights reverse the dependency, so the finding travels to the user.
Scheduled reports
A scheduled report goes out every Monday at 9 a.m. regardless of what happened in the data over the weekend. It answers a question that was true when the report ran, and it delivers the same volume of information whether anything notable occurred or not. Condition-based insights invert that logic: nothing arrives until something worth knowing has happened, and when it does, it arrives immediately.
Analyst requests
Filing a ticket with the data team still works, but recurring data requests depend on team capacity. In a typical work week, analysts can spend 10 to 11 hours collecting and preparing data before analysis begins. By the time the answer lands, the follow-up question has formed, and the queue starts again. Automated insights handle recurring questions, so analyst time is freed up for novel questions.
3 prerequisites for generating automated data insights
Three layers must exist before an automated insight can reach anyone. Each answers a different question: where the data come from, what counts as notable, and how the finding reaches the person who can act.
1. The data layer
Detection logic is only as current as the data it reads. Extract-based tools introduce a lag between the warehouse update and the next import cycle, which can leave alerts firing on an older state of the business. A direct connection to the cloud data warehouse, whether Databricks, Snowflake, BigQuery, or Amazon Redshift, keeps detection running against live data and consolidates compute into one place.
2. The detection layer
Detection ranges from rule-based thresholds, which are deterministic and auditable, to statistical baselines, to ML models that adapt to seasonality and drift. Rules are auditable but narrow. ML expands coverage, but teams need additional explanation to trust the results. Most enterprise systems combine methods to balance reliability, coverage, and trust. Warehouse-centered stacks now place detection closer to the platform where data lives, so teams can run rules, statistical checks, and ML-assisted monitors without moving data through a separate extract cycle.
3. The delivery layer
A finding that lands in a channel nobody reads may as well not exist. Delivery means routing by ownership, choosing the channel where the owner works, and attaching enough context to act on. Alerts are only useful when they appear where the owner will actually respond.
How to generate automated data insights in your organization
Generating insights follows a repeatable sequence. Each step compounds on the last, and skipping any of them tends to produce a program that either misses real events or trains users to ignore alerts.
- Connect to a live data source. Start with the most critical pipelines and metrics rather than attempting full coverage on day one. Programs that try to instrument the entire data estate simultaneously tend to stall before delivering value.
- Define what counts as notable. Establish a baseline for each metric using enough history to capture its normal rhythm and seasonality. Alert on symptoms rather than causes, and require sustained conditions rather than single-point spikes.
- Configure delivery and routing. Route each alert to the specific owner who can act. Tag detection rules by domain (finance, growth, operations) and map each tag to the channel where that team already works.
- Test before it reaches an inbox. Backtest detection logic against historical data before anyone gets a notification. Replay past periods and count how many real incidents the logic would have caught against how many false alarms it would have raised, then tighten sensitivity if precision is too low.
- Monitor and refine over time. Audit which alerts drove action and which were ignored; retire rules that never produce true positives; and let users flag false positives so thresholds adjust.
This loop turns detection from a one-time build into a system that gets sharper the longer it runs.
How Sigma delivers automated data insights
Sigma is the runtime layer to build and scale analytics, apps, and agents on live warehouse data. Sigma runs automated data insights end to end in one place, so teams can reduce handoffs across separate monitoring, alerting, and analytics tools by running them on live warehouse data under a single permissions model.
A live connection built on the warehouse
Sigma is warehouse-native. Queries compile to SQL and execute inside Databricks, Snowflake, BigQuery, or Amazon Redshift, so detection reads live warehouse data and queries inherit row-level security at query time. Legacy business intelligence (BI) workflows rely on extracts into separate engines and work from stale copies, which introduces a lag between what the pipeline wrote and what the alert fires against.
Detection logic your team can configure
Conditions defined in workbooks trigger downstream workflows, such as an out-of-stock alert when inventory drops below a defined threshold. Because the logic lives in the workbook alongside the underlying model, the same people who understand the metric can adjust the rule, tier its severity, or add a second condition without a handoff to a separate monitoring tool.
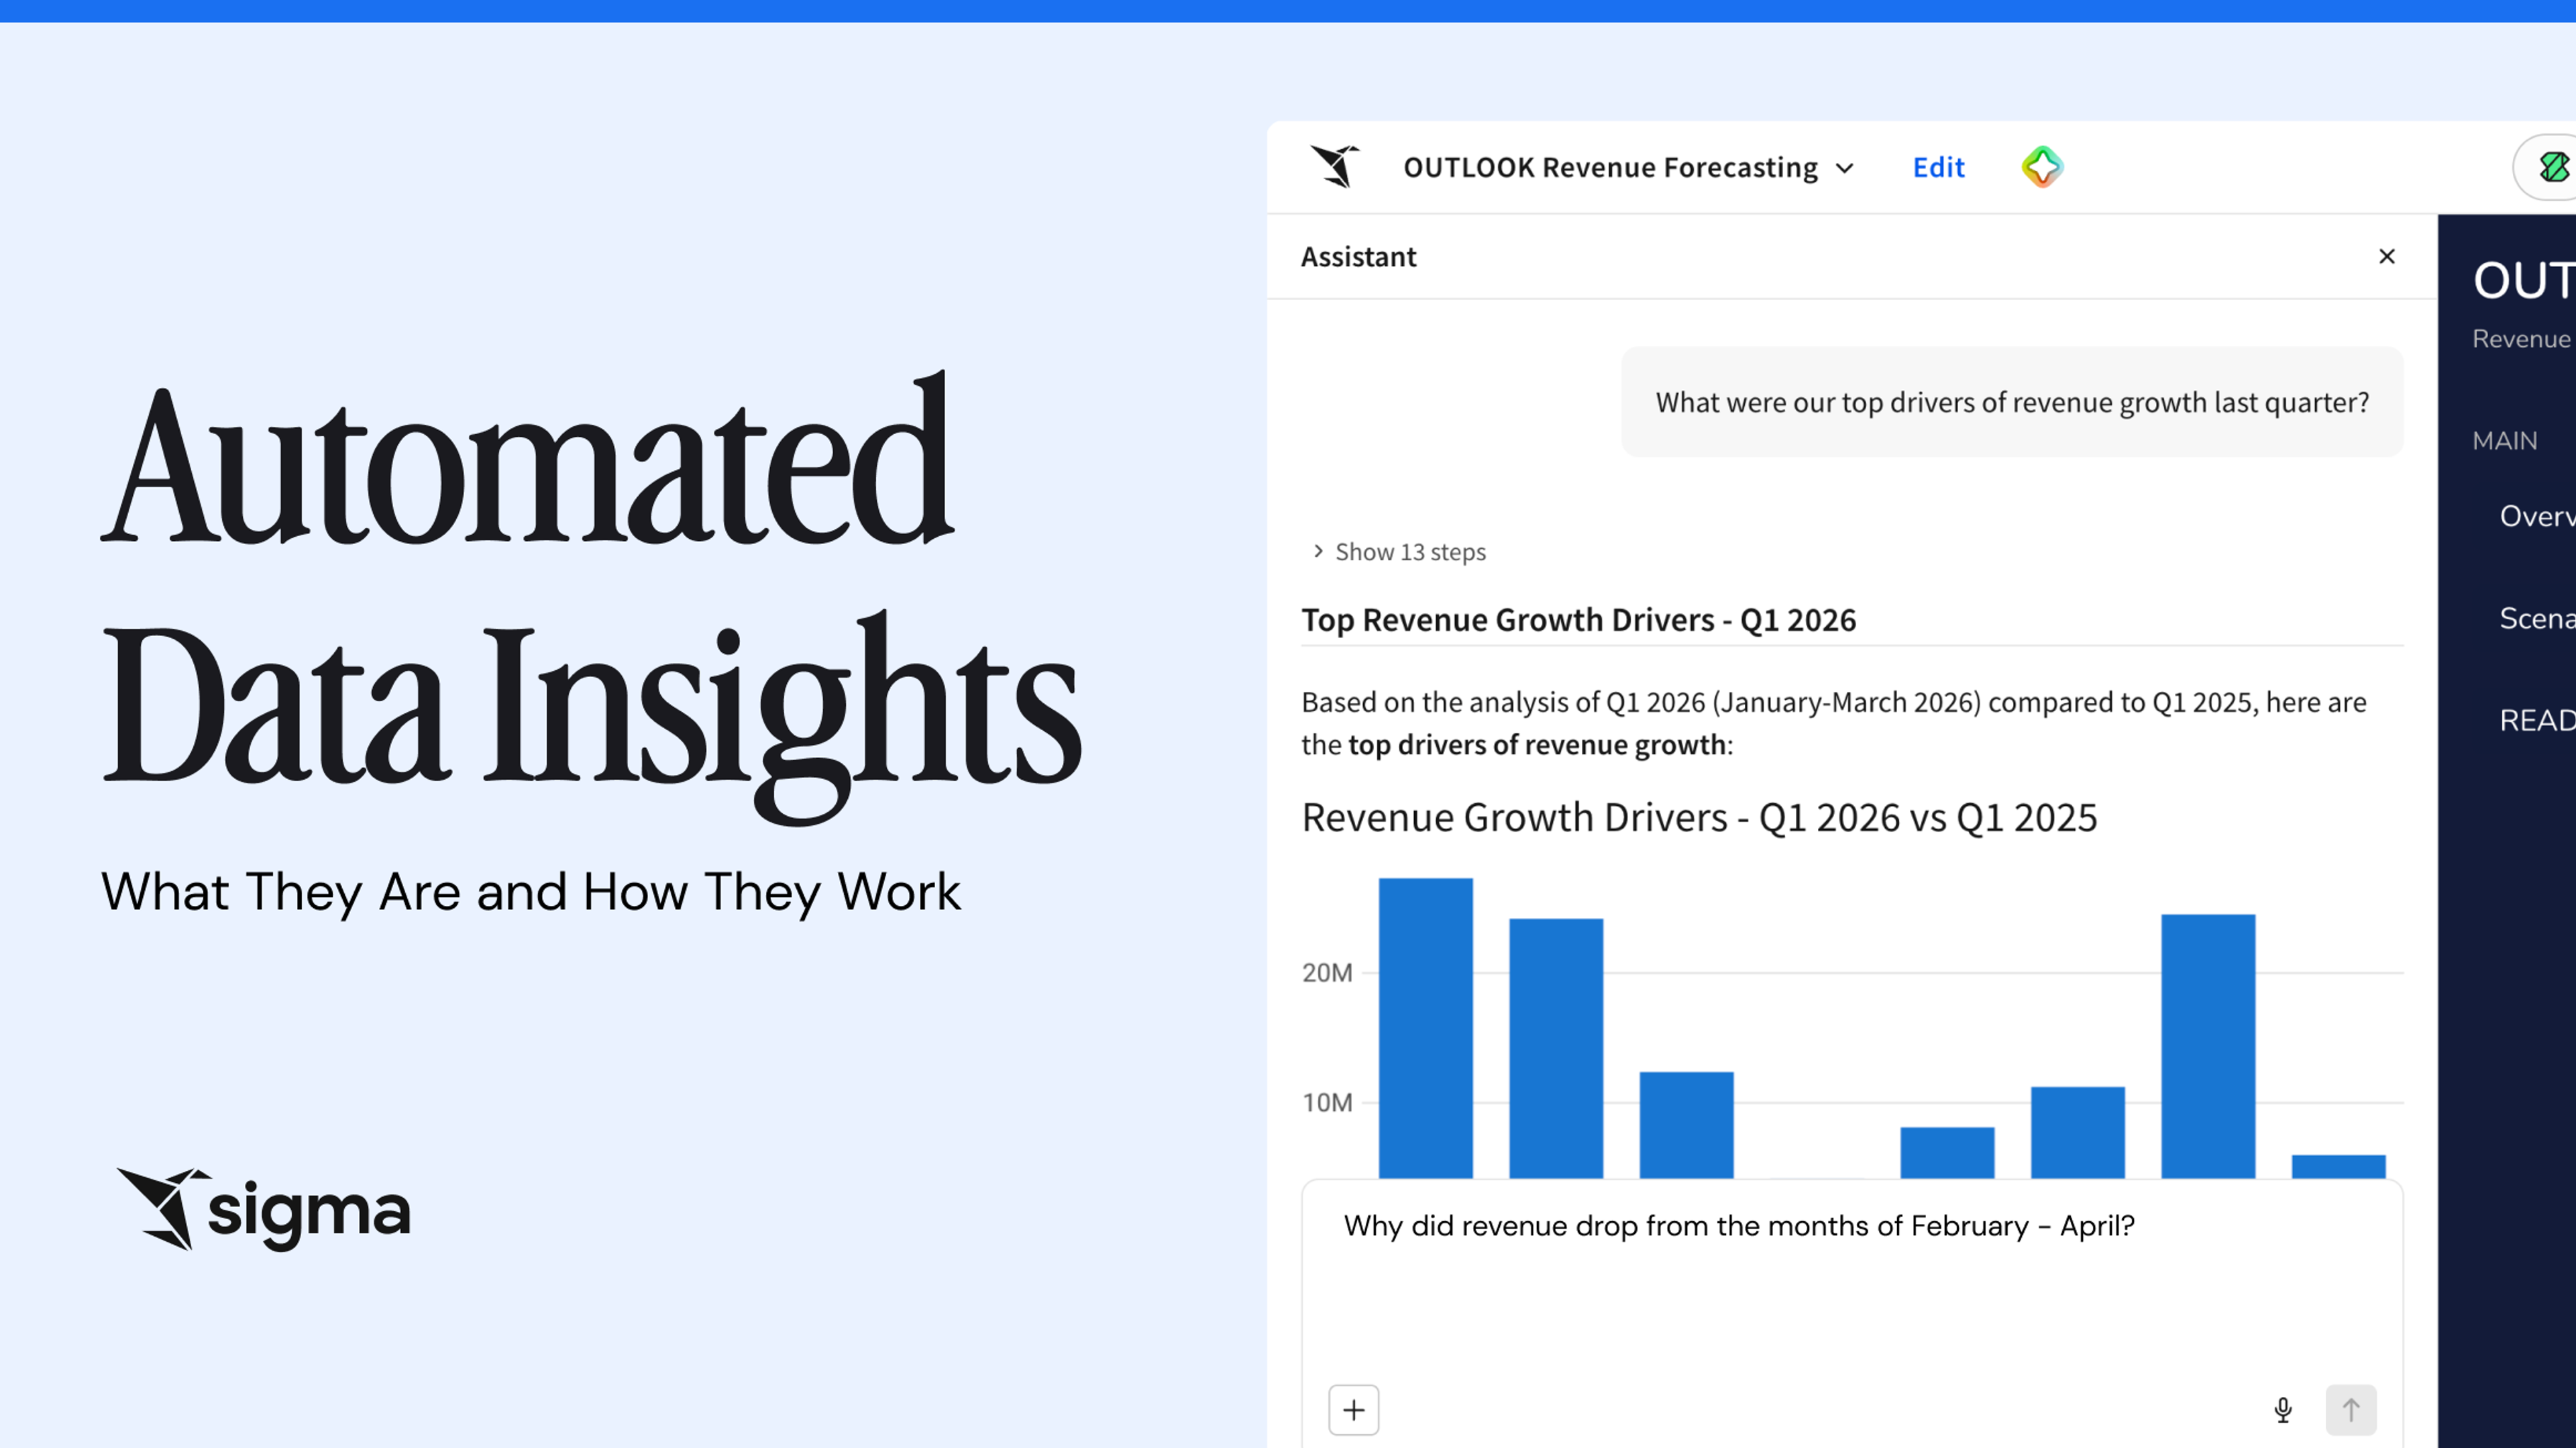
When a flagged metric needs explanation, Analyze with Sigma Assistant can summarize what the data shows and explain why the metric changed in plain language, with query-backed analysis traceable to the underlying table.
Delivery built into where you already work
Sigma Actions can chain notifications via email and Slack and route approvals or writebacks off the same trigger, so a flagged variance moves straight into the workflow instead of dead-ending in an inbox. The notification can include the record, the owner, and the recommended next step for the person who can act on it. A follow-up write to the warehouse or a downstream system stays scoped to what that user is allowed to change. A detected condition becomes a decision inside the channel the owner already uses, rather than another notification competing for attention.
Sigma Agents for instructed autonomy
Sigma Agents are configured within a workbook context, after a builder defines the goal, instructions, and actions the agent is allowed to take. That scoping keeps investigation and follow-up under the same governance and permissions as the rest of the workbook, so agents can review defined slices of live warehouse data and surface findings without asking people to interpret a static dashboard on their own.
Start generating automated data insights with Sigma
You can keep assembling the data, detection, and delivery layers from separate tools, or run them on a platform where they're already connected to your live warehouse data. Sigma carries the work from detection through explanation to action inside one governed environment, so an insight reaches its owner while the decision window is still open, with the lineage, permissions, and audit trail your IT team already trusts.
Try Sigma free or get a demo to see automated data insights running on your own warehouse.