What is AI-Powered Analytics? How It Works and Why It Matters
For decades, doing analytics meant manual support from a data analyst, writing SQL, building reports, and wrangling dashboards. AI-powered analytics flips that around. Agents write the queries, surface the patterns, and run the analysis.
AI-powered analytics is changing who inside a company can actually query or use data. When answers reside with a handful of specialists, most questions go unasked, and decisions fall back on gut feel or last quarter’s report. AI-powered analytics widens the door, so the person closest to the problem can ask in plain language instead of waiting in a queue.
This guide covers what AI-powered analytics is, how it works, and why it matters for teams trying to move faster.
Key takeaways
- AI-powered analytics differs from traditional analytics in four ways: who does the work, how people ask questions, what the system surfaces pro-actively, and what happens after the answer arrives.
- Each interaction loops through three stages, one or more times: intelligence (interpret the question, context, and semantic layers, generate SQL queries), querying (execute the query against live, governed warehouse data), and action (synthesize insights, action on custom workflows or writeback to the warehouse).
- The architecture only works on live, governed warehouse data. Stale extracts compromise both accuracy and governance.
What is AI-powered analytics?
AI-powered analytics is the use of artificial intelligence, including machine learning, natural language processing, and LLM-powered agents, to automate and speed up data analysis. Instead of manually writing queries and building reports, users ask questions in plain language, and the system generates answers, surfaces patterns, and produces insights from live data.
Common capabilities include conversational querying, automated insight detection, forecasting, and autonomous, multi-step analysis. Together, they move business intelligence from reactive reporting to proactive decision-making.
The term “AI-powered analytics” is used loosely to refer to several adjacent categories in vendor pitches, analyst reports, and procurement conversations: augmented, embedded, and conversational, agentic analytics.
- Augmented analytics applies machine learning inside a BI tool to assist the analyst by automating data preparation, detecting anomalies, and suggesting insights the analyst might otherwise miss. Humans remain the decision-makers, and AI speeds up and extends their work.

- Embedded analytics delivers charts, metrics, and AI-generated insights directly within the applications people already use, such as a CRM, an ops console, or a customer portal, so users never have to switch to a separate BI tool to act on data.

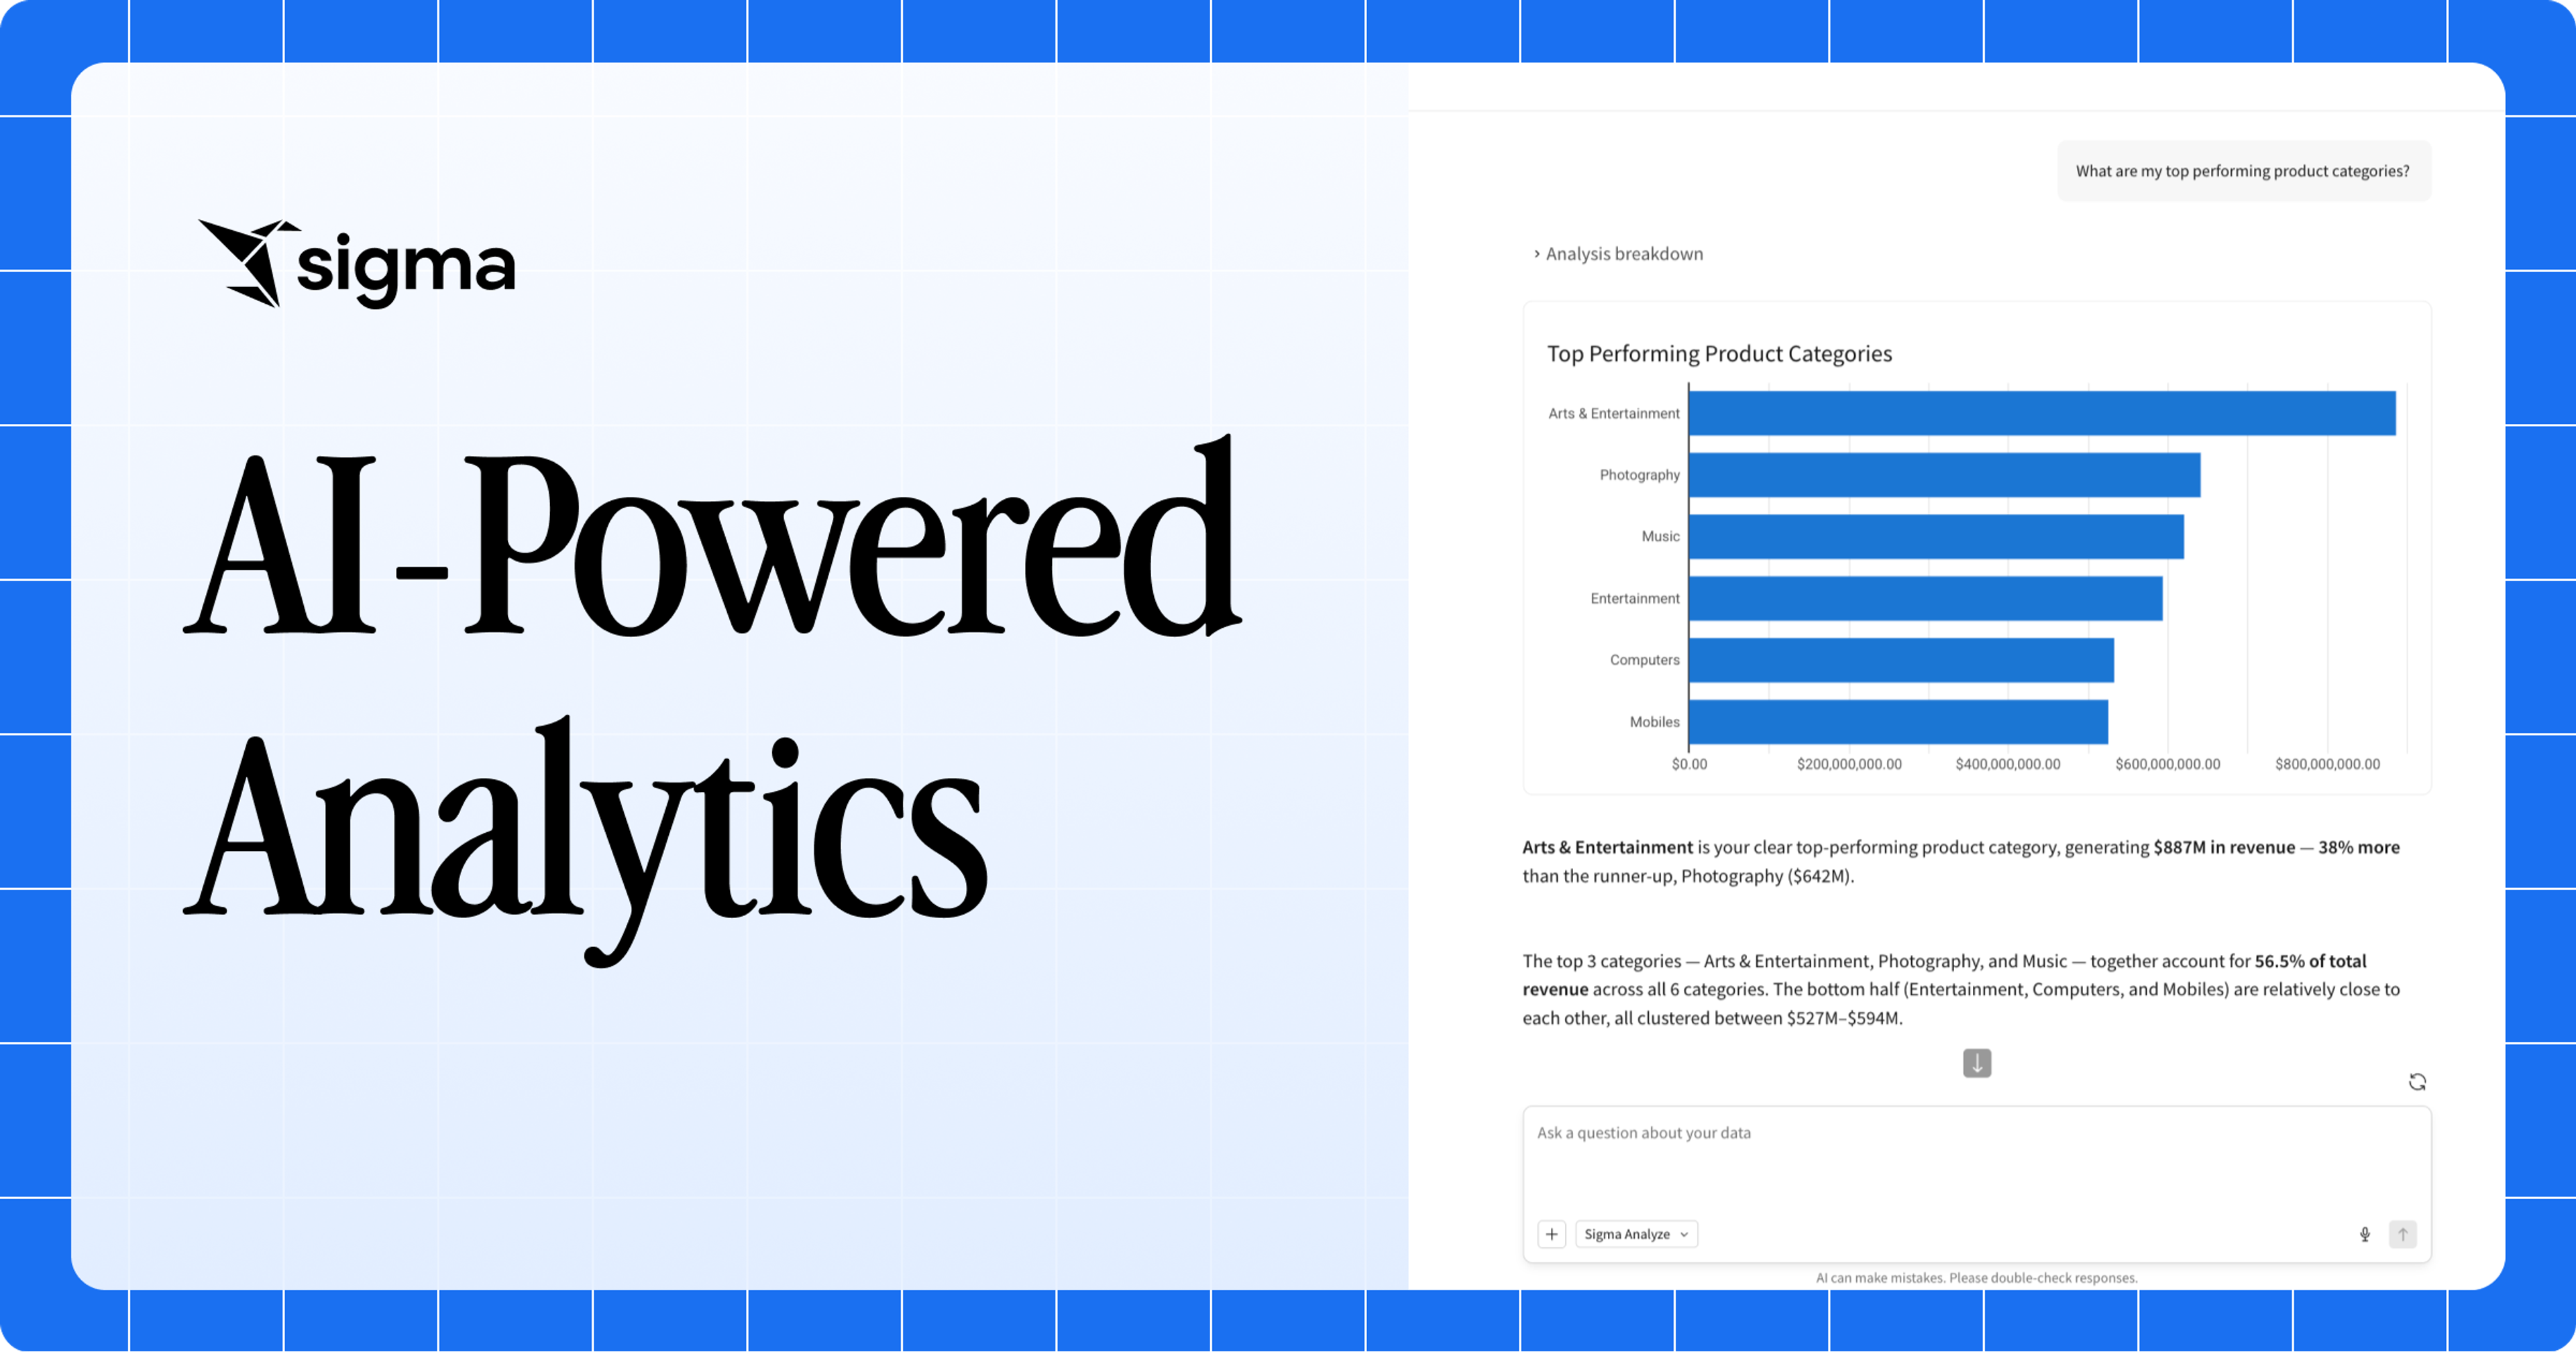
- Conversational, agentic analytics combines a natural-language interface with AI agents that can autonomously plan and execute multi-step analytical workflows. A business user types or speaks a question like “why did revenue dip last quarter?” and an agent pulls the data, runs the analysis, interprets the results, and can trigger actions in downstream systems, returning a direct answer, chart, or explanation.
Enterprise analytics platforms now treat all these AI capabilities as a baseline expectation, and each category puts AI to work on a different part of the analytics job.
AI-powered analytics vs. traditional analytics
Traditional analytics waits for a person to ask the right question and build the right report. AI-powered analytics surfaces answers, patterns, and actions on its own. The contrast plays out across four dimensions:
| Dimension | Traditional analytics | AI-powered analytics |
|---|---|---|
| Who does the work? | Analyst-driven. A human sits between the business and the data, cleaning, modeling, building the report, and interpreting the result. | Agent-driven. Agents handle routine analysis, freeing analysts to focus on data modeling, governance, and strategy. |
| How do people ask questions? | Through prebuilt reports and dashboards. If a question fits an existing dashboard, the answer is fast; if it doesn’t, the user files a request and waits. | In plain language, on the fly. Business users ask a question and get back an answer, chart, or explanation drawn directly from live data. |
| What does the system surface? | Only what someone queried. If no one builds a churn report, no one sees churn. | Patterns no one asked about. Models continuously monitor data, flag anomalies, and surface the drivers behind shifts in metrics. |
| What happens after the answer? | A handoff. A churn report runs weekly; an analyst flags a risk; a CRM manager builds a campaign by hand; and the campaign launches days later. Every handoff adds latency and interpretation loss. | A trigger. A finding can fire a notification, transaction workflow, write a forecast back to a planning model, or route an approval, all without data leaving the warehouse. |
The cost of the traditional model shows up in two well-cited numbers: analysts can spend up to 12 hours per week on data preparation rather than analysis, and organizations actively use less than half of their structured data when making decisions.
How AI-powered analytics works
AI-powered analytics routes a user’s request through three layers one or more times: intelligence, querying, and action. The whole flow has to run against live warehouse data, because models fed stale extracts return stale conclusions.
Stage 1: The intelligence layer interprets the request and generates a query
First, the agent has to figure out what the user is actually asking and turn it into queries that the warehouse can execute.
The most common sub agent is text-to-SQL: the system translates a natural-language question into SQL, using a semantic layer that guides the LLM to select the correct tables, joins, and filters.
For this to work well, the agent needs your business context defined. LLMs operating without that governed semantic context produce inconsistent outputs: different SQL for the same question, and different numbers from one run to the next. Accuracy problems in natural language analytics often trace back to weak semantic and governance foundations beneath the model.
The intelligence layer is only as trustworthy as the data quality and governance underneath it: business-friendly names, metric definitions, certification signals that mark which definitions are trusted, and access controls that keep restricted data restricted.
Stage 2: The querying layer executes the query against live, governed warehouse data
Once the SQL exists, it runs against the data layer: the warehouse itself, plus the governance and metric definitions wrapped around it.
Live access is what makes this work. Stale extracts introduce compounding failure modes: incorrect model outputs, governance breakdowns when access controls don’t travel with the extracted data, and severed single-source-of-truth guarantees. When queries run against the governed layer on live warehouse data, the warehouse automatically enforces row-level security and column masking, and existing permissions carry over. Extract the data, and those controls vanish.
Stage 3: The action layer turns the result into a decision or a downstream action
The query returns a result, and the action layer decides what happens with it. The action layer is where AI-powered analytics moves beyond reporting: findings can trigger decisions rather than just sit in a chart. A customer retention workflow fires when churn risk crosses a threshold. A forecast adjustment writes back to the planning model, and an approval workflow routes to the right person.
For agentic and writeback flows, the system also needs to record the action in the environment that informed the decision, to preserve auditability and support feedback loops over time. That closes the loop: the next request enters the same stack with a record of what the last one did.
5 benefits of AI-powered analytics
AI-powered analytics changes the day-to-day shape of analytics work in five concrete ways:
- Faster decisions. Continuous detection and analysis reduce the delay between a change in the data and someone acting on it. AI agents are on track to augment or automate 50% of business decisions by 2027.
- Non-technical users can query data directly. Plain-language interfaces remove the SQL prerequisite, so a marketing manager or ops lead can get an answer from the warehouse without having to file a ticket.
- Problems get flagged before anyone asks. In agentic systems, models monitor metrics continuously and surface anomalies and their drivers, work that’s hard for a human analyst to do at scale across every metric, every day.
- Analysts spend more time on strategic work. The system handles routine questions like “what were sales by region last month”, freeing analyst time for modeling, governance, and turning findings into strategy.
- Insights lead directly to action in the same system. Detection, decision, and writeback occur within a single governed environment, skipping the tool-to-tool handoffs that cause time and context loss.
Taken together, these shifts turn analytical capability into measurable business outcomes rather than underused reports.
How Sigma delivers AI-powered analytics
Sigma is the runtime layer for building and scaling analytics, apps, and agents on live cloud data warehouse data, the kind of architecture this article has been describing. It sits between the warehouse (Snowflake, Databricks, BigQuery, Redshift) and AI, so that workbooks, dashboards, AI Apps, and agents operate inside the same governance perimeter the warehouse already enforces, without extracting data, duplicating governance, or requiring SQL expertise from every user.
Sigma Assistant and Sigma Agents enable conversational analytics wherever you’re working with data
Sigma Assistant lets users ask plain-language questions about warehouse data and inspect the query behind the answer, so the intelligence layer stays transparent and auditable. Sigma Assistant also supports building applications and dashboards from a natural-language prompt, collapsing the gap between asking a question and shipping a working application.
Sigma Agents enable agentic workflows on top of conversational analytics, with builder-defined instructions, data access, and actions, so an agent can plan and execute multi-step analysis without leaving the governed environment.
These offerings can integrate warehouse agents built by technical teams, and make them available to business users.
Live queries run AI-powered analytics directly on warehouse data
Every formula, filter, pivot, and sort compiles to SQL and executes inside the connected cloud data warehouse, where the data lives. There is no data extraction. Teams can configure AI features to run on any AI provider including the customer’s warehouse (for example, via Snowflake Cortex or Databricks model serving).
Governance is inherited from the permissions your warehouse already enforces
Row-level security, column masking, and access policies enforced in the warehouse carry through to Sigma at query time, rather than requiring a separate permissions model. When AI features run on the customer’s warehouse compute, the same row-level security and lineage apply to their outputs as any other query. For agents, that means an agent inherits the permissions of the user who invokes it and cannot return data that the caller doesn’t have access to.
Writeback turns insight into an action in the warehouse
Input Tables let users INSERT, UPDATE, and DELETE records in the warehouse from a workbook. Sigma captures every change in an audit trail covering the original record, the new record, who changed it, and when. Combined with sequenced actions in a workbook, API calls, and notification workflows, this makes the action layer part of the same governed workflow. Teams can build workflows such as retention follow-up, forecast edits via writeback, or approval routing without leaving the workbook.
A familiar spreadsheet lets anyone build an analysis without writing code
Sigma’s interface borrows heavily from spreadsheet patterns most teams already know, including pivot tables, formulas, and cell-style references. It compiles those interactions into SQL that runs against live warehouse data at scale. That means a business user can build real analysis using the muscle memory they already have, while the underlying queries run with the same governance and performance as any other warehouse workload.
Experience AI-powered analytics with Sigma
The fastest way to see what AI-powered analytics actually feels like is to run it on data you already know. With Sigma, that means connecting your cloud data warehouse (Snowflake, Databricks, BigQuery, or Redshift) and watching the three layers from this article come together against your own numbers.
From there, you can ask Sigma Assistant a plain-language question and inspect the SQL it generated before trusting the answer. You can open a workbook and build with the same spreadsheet patterns your team already uses, with queries compiling to SQL and running live on the warehouse.
And when an analysis is followed by action, Input Tables and Sigma Agents let you write back to the warehouse and take configured actions or notifications inside the same governed environment.
Get a demo to see Sigma at work, or try Sigma free and connect a warehouse yourself.