What Is Financial Analytics? Types and How It Works

It's the last week of the month. The finance team exports actuals from the ERP into a spreadsheet, manually builds the variance report, reconciles three versions floating around in email, and sends the final deck to leadership. By the time anyone reads it, the numbers are a week old.
That month-end scramble shows up when the finance function is organized around reporting what happened. It leaves little room for the analysis that shapes what happens next: where margin is leaking, when cash will tighten, and which scenario protects the plan. Financial analytics is how you break that cycle, turning the same data behind the close into a forward-looking view of the business.
Key takeaways
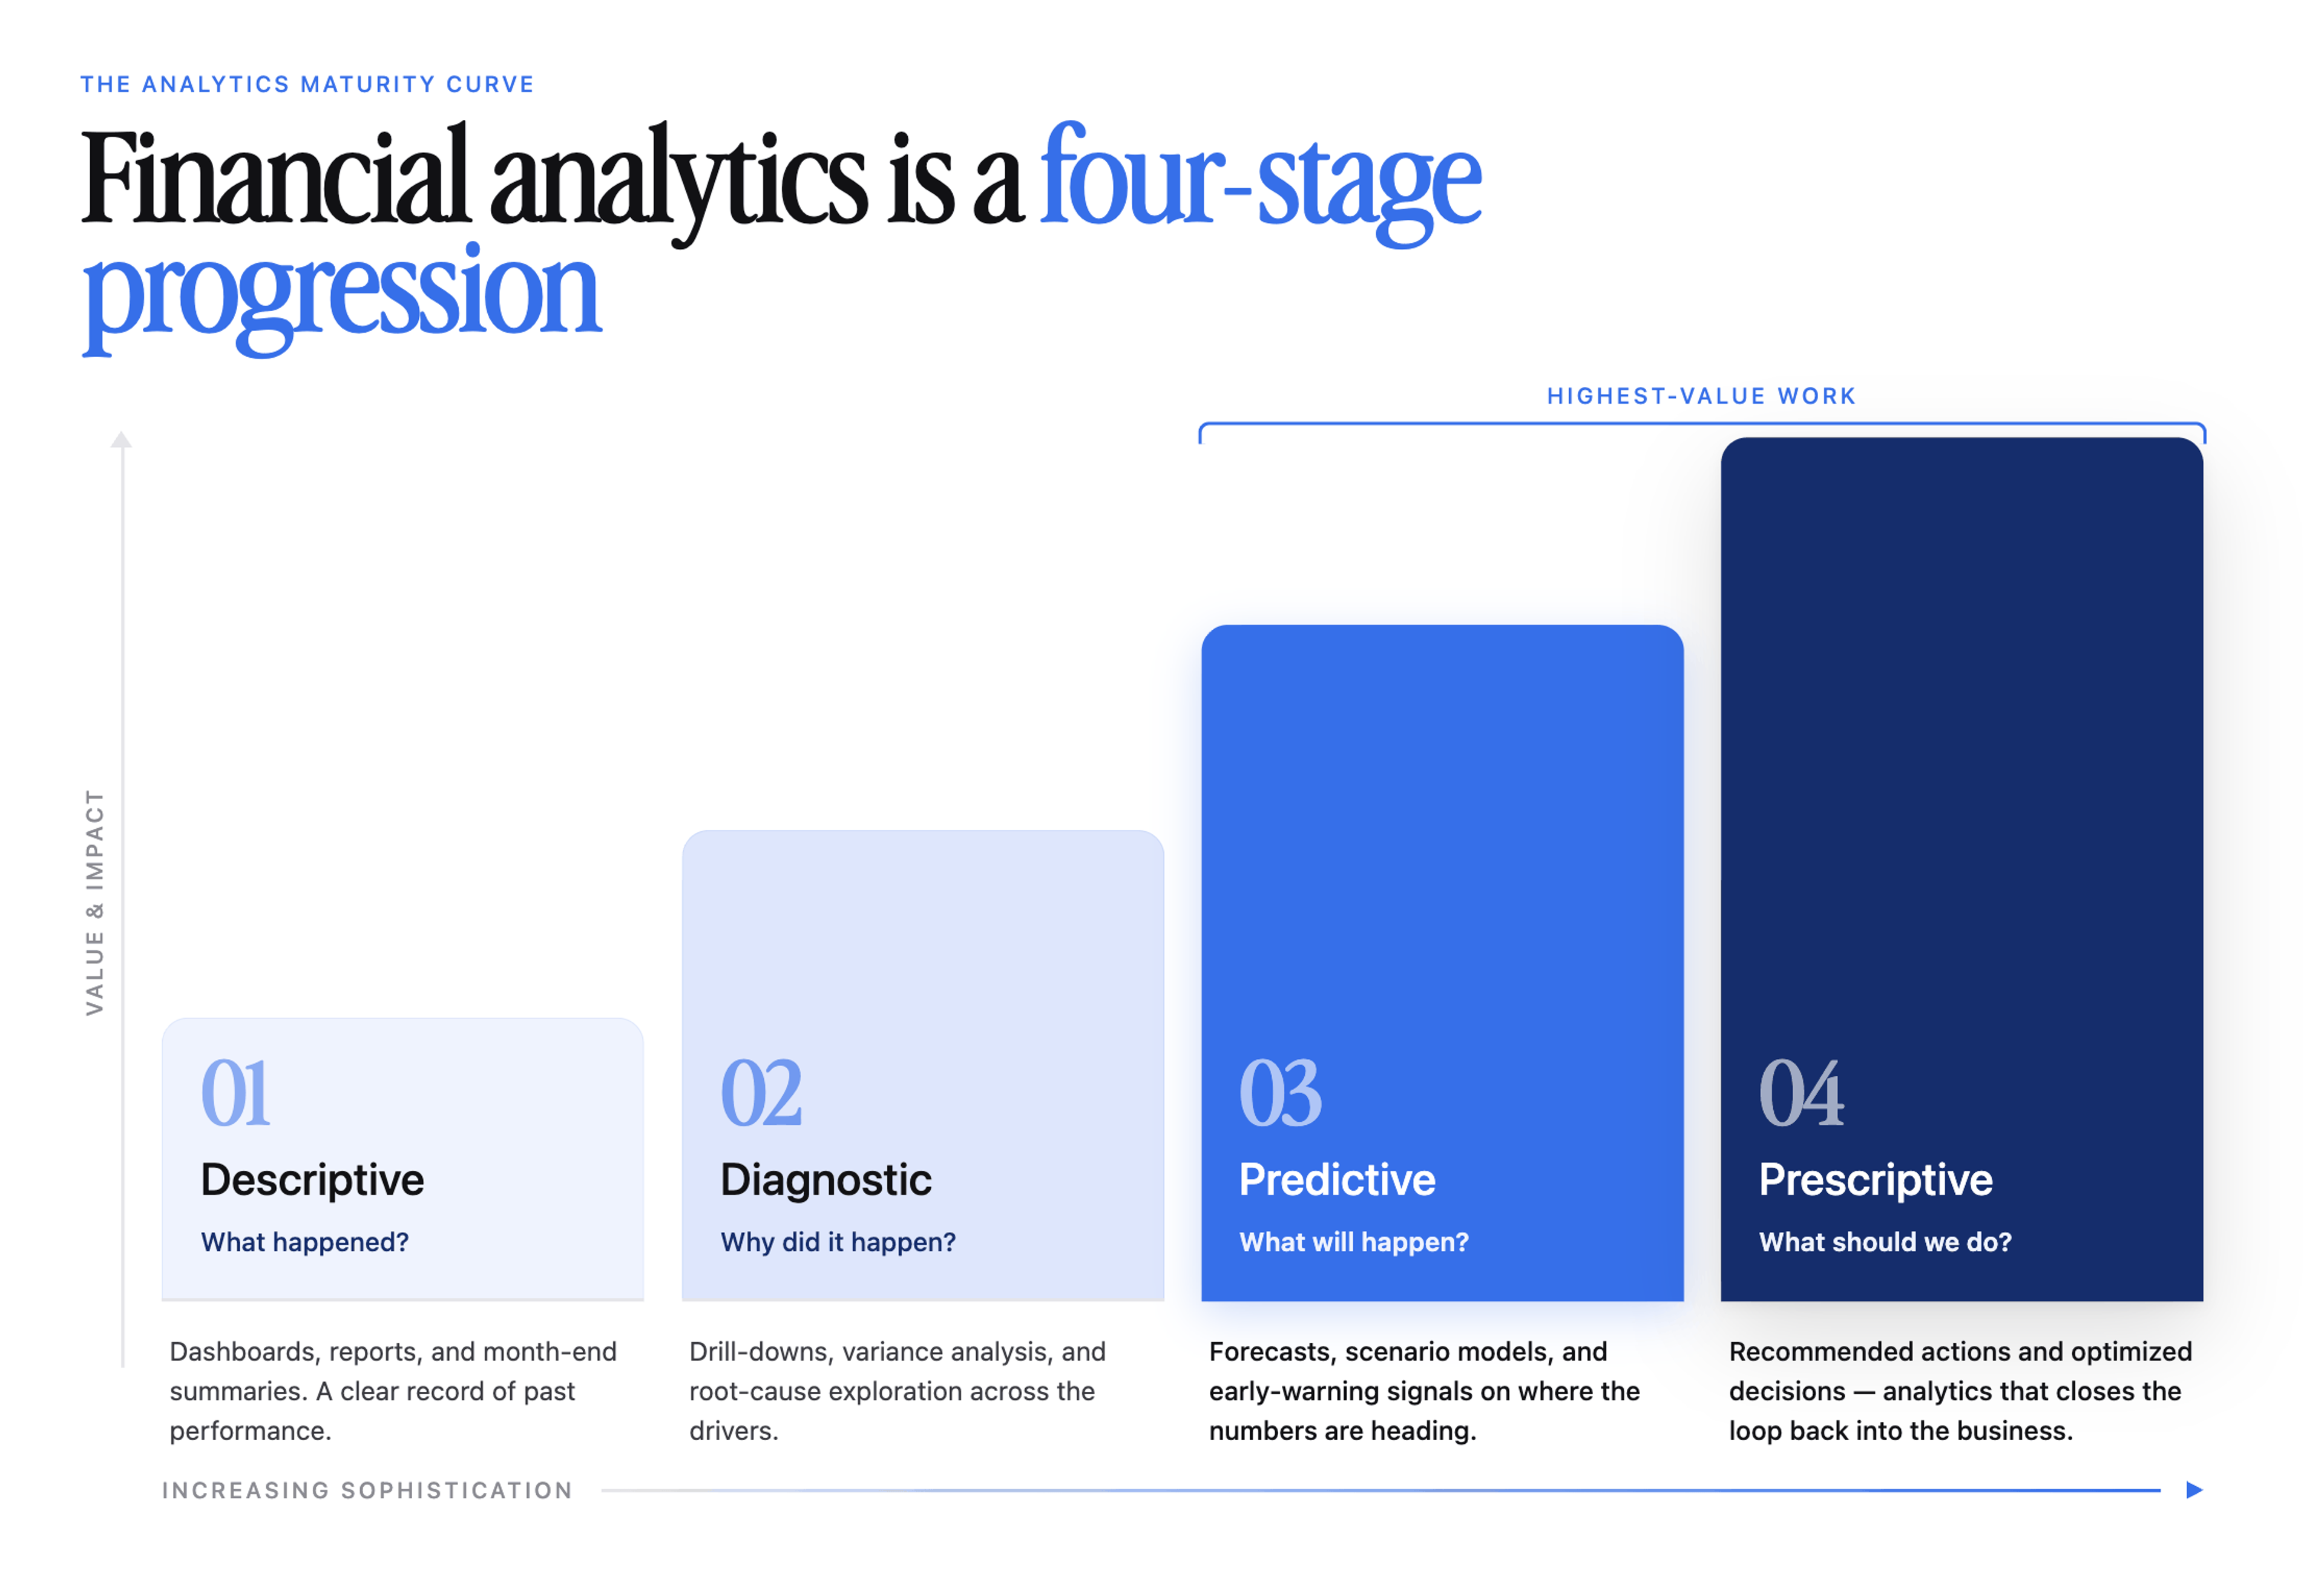
- Treat financial analytics as a four-stage progression (descriptive, diagnostic, predictive, prescriptive), and recognize that the highest-value work sits in the predictive and prescriptive stages.
- Prioritize live warehouse connectivity over batch exports: use cases such as cash visibility and anomaly detection lose value with week-old data, so the analytics layer should query the warehouse directly.
- Give finance direct ownership of the model, rather than routing every change through IT or SQL. If controllers can only adjust filters, iteration speed will lag the pace of decisions.
- Require writeback, approvals, and workflow triggers in the analytics layer so scenario plans, forecast overrides, and budget adjustments execute in place rather than stalling in a read-only dashboard or PDF.
- Financial data is a great starting point. Operational data (sales transactions, payroll records, cash collections, inventory data) are what enable the finance team to make actionable recommendations to the business to increase profitability and cash flows.
What is financial analytics?
Financial analytics is the discipline of analyzing a company's financial and operational data to explain past performance, forecast future outcomes, and recommend specific actions that improve business results. It combines descriptive, diagnostic, predictive, and prescriptive techniques on data from the ERP, general ledger, billing systems, and the cloud data warehouse to support decisions across FP&A, treasury, accounting, and the broader business.
- Descriptive analytics answers what happened. It summarizes historical results, such as revenue by quarter or spend by department, so teams have an accurate baseline to work from.
- Diagnostic analytics answers why it happened. It drills into the descriptive numbers to isolate drivers, such as which region or product line caused a margin decline.
- Predictive analytics answers what's likely to happen next. It uses historical patterns and current trends to forecast outcomes, such as projecting cash flow or revenue for the next quarter.
- Prescriptive analytics answers what to do about it. It recommends specific actions, such as reallocating budget or adjusting a forecast, based on the predicted outcome.
Financial analytics shifts finance from scorekeeping to strategy. FP&A teams spend 45% of their time on data collection and validation, and only 35% on insight generation and driving action. Financial analytics automates the collection and generation work, so finance can spend that time with colleagues across the business explaining why a number moved and deciding what to do next.
How financial analytics differs from standard financial reporting
Standard financial reporting produces compliance-grade records of a closed period. Financial analytics works on the same underlying data to explain why those results happened, project what's likely next, and recommend what to do about it.
The P&L records revenue, costs, and profit for the period. It might tell you that revenue fell by 8% last quarter. Financial analytics on the same data goes further. It shows that discounting in one segment is pressuring margin, that the margin compression is likely to continue if pricing policy stays unchanged, and that tighter approval workflows could improve the outcome. Financial analytics can also answer questions a P&L alone cannot, including:
- Where revenue is leaking across customers, channels, and product lines
- Which deals or segments are dragging blended margin down
- What happens to the bottom line if pricing changes or a top customer churns
- Whether the annual budget is still valid or the business has already moved past it
The balance sheet captures assets, liabilities, and equity at a point in time. Financial analytics turns that snapshot into working-capital decisions: which receivables are aging, how inventory ties up cash by SKU, and how to optimize working capital without starving operations. It also stress-tests the balance sheet under different scenarios, including an M&A target under multiple integration plans.
The cash flow statement reports cash inflows and cash outflows for the period. Financial analytics extends it into rolling, driver-based cash visibility. It projects when the company will face a shortfall, how much runway it has under different revenue and collections assumptions, and which levers (collections cadence, supplier terms, discretionary spend) most improve the position.
The 4 types of financial analytics
Financial analytics spans four types that build on each other: descriptive, diagnostic, predictive, and prescriptive. Most finance teams still get the furthest in the first two, while the highest value sits in predictive and prescriptive work.
Descriptive analytics
Descriptive analytics summarizes historical financial data to show what happened, through financial ratio analysis, KPI dashboards, horizontal analysis, and period-over-period variance reporting. Many finance teams do this for regulatory, statutory, or audit-related reasons.
Descriptive analytics is the foundation on which every other type builds, but on its own, it produces backward-looking records.
Diagnostic analytics
Diagnostic analytics explains why results turned out the way they did by isolating the drivers behind an observed outcome. While descriptive analytics shows that margin fell by 200 basis points, diagnostic analytics determines whether the driver was pricing, product mix, volume, or changes in cost inputs. It answers the "why" that a variance report alone leaves open.
Finance use cases include root cause analysis of margin erosion, revenue variance decomposition by region or product line, and cross-functional cash-savings identification.
Predictive analytics
Predictive analytics uses historical data, statistical models, and probability to forecast what is likely to happen next, including revenue projections, cash flow shortfalls, credit risk scores, and demand signals.
A forecast gives you the numbers, and the decision still belongs to a person. Predictive analytics powers driver-based budgeting, rolling forecasts, and continuous cash flow tracking.
Prescriptive analytics
Prescriptive analytics recommends the specific action to take by running predictive forecasts through optimization and scenario logic. It answers the question every finance leader faces: "What should we do?" Outputs include which capital allocation maximizes return, which pricing scenario protects margin, and which integration plan creates the most value in an M&A.
Finance use cases include scenario simulation for strategy evaluation, AI-aided decision support through advanced modeling, and capital allocation optimization.
How financial analytics works
Financial analytics works in three stages: it starts with current financial data, runs that data through a model that finance can shape, and ends with an output that informs decisions.
The quality of the result depends on how fresh the data is, how easily finance can ask new questions of it, and whether the answers can be acted on without leaving the workflow.
Pull current financial data into one place
Every financial analytics workflow starts with data, and the first failure mode is stale data. FP&A teams often spend weeks on manual data collection and manipulation, so the numbers they assemble are outdated by the time they reach decision-makers.
For use cases such as cash visibility and anomaly detection, freshness can determine whether the analysis remains useful. Batch-refreshed or week-old data quietly erodes its value, so it is important to pull live data into your financial analytics.
Model the data into the metrics that finance reports on
Raw financial data (transactions, GL entries, and invoices) has to be shaped into the metrics finance actually uses: contribution margin by product line, customer lifetime value, cash conversion cycle, and budget-to-actual variance. This modeling step is where most bottlenecks appear.
Spreadsheet-based models create version chaos and error risk. In legacy BI or a BI tool that requires SQL, finance waits on engineering for every change. Either way, the people closest to the business question are furthest from the model.
Deliver the result where decisions get made
Analytics has to carry the work into execution. When the output is a read-only dashboard, a PDF, or a screenshot pasted into a slide deck, work stalls between insight and action.
Spreadsheet-based cost allocation processes compound the problem. They introduce errors and make pricing decisions harder to manage. Connecting analytics directly to the operational system, where finance makes those decisions, reduces reliance on another static report.
Best practices when implementing financial analytics
Financial analytics delivers maximum value when the underlying setup provides finance with current data, model control, a path to action, and governance that the auditor trusts.
Work from current data
Batch-based architectures struggle to support the decision velocity modern finance operations require. That matters most for treasury use cases like cash visibility and anomaly detection, where delayed financial data steadily erodes the quality of decisions being made, because leaders believe they're acting on facts that often reflect a version of the business that no longer exists.
The architecture must deliver up-to-date financial data to the analytics layer. In warehouse-centric environments, that means querying a cloud data warehouse directly rather than exporting to an intermediary.
Empower finance to self serve the data
Finance teams are the intended primary users and interpreters of financial data. The same data they collect for statutory obligations is what companies use to drive value. When modeling, analytics, and visualization require IT mediation for every change, finance can no longer iterate at the speed decisions demand.
That means finance needs to reshape the underlying model itself, rather than just toggling a few filters on a dashboard that still leaves the structure dependent on IT.
Make the numbers actionable
Analysis disconnected from action produces shelfware. The analytics layer needs to support writeback, approvals, and workflow triggers so finance can act on what they find without exporting to another system. Exploratory analysis, notifications, and follow up documentation should all live together in the analytics layer.
Keep every figure governed and auditable
Governance for compliance and governance for analytics must be unified from the outset and should not operate as parallel systems. Data lineage, data dictionaries, and integrity controls should be co-designed with the analytics layer, so that every figure has a traceable path from source to report, and both the person reading the number and the auditor reviewing it can follow the same trail.
How Sigma supports financial analytics
Sigma also looks and works like a spreadsheet, so business users can add numbers, comments, approvals or any other input the same way they would in a spreadsheet, without needing SQL or a data team to build it for them.
Finance models on live warehouse data through a spreadsheet interface
Finance teams use the formulas, pivots, and spreadsheet formulas in order. They can pivot on the full dataset, filter live, and drill from a high-level summary to a transaction-level view in seconds, all without exporting a row. The Excel comfort stays, while the row ceiling, the offline files, and the version chaos go away.
For example, Makena Capital, a private endowment managing roughly $20 billion across a fund-of-funds structure, reclaimed 50% of analyst reporting time after moving to Sigma from a monolithic spreadsheet with a 50% open failure rate. The team also stood up new workbook capabilities for portfolio projections and client-specific reporting.
Writeback turns analysis into action without leaving the platform
Sigma's writeback capabilities let finance teams edit data in the workbook and write changes directly back to the warehouse, so scenario planning, budget adjustments, commission calculations, reconciliations, and forecast overrides happen in the same place as the analysis, rather than in a separate planning tool.
Sigma Actions coordinates the handoff between a submitter, an approver, and finance, with each writeback carrying an audit trail of what changed and when. Actions can also reach external systems. For example, a Sigma Action can fire an API call into a payroll provider to trigger an off-cycle reimbursement without Sigma ever storing payment data. Permissions and row-level security carry through directly from the warehouse. Hence, a submitter sees only their own data, while an approver sees their team's, with no parallel entitlement layer to maintain.
Yamaha Finance reduced reporting time by 80% and achieved 75% employee adoption by replacing Excel- and email-based reporting with governed self-service on Sigma. The team rebuilt FP&A workflows, reconciliation tools, and Access-style applications on Input Tables and warehouse views.
AI agents handle repetitive financial workflows
Sigma's AI features run across the customer's governed AI and warehouse stack, inheriting row-level security and lineage so finance users can ask questions while access controls remain intact. When configured with warehouse-native models, data can remain inside the warehouse environment. Three surfaces matter most for finance:
- Sigma Assistant analyzes data and builds apps in natural language, and every answer traces back to the underlying table.
- AI Columns brings LLM calls directly into the spreadsheet grid, governed by the warehouse. For example, finance can add an AI Column to classify vendor invoice notes as positive, negative or neutral, or to match vendor names that have minor typos or formatting differences across systems.
- Sigma Agents are customized agentic workflows configured within a workbook, built to run in the background so finance doesn't have to. A builder can configure an Agent to flag anomalies in transaction data, draft variance commentary for a monthly close, or run a forecast scenario and surface the result to the right stakeholder, all within the permissions and data access the builder sets. Agents act only within those configured boundaries, and workflows can range from fully conversational to human-in-the-loop to autonomous, depending on how much oversight finance wants on a given task.
Together, these surfaces take on the repetitive financial workflows that used to consume analyst hours, including variance commentary, exception flagging, expense submissions, and forecast roll-forwards.
These capabilities show up for Sigma's users, like AB CarVal, with 15 to 16 terabytes of compressed data in action-built dashboards that let business users query 80-plus-page fund documents in natural language within the customer's governed environment.
Get started with financial analytics on Sigma
The hardest part of moving into financial analytics is the operational side. Take one real workflow off a stale spreadsheet, move it onto live, governed data, and prove the model works before scaling it.
The fastest path is to pick a single, painful workflow: monthly variance reporting, cash flow forecasting, or budget-to-actual analysis. Rebuild it once in Sigma on live warehouse data, wire the writeback into the planning step, and use that as the template for the next workflow.