What Is Big Data Analytics? How It Works and Why It Matters for Business Intelligence

As businesses grow, so does the volume, velocity, and variety of the data they generate. Eventually, the business intelligence (BI) layer starts to lag the business it's supposed to describe. Reports arrive stale, some business data sits entirely outside the model, and the insights needed to make business decisions stay stuck in a data queue.
The main reason for that lag is that traditional BI was built for structured, slower, smaller data. It relies on predefined schemas, OLAP cubes, nightly batch loads, and reports scoped to questions the data team already knew to ask. When someone needs an answer outside those reports, they export what they can into a spreadsheet and race to finish the analysis before the numbers go stale. And the data often won't fit in the first place: a warehouse table of hundreds of millions of rows won't load into a desktop spreadsheet. Big data analytics is the discipline designed to reduce the lag between the data a business generates and how quickly it can generate insights from it.
This article covers what big data analytics is, how the pipeline works, the benefits it delivers, the components of the stack, and what it takes to implement it.
Key takeaways
- Before implementing big data analytics, three prerequisites need to be in place: a specific business case tied to real decisions, clean and governed data in the highest-value domains, and a team that spans engineering, science, and business context.
- Many big data programs quietly break down at the analysis layer, so design them to enforce governance at query time rather than after data leaves the warehouse.
- The scarcest resource in a big data program is skilled people, so prioritize tooling that lets business users self-serve on live warehouse data instead of queuing behind engineers.
What is big data analytics?
Big data analytics is the practice of examining large, fast-moving, and varied datasets to uncover patterns, trends, and correlations that inform decisions. On top of that infrastructure, it applies advanced techniques, including data mining, predictive analytics, and machine learning, to move beyond descriptive reporting into predictive and prescriptive insights, covering what is likely to happen next and what to do about it.
Where traditional BI begins to struggle, big data analytics uses distributed storage, distributed compute, and flexible schema approaches to keep pace. Three emerging characteristics of business data explain why this shift is necessary:
- Volume climbs from gigabytes to terabytes to petabytes as web, mobile, transactional, and connected-device sources continuously produce data.
- Velocity accelerates as events arrive in real time or near real time and lose value within seconds of being generated.
- Variety widens as semi-structured JSONs sit alongside structured tables and log files, as well as unstructured text, images, audio, and video.
Two other factors, veracity (the trustworthiness of the data) and business value (the business value of what's extracted from it), also contribute to the need for big data analytics.
How big data analytics works
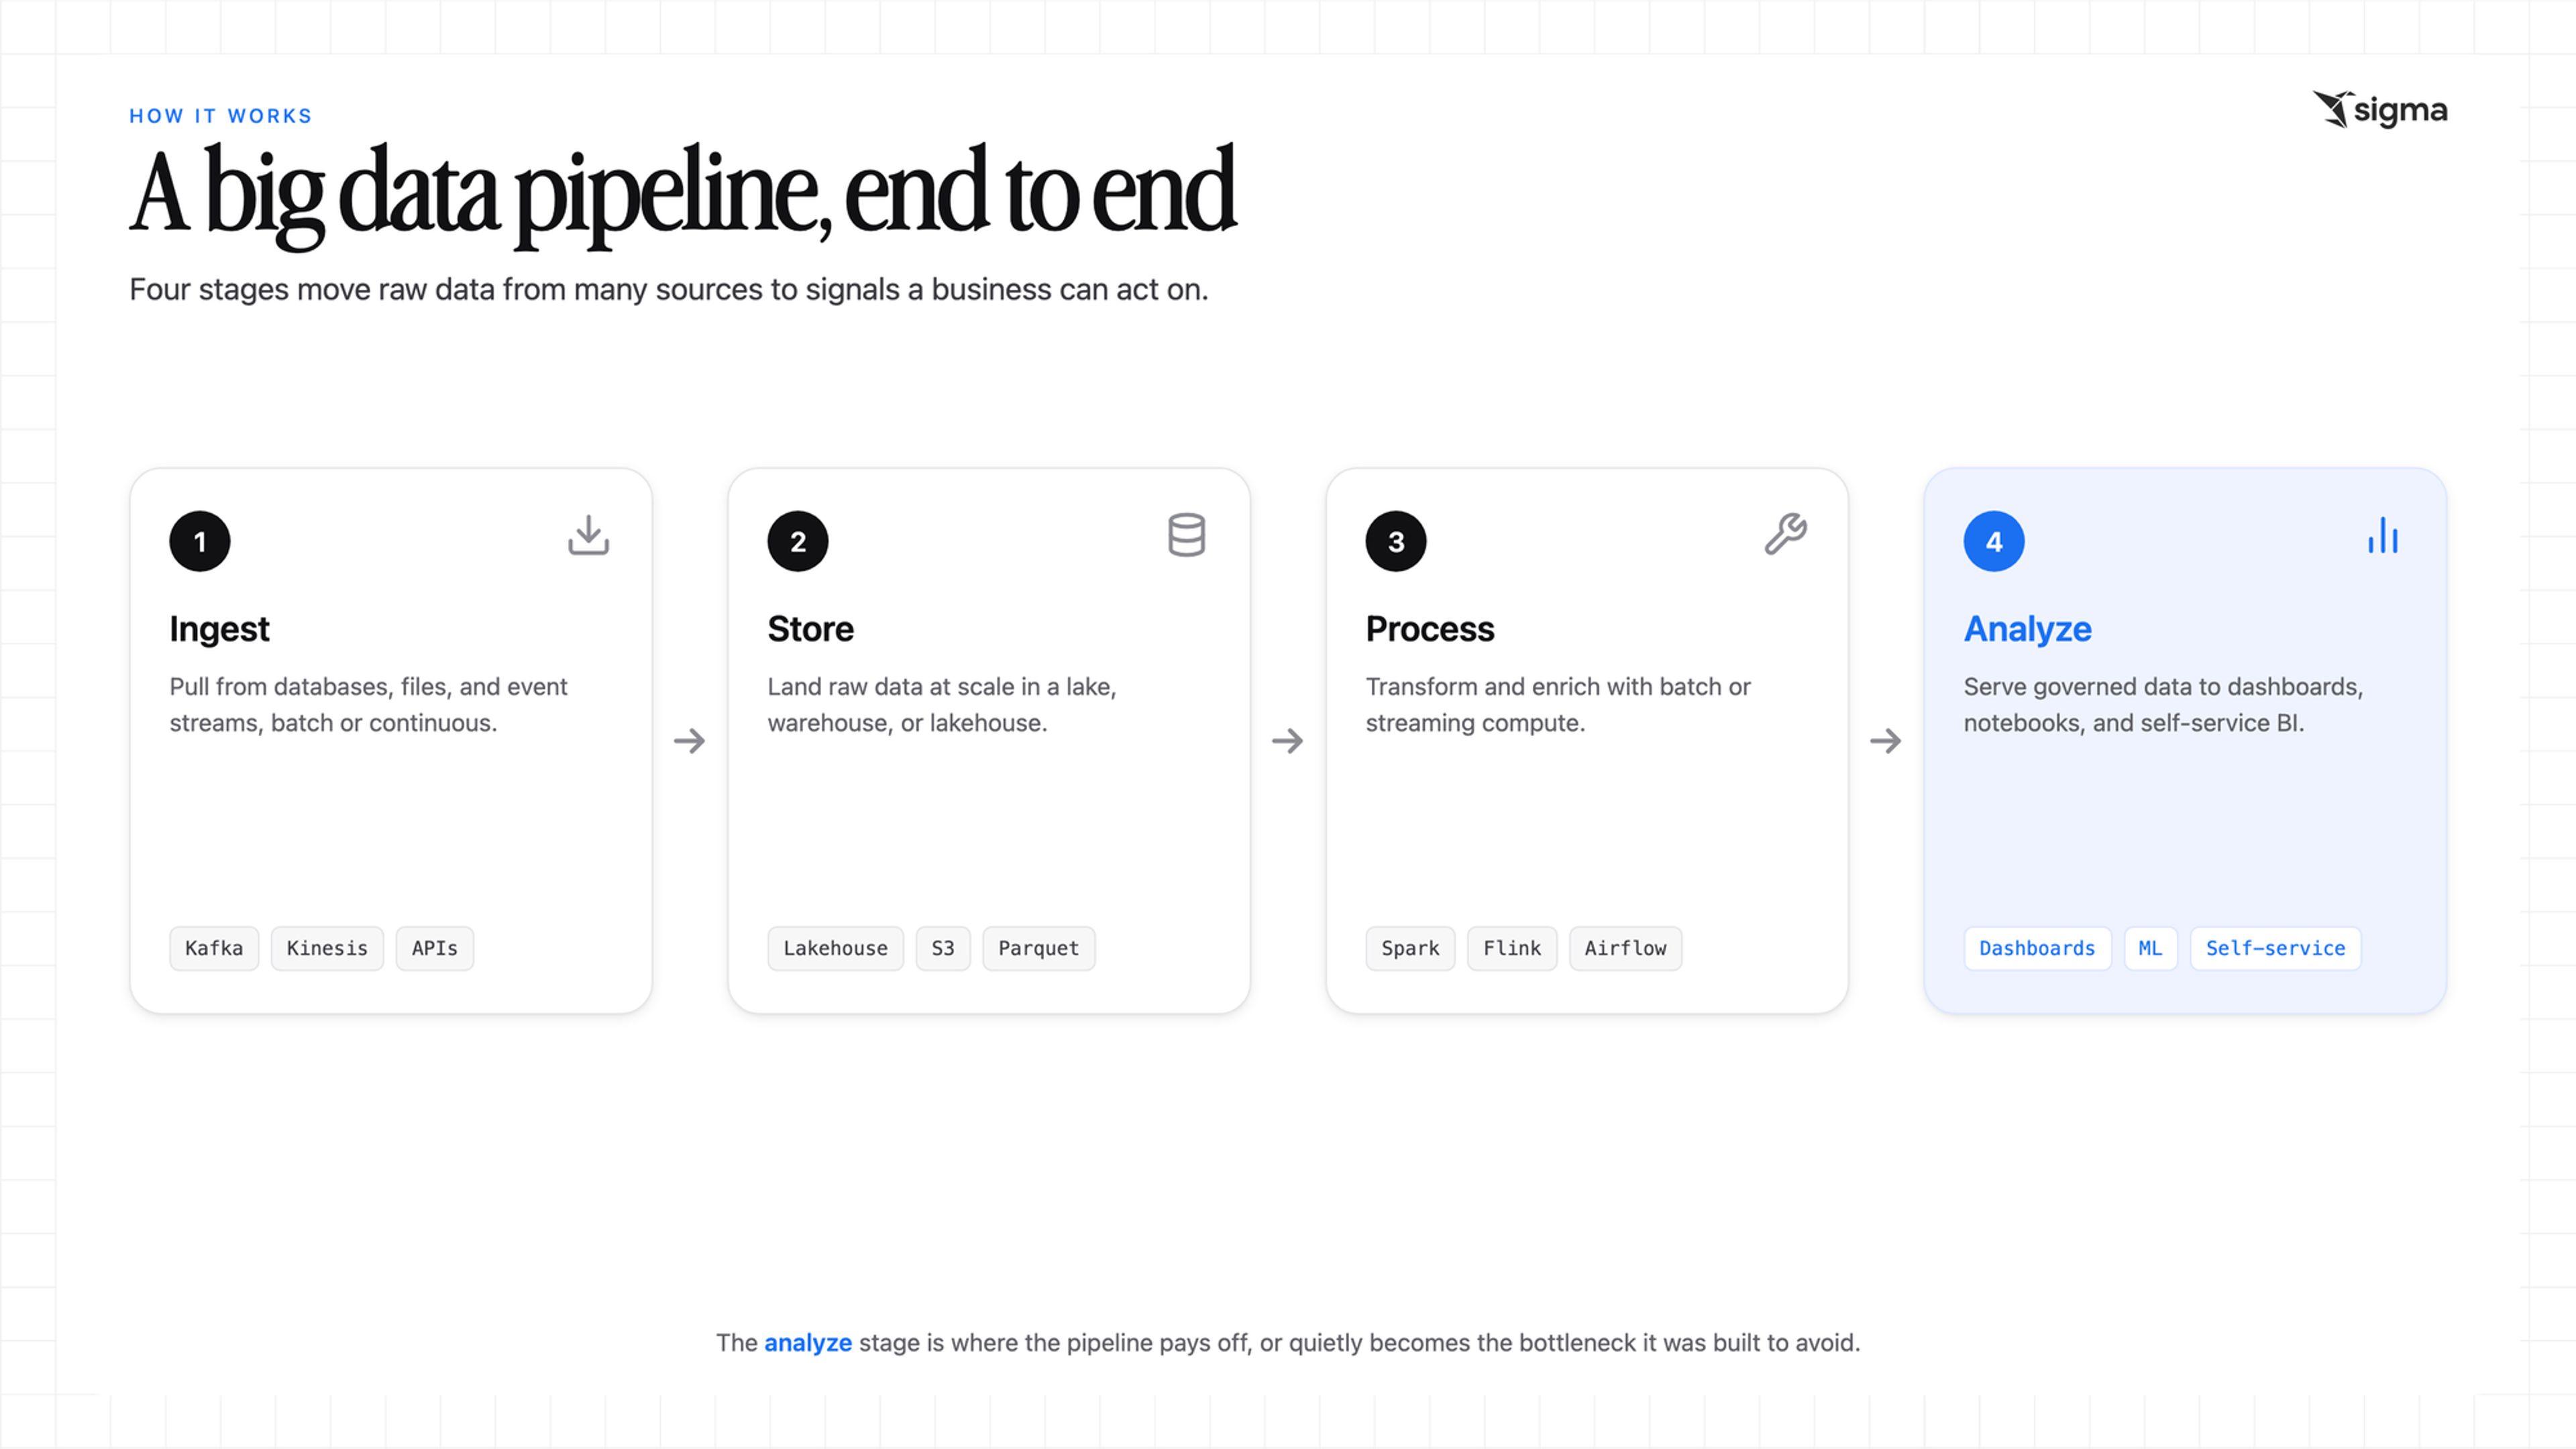
A big data analytics pipeline typically moves through four stages: ingest data from many sources, store it at scale, process it with batch or streaming techniques, and analyze the output to surface signals a business can act on.
Ingesting and storing data from multiple sources
Ingestion pulls data from relational databases, NoSQL stores, flat files in formats such as CSV, JSON, Avro, and Parquet, and real-time event streams via tools such as Apache Kafka, Amazon Kinesis, or Google Pub/Sub. APIs bring data in either at scheduled intervals (batch) or continuously (streaming).
The transformation approach matters here. ETL transforms data before loading it, which fit an era when storage and compute came bundled in one system and both were expensive, so keeping raw data you might never use was wasteful. ELT loads raw data first, then transforms it inside the warehouse, where the cloud has separated cheap object storage from compute you can scale on demand. Keeping the raw layer intact preserves flexibility for reprocessing and downstream reuse, which is why ELT is common in modern cloud environments.
Storage usually takes one of three forms:
- Data lakes hold raw structured, semi-structured, and unstructured data using schema-on-read.
- Data warehouses receive structured data through a predefined schema for reporting.
- Data lakehouses aim to combine both, pairing cloud object storage in open formats like Parquet with a metadata layer that adds warehouse-style reliability.
For enterprises using Databricks, Snowflake, BigQuery, Amazon Redshift, and others, the lakehouse can serve as a practical baseline.
Processing data through batch and streaming techniques
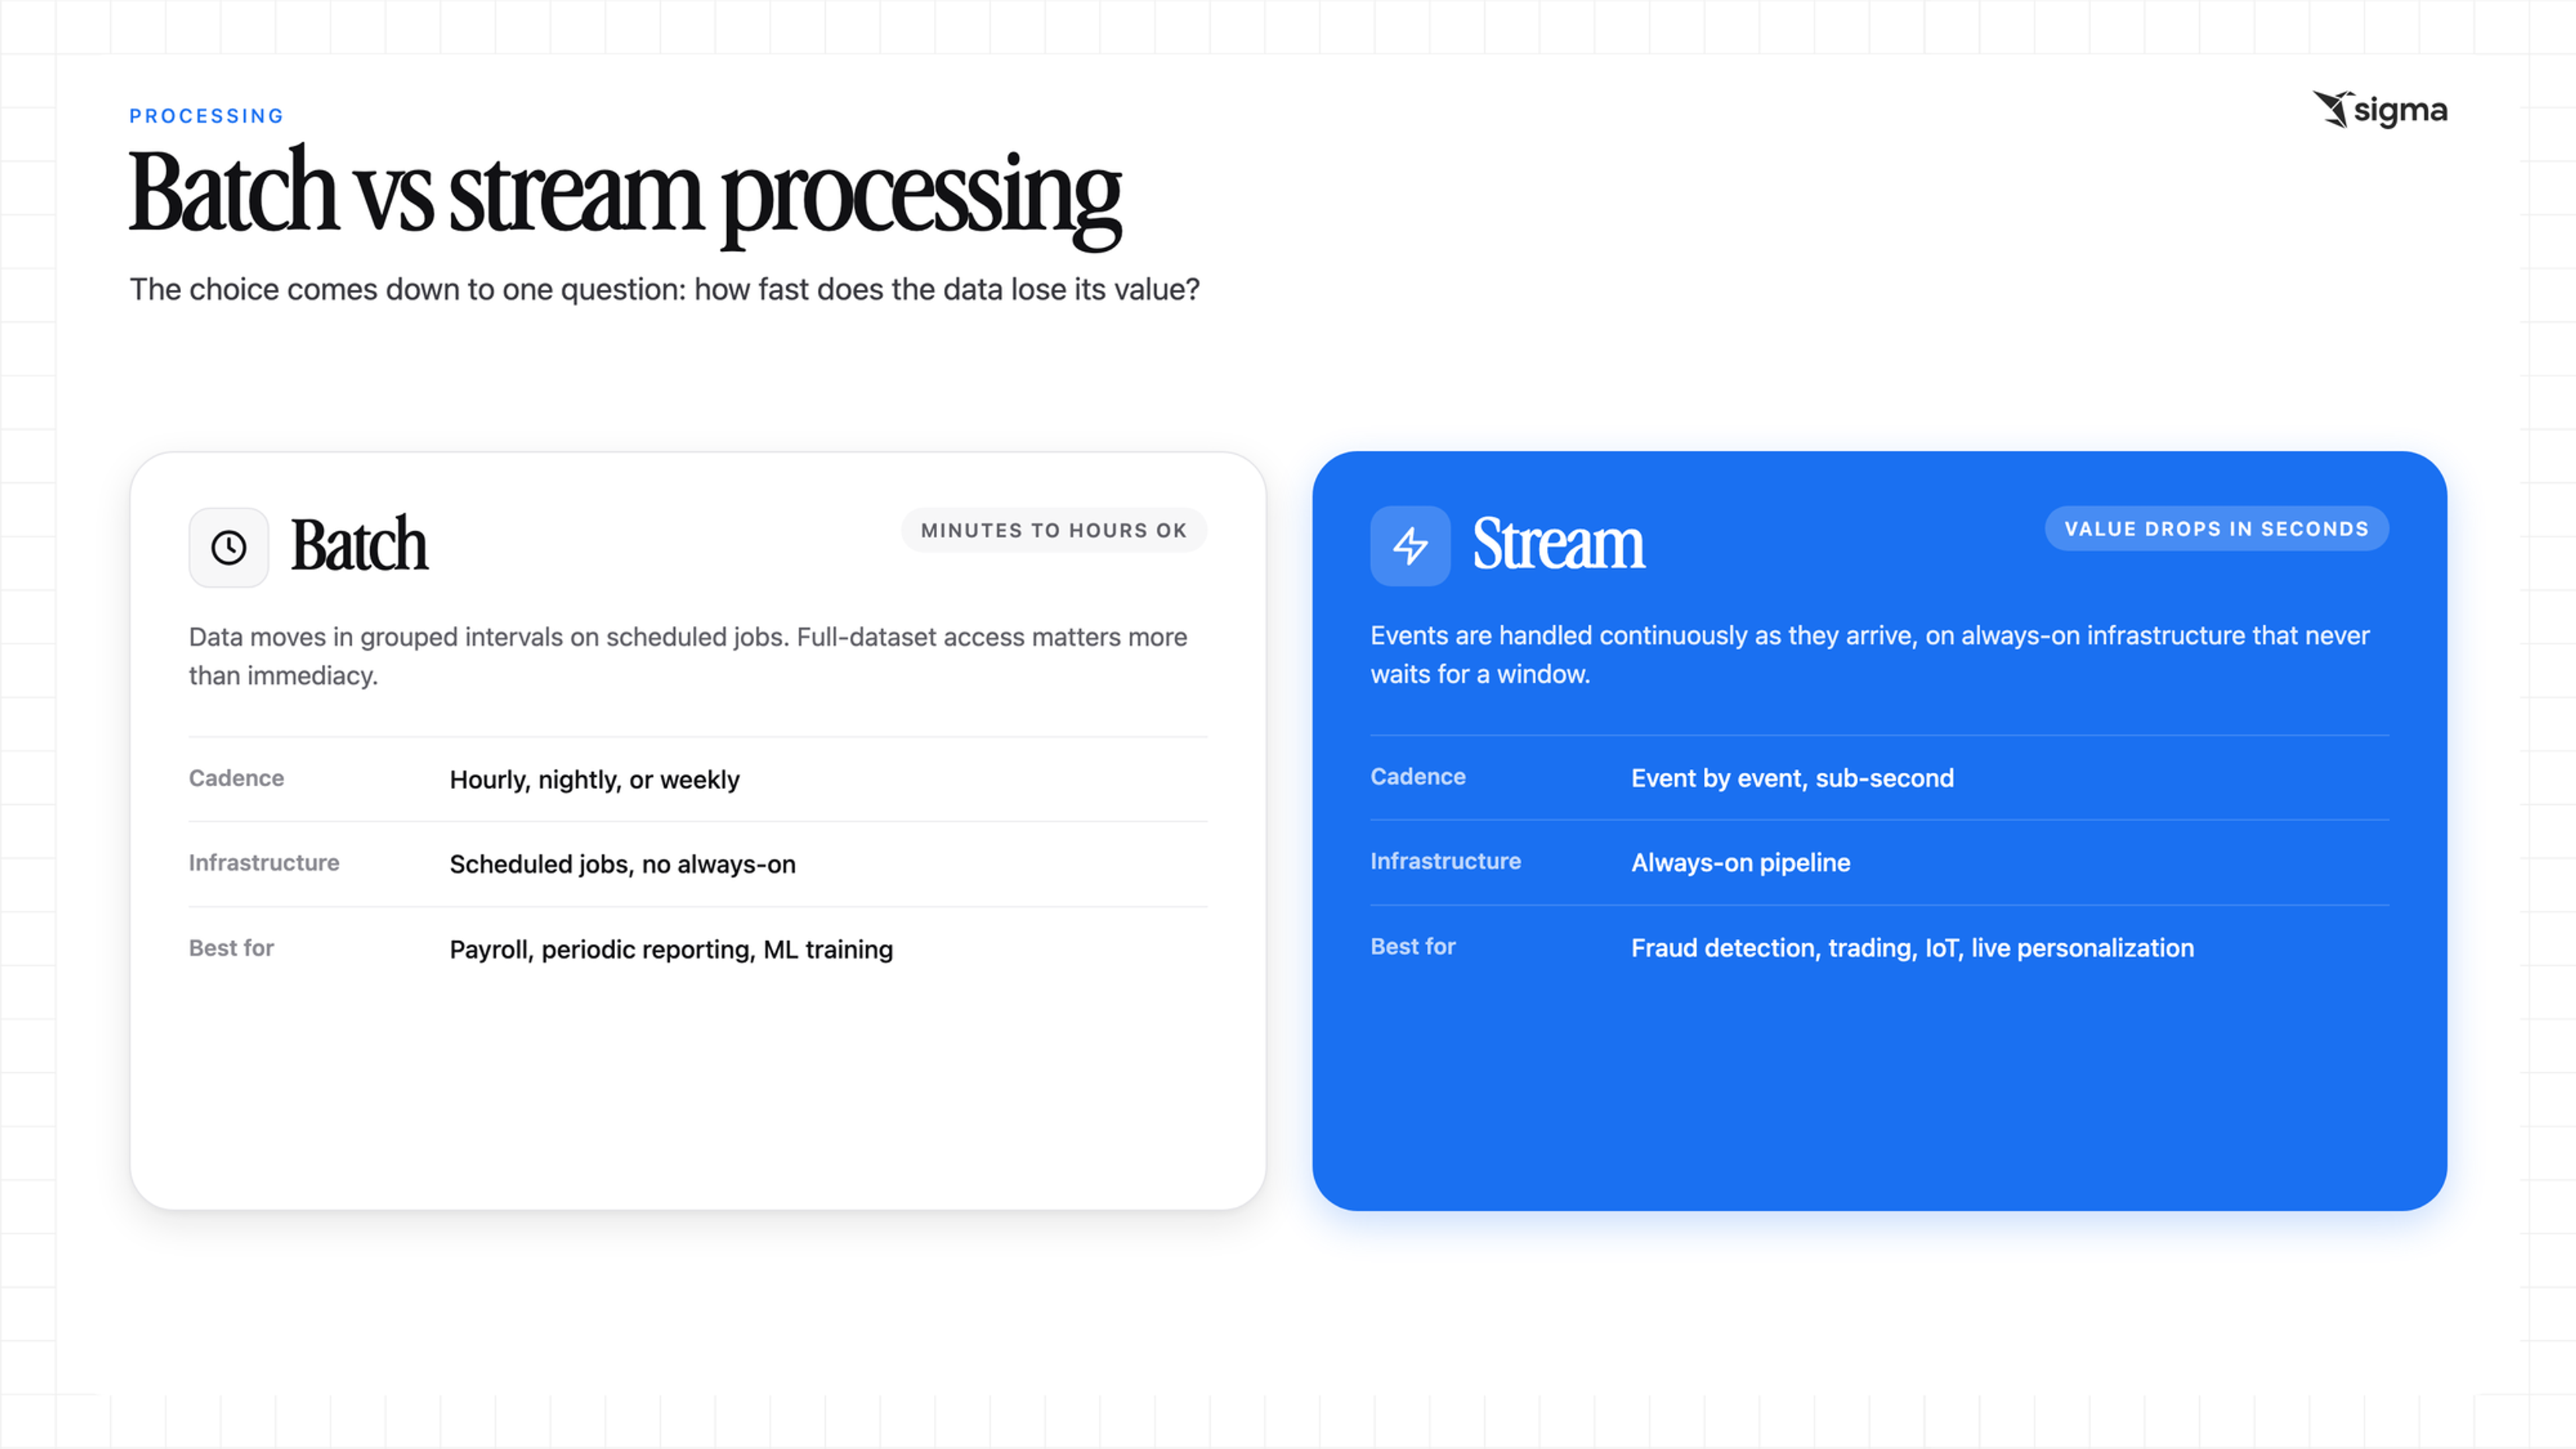
Data processing in big data analytics often depends on whether the data is bounded or continuous.
Batch processing moves data in grouped intervals, hourly, nightly, or weekly, and suits work where a latency of minutes or hours is acceptable. It runs on scheduled jobs rather than always-on infrastructure, so payroll, periodic reporting, and machine learning training all favor batch processing because full-dataset access matters more than immediacy.
Stream processing handles events continuously as they arrive. It depends on always-on infrastructure, and it's the right choice when the value of data drops within seconds: fraud detection, algorithmic trading, IoT monitoring, and live personalization.
Many organizations combine the two through one of two architectures. Lambda architecture splits work into parallel batch and streaming paths, which can be powerful but expensive, as teams must maintain two codebases that must produce consistent output. The Kappa architecture removes the batch layer and runs everything through a single streaming pipeline, replaying the stream when historical analysis is needed.
Analyzing results and serving them to users
The final stage serves data to users through SQL interfaces, batch analytics jobs, BI dashboards, and machine learning models that run against the curated output. Different audiences reach it through different surfaces: analysts through dashboards and ad hoc queries, data scientists through notebooks and ML frameworks, business users through self-service tools that let them explore datasets without waiting on IT.
Governance sits alongside access at this stage. Row-level and column-level permissions, lineage, and audit controls determine who sees what. But the rules only hold if they live in one place. When every downstream tool maintains its own definitions, they drift, and teams end up with competing versions of the truth: the governed dashboard, slow to change, and the exported CSV or notebook, fast but already out of policy. People then walk into meetings with confident conclusions drawn from stale or ungoverned data.
Many legacy big data analytics solutions fall short at the analysis layer. A pipeline that ingests, stores, and processes cleanly can still fail here if the analysis layer forces exports, breaks governance, or leaves business users waiting on a specialist queue. The analysis layer then becomes the bottleneck the rest of the pipeline was built to avoid.
The benefits of big data analytics
When the pipeline works end-to-end, big data analytics changes how a business decides, forecasts, and acts. The benefits below are the ones commonly seen in mature programs.
- Confident decision-making. When every team queries the same governed datasets instead of exporting their own snapshots, disagreements shift from whose numbers are right to what the numbers mean. Big data analytics centralizes data and the definitions on top of it so that the whole business can argue from a shared baseline.
- Insight into customer intent and behavior. Some patterns in customer behavior only become visible when you look at hundreds of millions of interactions. At small volumes, the signal is noise; at big data volumes, the same signal becomes a model that predicts what a customer will do next.
- Improved forecasting and reduced risk. Big data analytics widens the input set (transactions, sensor readings, external signals, unstructured feedback) and shortens the refresh cycle, so forecasts track reality more closely and update as reality changes.
- Personalized customer experiences. Big data analytics gives personalization engines the volume and variety of behavioral data they need to distinguish one customer's intent from another's. Personalization is a data problem before it's a creative one: you can't tailor an experience to a customer you don't know.
- Operational efficiency. Big data analytics surfaces bottlenecks in real workflows, prioritizes interventions by impact, and lets teams act before small issues compound into expensive failures. The efficiency comes from acting on evidence at business speed rather than in quarterly review cycles.
The throughline is that big data analytics reduces the distance between what's happening in the business and what leaders know about it.
The 3 components of a big data analytics stack
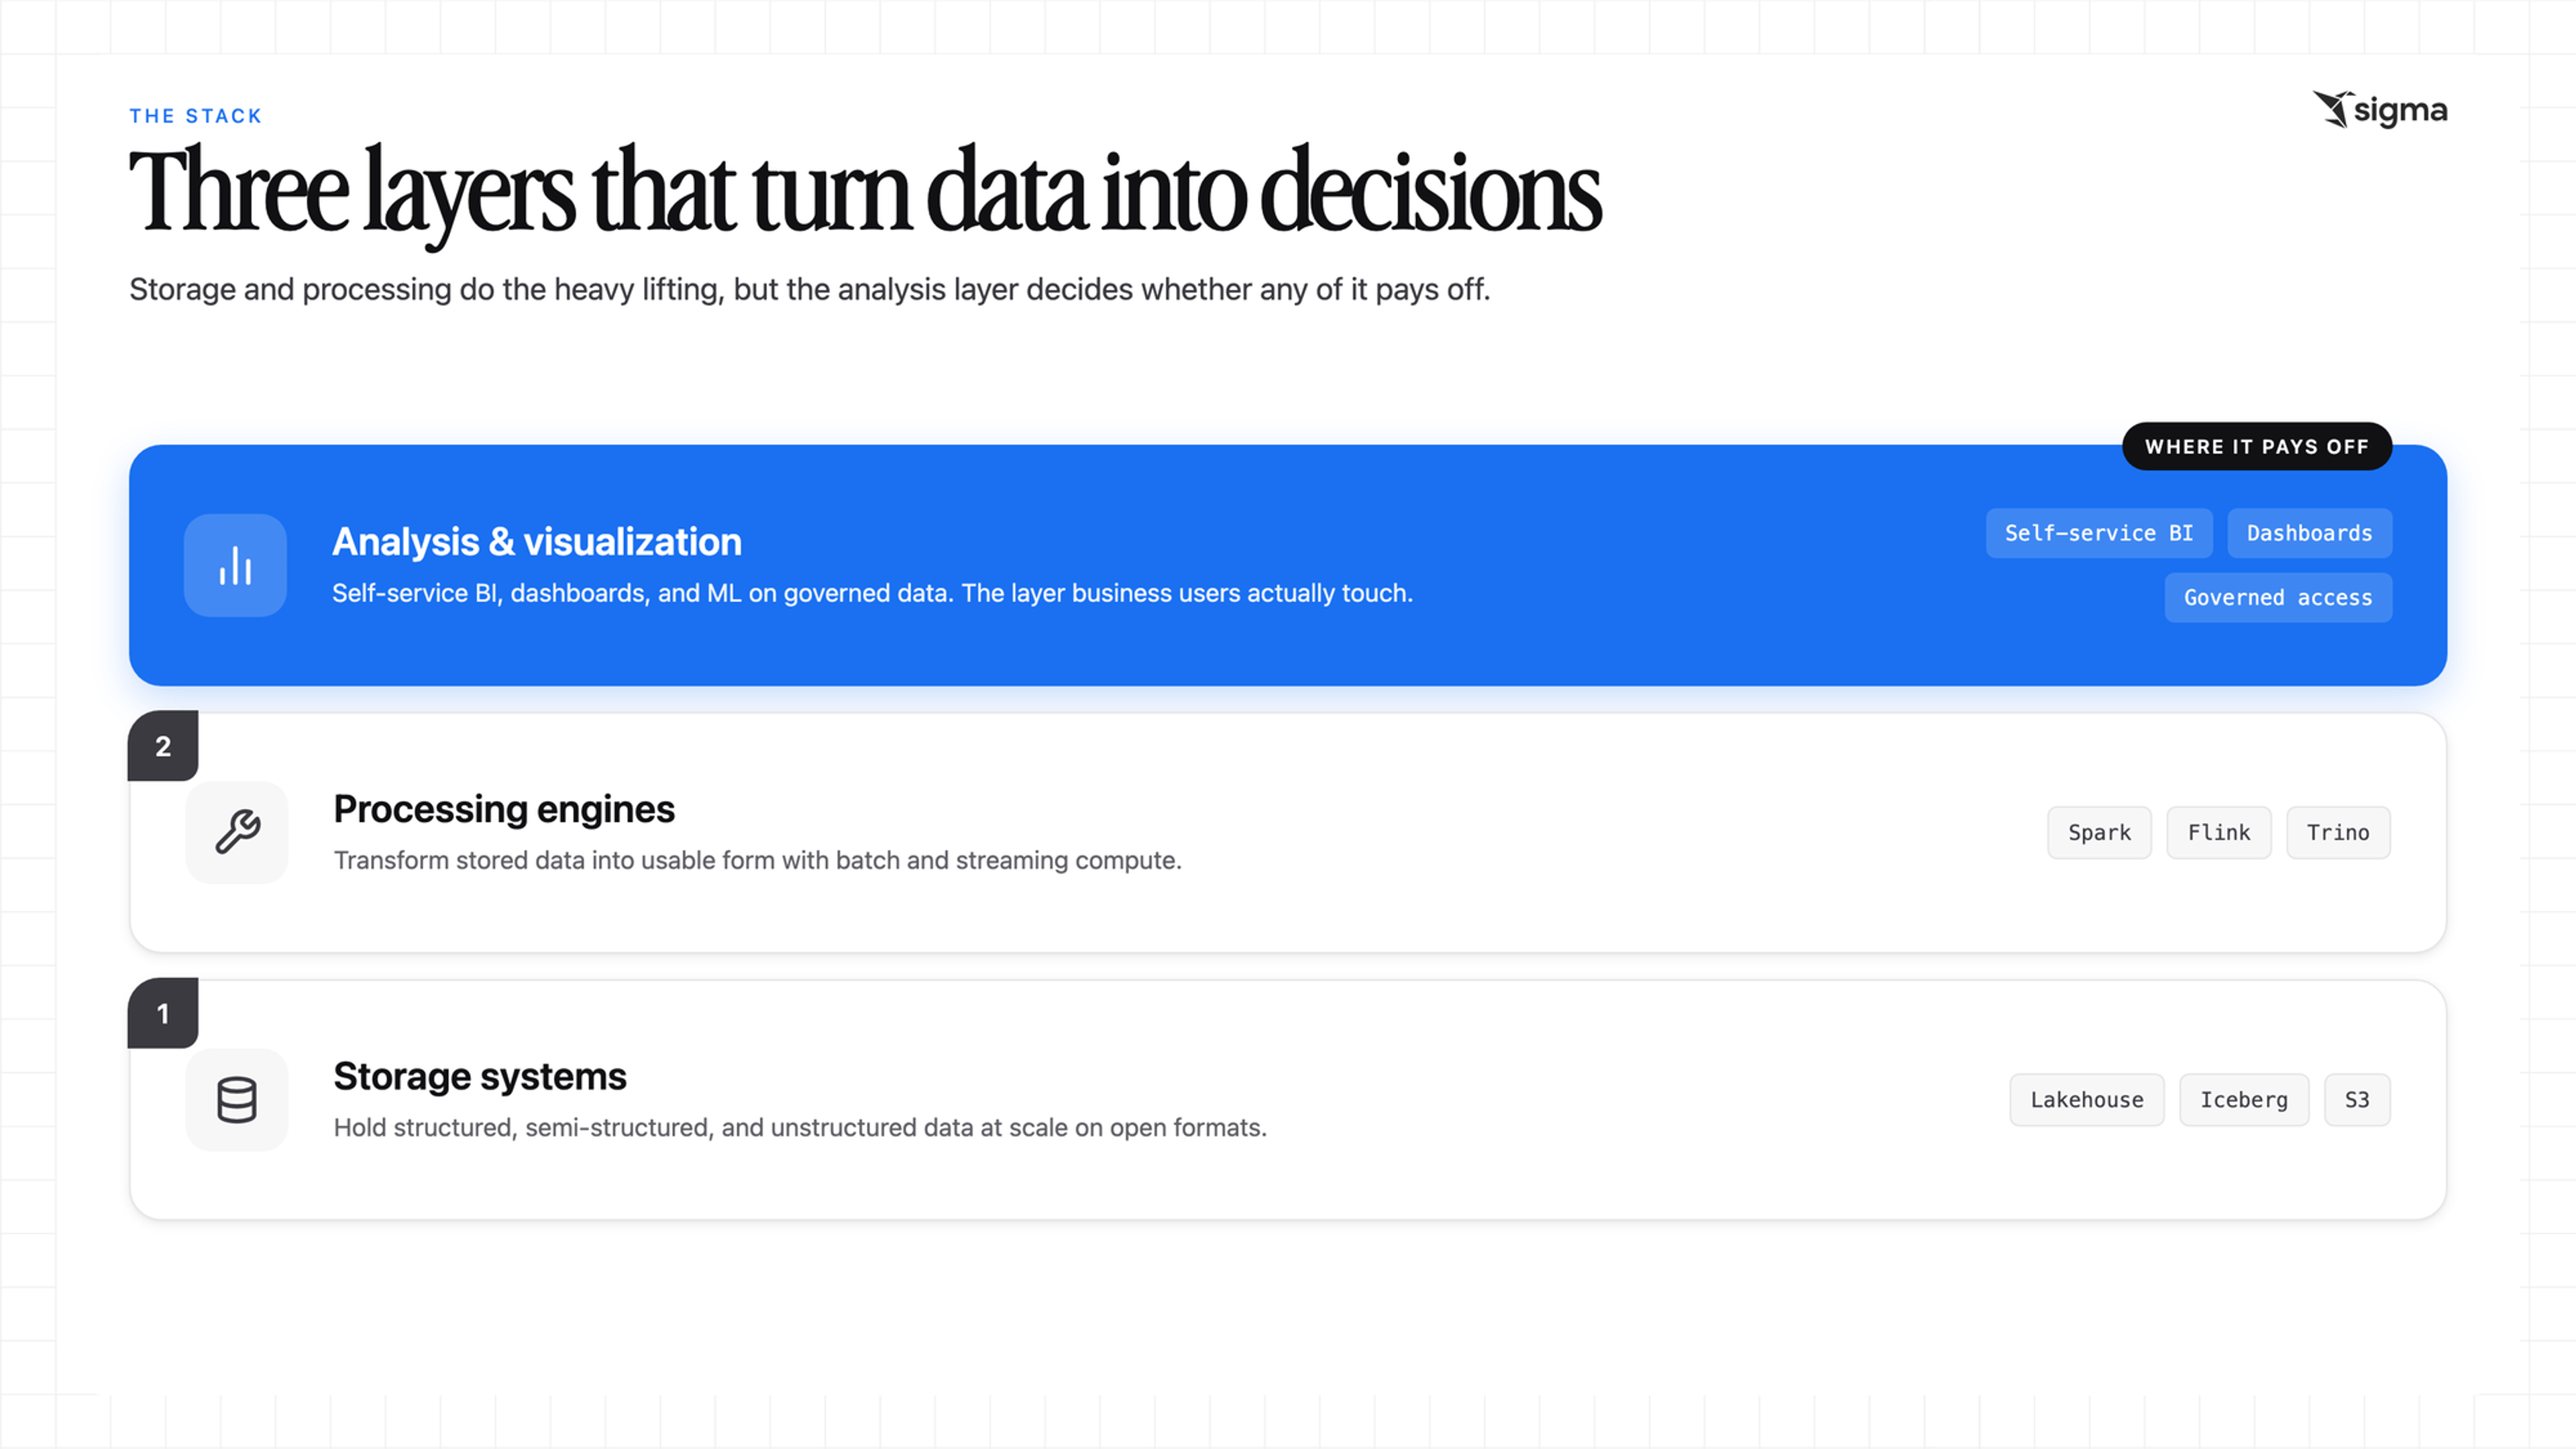
A big data analytics stack has three layers that work together: storage, processing, and the analysis and visualization layer that turns output into decisions.
1. Storage systems built for high volume and variety
Storage in a big data stack must hold the raw material of the analytics program: structured tables, semi-structured files, and unstructured data, all at scale.
Data lakes hold data in original form across raw, cleansed, and curated zones. Warehouses structure data for reporting but struggle with audio, video, and streaming inputs. Lakehouses combine both on open file formats like Parquet and ORC.
Table formats such as Apache Iceberg, Apache Hudi, and Delta Lake bring warehouse-style reliability features to data lakes. Physical storage sits on cloud object stores like Amazon S3.
2. Processing engines for batch and streaming workloads
Processing engines transform stored data into usable form, and different engines suit different workloads. Apache Spark is commonly used for batch and micro-batch streaming, while Apache Flink is commonly used for event-driven streaming.
Query engines, including Trino, Presto, and Spark SQL, support interactive analysis. A typical batch pipeline runs source to storage to Spark to a queryable store, orchestrated by Airflow, while a typical streaming pipeline runs producers to Kafka to Flink to a sink.
3. Analysis and visualization layers that turn output into decisions
The analysis and visualization layer determines whether the entire stack pays off. It provides self-service BI, dashboards, reporting, and machine learning against governed data, ideally democratizing access across analysts, data scientists, and business users.
A separate security and governance layer should enforce granular permissions so people access only the data they're authorized to see. This is the layer business users actually touch, so if it fails to serve them well, the ingestion, storage, and processing work underneath never reaches the decisions it was built to inform.
3 prerequisites for implementing big data analytics
Three prerequisites must be in place for an organization to derive value from big data analytics. Miss any of them and the implementation that follows will underdeliver, no matter the tooling.
- A clear business case tied to specific decisions. A big data program without a business case burns budget without ever proving its worth. Anchor it to specific decisions the analytics will improve, then build a roadmap that ties each capability to a goal.
- Clean, accessible data across source systems. Data quality is foundational. Low-quality data undermines every downstream effort and erodes trust in the results. The risk is material: 63% of organizations either lack the right data management practices for AI or are unsure they have them.
- Skilled people to build and maintain the analytics pipeline. Pipelines need data engineers to build the architecture, data scientists to model, and analysts to consume the output, plus people with real business and industry knowledge to frame the questions.
With these prerequisites in place, the implementation has a foundation to stand on. Without them, tooling won't save the program.
How to implement big data analytics
Implementing big data analytics starts with the questions the program must answer, followed by the infrastructure and pipelines to collect, store, and process the right data.
Define the business questions the program needs to answer
Clarify objectives before any technical work begins. Start with the organization's mission and goals, determine where data and analytics move those goals, then prioritize the specific decisions the program will support. A useful strategy is to pull in upper management, business analytics, and IT, so the questions reflect what the business actually needs to decide, not what the data happens to allow.
Build the infrastructure to collect, store, and process data at scale
A practical implementation maps to three core layers:
- An ingestion layer that ingests batch and streaming data over multiple protocols.
- A storage layer that serves as a secure, durable repository.
- A processing layer that validates, cleans, normalizes, and enriches data into a consumable state.
Underneath all three, scalable storage, distributed compute, and security controls, including encryption and access management, form the foundation the layers depend on.
Set up the pipelines that turn raw data into analysis-ready information
Build the pipelines in a practical sequence: define objectives and requirements, choose tools that fit your sources and scale, design the data flow at each stage, then develop and rigorously test.
Design for idempotency: rerunning a job after a failure should produce the same result as running it once, so retries can't create duplicate or corrupted data. Orchestration tools like Apache Airflow handle dependencies, and quality checks belong at every stage rather than only at the end.
How Sigma supports big data analytics
The analysis layer at the top of that stack needs to be accessible to many business users. Your warehouse can hold billions of rows, but many of the people who need answers don't write SQL. So they export to CSV, work off stale snapshots, and break governance controls the data team put in place.
Sigma is the big data analytics platform that runs agentic AI, applications, machine learning, and business-user-friendly analysis directly on your cloud data warehouse.
Live queries against warehouse-scale data
Formulas, filters, pivot tables, and sorts in Sigma compile to SQL and execute inside the connected warehouse. There's no in-memory engine, no extract, and no snapshot. While large files take a long time to load in traditional BI tools and spreadsheets, Sigma runs queries directly in cloud data warehouses rather than storing data in local files. This lets teams work with millions of rows without lag or performance issues.
Self-service analysis for business users and engineers alike
Sigma's interface is a spreadsheet, so anyone who can write a SUM formula can query a billion rows. It directly addresses the skills-scarcity prerequisite, since business teams self-serve rather than queue behind a small data team.
Governed access and writeback
Row-level and column-level security are inherited from the warehouse at query time, so there's no need to rebuild them in a separate model. Input Tables let users write results back to the warehouse with a record-level audit trail, so analysis closes into action: a forecast update, an approval, a status change in the same governed workspace.
Get started with big data analytics using Sigma
Big data analytics is worth the investment when live warehouse data, governed access, and action are all part of the same workflow. Sigma runs warehouse-native, so the dashboards, analyses, and AI Apps all inherit the governance your warehouse already enforces.
In practice: you can connect Sigma to your existing warehouse, such as Databricks, Snowflake, BigQuery, and Amazon Redshift, point it at the tables your team already trusts, and business users can query billions of rows through a spreadsheet interface without writing SQL.
The next step is to see how Sigma works on your own data at scale. Get a demo or try Sigma free.