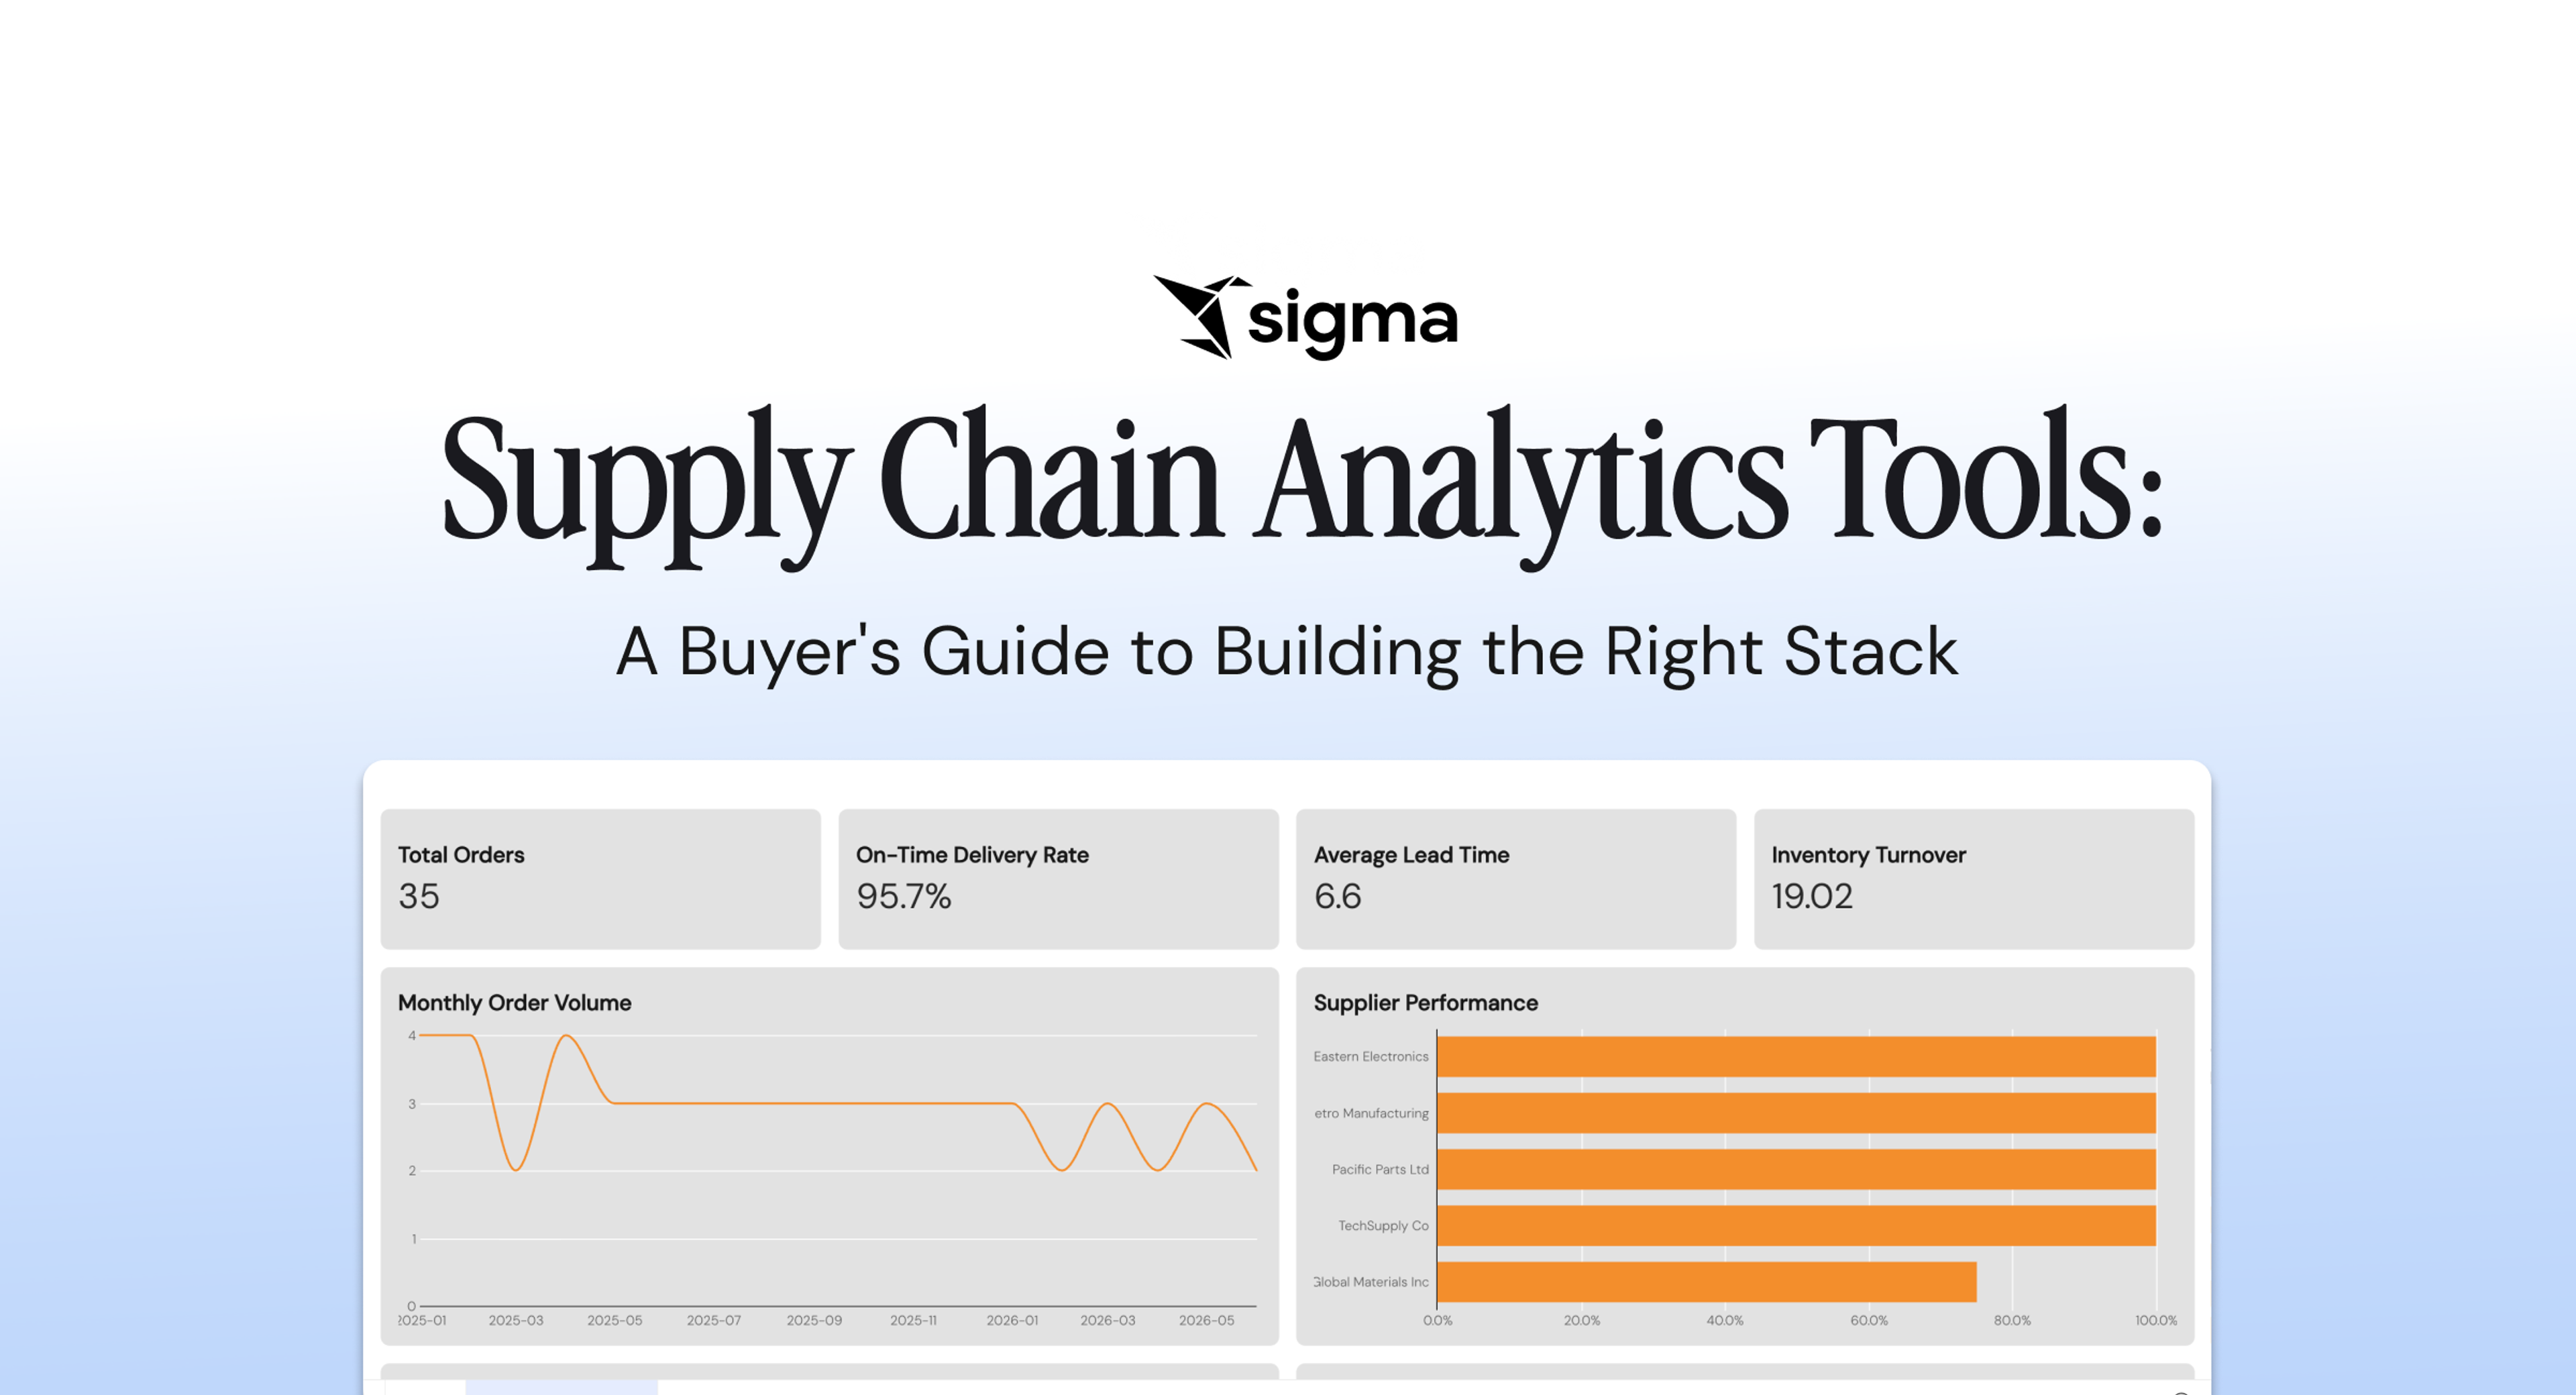
Supply Chain Analytics Tools: A Buyer’s Guide to Building the Right Stack

Supply chain analytics is a stack of capabilities (data, analysis, and action) that work together on top of a cloud data warehouse. Choosing the right tools means understanding what each layer does, what good looks like at each one, and which criteria show whether a platform can support live, governed planning workflows.
This guide walks through the four types of supply chain analytics tools, the three capability layers of the stack, the five criteria for scoring any platform, and the best practices that determine whether the stack delivers outcomes or just produces dashboards.
Key takeaways
- Supply chain analytics is a three-layer stack: data, analysis, and action, all running on top of your cloud data warehouse.
- Score every supply chain analytics tool against five non-negotiables: live warehouse queries, self-service for business users, native writeback to the warehouse with downstream routing, enforced governance, and AI that runs on governed warehouse data.
- Sigma occupies the analysis and action layers on the supply chain analytics stack. It runs live queries on your cloud data warehouse, lets planners write decisions back to governed warehouse tables, and runs AI on warehouse compute so outputs inherit your existing row-level security.
What is supply chain analytics?
Supply chain analytics is the practice of measuring and modeling the flow of goods, information, and money across the supply chain, from sourcing through production to last-mile delivery. It pulls data from ERP, warehouse management, transportation management, and supplier systems into one place, then uses that data to surface trends that sharpen operational decisions.
Supply chain analytics tools are the software that makes this possible at enterprise scale. They sit alongside the broader business intelligence (BI) stack but address the operational realities of supply chain work: live inventory positions, in-transit shipments, supplier performance, and dynamic demand signals.
The 4 types of supply chain analytics tools
Supply chain analytics tools fall into four categories based on the question they answer. Each builds on the last, and a mature stack includes tools that cover all four.
- Descriptive analytics tools answer “What happened?” They track KPIs like order fulfillment rates, inventory levels, and transportation costs. GPS and RFID feeds power track-and-trace dashboards for shipment visibility.
- Diagnostic analytics tools answer “Why did it happen?” They identify root causes behind performance shifts, such as a spike in shipping delays from a specific region or a recurring shortage tied to a single supplier.
- Predictive analytics tools answer “What will happen?” They use live data to forecast how variables such as inflation, weather, or shifts in demand will affect supply and demand.
- Prescriptive analytics tools answer “What should we do?” They recommend specific actions: reroute this shipment, reallocate inventory, switch suppliers. Prescriptive tools help teams manage disruption by translating scenario modeling into executable decisions.
Most organizations stall at descriptive analytics and never mature into predictive or prescriptive use cases. The blocker is often the underlying stack, which typically lacks the action layer planners need to write decisions back to source systems.
Benefits of supply chain analytics tools
The right supply chain analytics tools deliver three outcomes the business usually lacks: a clear view of what is happening across the chain, the ability to anticipate what is coming, and the resilience to absorb the shocks that arrive anyway.
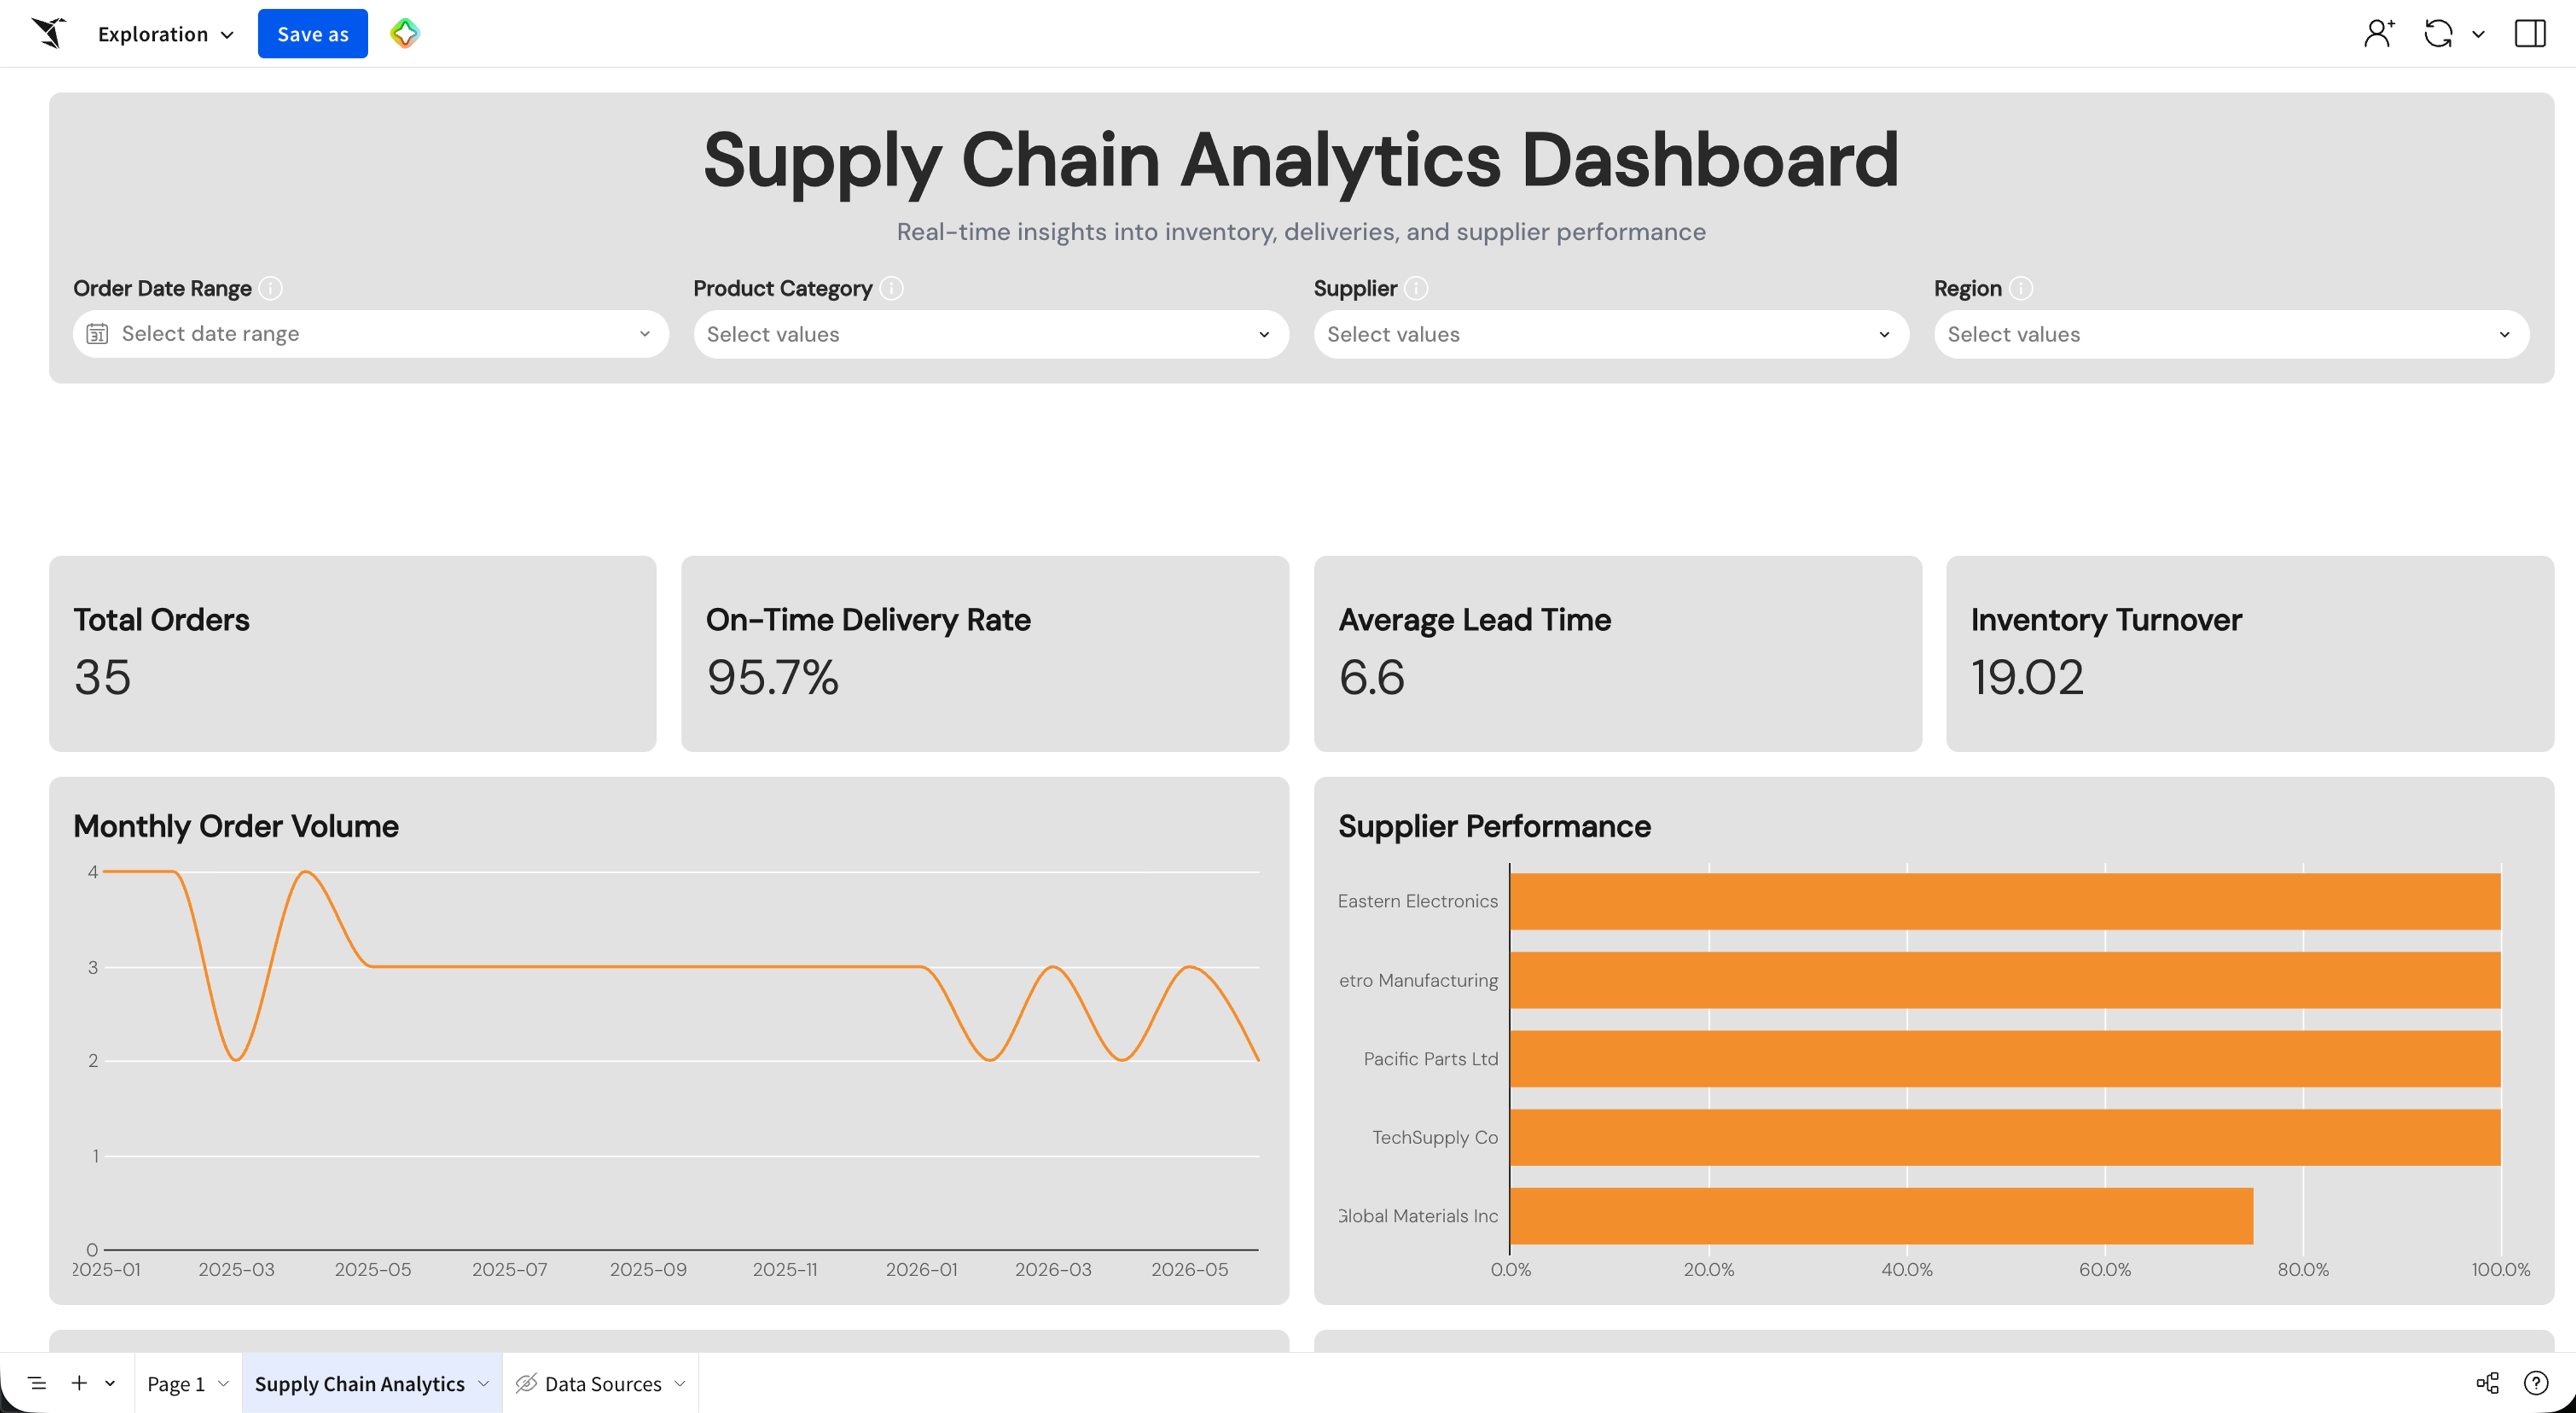
- Visibility. See sourcing, production, inbound logistics, inventory positions, and last-mile movement in one place, reconciled against the same warehouse data. Full Tier-1 supplier visibility reached 60% in 2024, leaving 40% of organizations without basic first-tier transparency and reconciling exports instead of acting on them.
- Forecasting. Anticipate disruptions and adjust plans while there is still time to act. AI ensemble models now provide two to four weeks of advance warning. Early adopters of AI-enabled supply chain management have achieved 15% lower logistics costs by routing freight, inventory, and labor against those forecasts.
- Resilience. Surface alternate suppliers, model substitutions, and re-route inventory so the business keeps moving when a single node fails. AI implementation in supply chains drives a 10% to 20% reduction in manufacturing, warehousing, and distribution costs, much of it from running scenarios on live data instead of reacting after the fact.
The 3 capability layers of a supply chain analytics stack
A working supply chain analytics stack spans three capability layers. Each plays a distinct role, and a weakness in any layer breaks the workflow that runs through all three.
The data layer
The data layer brings supply chain data together in one place. ERP, WMS, and TMS systems often come from different vendors and use different data models, so the data team has to ingest, clean, and join raw data before any analysis is possible. The data layer typically includes:
- A cloud data warehouse or lakehouse (e.g., Databricks, Snowflake, BigQuery, Amazon Redshift) serves as the central store.
- Streaming ingestion, ELT pipelines, and API integration move data from source systems into the warehouse.
- Middleware routes and transforms data between systems.
- Data modeling tools define reusable metrics such as fill rate, on-time delivery, and inventory turns.
A well-built data layer provides every downstream tool with a single, consistent place to query current supply chain data. Without it, every analysis starts with reconciling exports.
The analysis layer
The analysis layer turns centralized data into insight. It can include business intelligence and dashboarding, SQL and Python analytics, ML model training and inference, and natural language querying. In many organizations, legacy business intelligence stops here. It produces charts, but execution still happens in other systems. A planner can see that fill rates are slipping in EMEA, model three reallocation options, and pick the best one, but still has to email a colleague to make the change in the WMS.
The action layer
The action layer converts insight into decisions that get executed. It often gets the least attention in supply chain analytics stacks, yet it determines whether analytics changes outcomes. Capabilities at this layer include:
- Threshold-based alerts notify operators when KPIs breach limits.
- Workflow triggers kick off downstream processes.
- Writeback captures approved decisions in governed warehouse tables, which downstream actions and integrations then route into ERP, WMS, or TMS workflows.
- Agentic workflows handle routine decisions on the planner’s behalf.
Together, these capabilities turn the analysis layer’s output into actual operational change: a reallocation that hits the WMS, a supplier swap that updates the ERP, an alert that triggers a corrective action before the next shift starts.
5 criteria for choosing the right supply chain analytics platform
A supply chain analytics platform earns its place by moving decisions from question to execution on live, governed data. The data layer is mostly a warehouse decision you have already made, so the five criteria below focus on the analysis and action layers that complete the stack.
1. Live data
A supply chain analytics platform is only as current as the data it queries. The moment a tool relies on scheduled extracts, planners are working off snapshots that no longer reflect what is on the dock or in transit, and the reroute window closes before the next refresh lands.
The platform should query the cloud data warehouse directly, on demand, and return results that match what an engineer running the same SQL would see. Anything that materializes a separate copy adds latency, drift, and a second governance surface to maintain.
2. Self-service for business users
The planners closest to the problem are rarely the ones who can write the SQL to answer it. When every new question requires a ticket to data engineering, the analytics layer becomes a queue, and that queue is the bottleneck the rest of the stack cannot overcome.
The platform should let a business user ask and answer their own questions without compromising the governance the data team configured. Spreadsheet-like interfaces and natural language querying do that work when they sit on top of the warehouse’s metric definitions and security model, rather than around them.
3. Writeback and action
A platform that produces insight but cannot record a decision forces a manual handoff between analysis and operations. Every handoff adds latency, introduces error, and breaks the audit trail.
Check whether approved decisions can be captured directly inside the analytics interface, written back to governed warehouse tables, and routed into ERP, WMS, or TMS through actions, integrations, or existing downstream pipelines.
4. Built-in governance
Governance applied at the dashboard level after rollout won’t always hold. Self-service surfaces, AI interfaces, and writeback workflows each require the same rules to be enforced consistently. When governance is bolted on per surface, the gaps show up faster than the security team can close them.
Check whether the platform inherits the warehouse’s permissions model at query time, applies row- and column-level security uniformly across all interfaces, and logs access and modifications in an audit trail that compliance can actually use.
5. Native AI on governed data
AI features that operate on a separate copy of enterprise data sit outside the security model that protects the rest of the stack. Row-level security doesn’t follow the data into the model, audit trails don’t capture what the model generated, and prompt-driven access creates a surface no one has fully scoped.
Evaluate whether AI runs inside the same governed environment as the broader analytics platform, using the warehouse’s own compute and inheriting the same row-level security, audit, and permissions controls.
Best practices for building a supply chain analytics stack
Choosing tools only pays off when the implementation makes each layer reinforce the others. The teams that win make the same handful of decisions early and avoid the same handful of mistakes.
- Start with the warehouse, not the dashboard. Centralize ERP, WMS, TMS, and supplier data in your cloud data warehouse before you select the analysis layer. The warehouse is the foundation on which every other decision rests.
- Define metrics once and reuse them everywhere. Define fill rate, on-time-in-full, inventory turn, and forecast accuracy in one place and let every downstream tool inherit them. That way, finance, planning, and operations report the same numbers for the same KPI.
- Design for writeback from day one. If the action layer is an afterthought, planners end up doing analysis in one tool and entering decisions in another. Pick analysis tools that write back to the warehouse natively and that integrate with the downstream systems that run operations.
- Don’t extract data into proprietary engines. Tools that pull warehouse data into their own in-memory layer break governance, introduce latency, and create another system of record to reconcile.
- Don’t let AI run on ungoverned copies of your data. A chat interface that points at a separate export doesn’t inherit row-level security and produces outputs no one can audit.
Consistency runs through all five points: warehouse, analytics, and action layers all referencing the same data, the same metrics, and the same permissions.
How Sigma fits into your supply chain analytics stack
Sigma is the runtime layer to build and scale analytics, AI Apps, and agents on live cloud data warehouse data. It sits between your cloud data warehouse and the AI tools generating against that data, turning the artifacts those tools produce into governed, auditable, production-ready software.
In a supply chain analytics stack, Sigma occupies the analysis and action layers on top of the warehouse you already run. It works alongside your ERP, WMS, TMS, and ingestion pipelines, with the warehouse as the connective tissue between analysis, governed writeback, and the operational systems that execute decisions.
Sigma is the analysis layer on live warehouse data
Sigma runs live queries against the supply chain data already in your cloud data warehouse, with no extracts or snapshots. Formulas, filters, and pivots compile to SQL and execute inside the warehouse, so a planner who can write a SUM formula can query inventory, logistics, and supplier data without filing a ticket or writing SQL.
Sigma closes the action layer with writeback
Input Tables let users edit data in the workbook UI and write changes directly back to the warehouse through INSERT and UPDATE operations. An inventory reallocation, a supplier status update, or a corrective action on a flagged shipment is captured inside the same workspace where the analysis ran, and Sigma logs every change in an audit trail.
Sigma has Actions and notifications that let planners chain submit-and-approve workflows together. An out-of-stock alert can trigger a reallocation modal, a status update, and an email to the affected warehouse manager without leaving Sigma. From there, the governed warehouse table serves as the handoff point: existing pipelines and integrations carry the approved decision into ERP, WMS, or TMS via the same processes IT already maintains.
Sigma Agents bring agentic workflows to supply chain operations
Sigma Agents are customized agentic workflows configured inside a workbook. A builder defines the agent’s instructions, the data it can read, and the actions it can run, and the agent inherits the running user’s permissions and warehouse row-level security.
In a supply chain context, an agent can summarize what changed in the forecast hierarchy ahead of a weekly S&OP meeting and flag which shipments moved into or out of the plan. It can also write recommended actions back to an Input Table for the planner to review. Agents support conversational, human-in-the-loop, and autonomous interaction patterns, including scheduled background runs that prepare the next morning’s review before anyone logs in.
Sigma inherits warehouse governance
Sigma inherits row-level and column-level security from the warehouse at query time, so a planner scoped to EMEA in the warehouse sees only EMEA data in Sigma, in Sigma Assistant, and in any Sigma Agent the planner calls. AI features run on the customer’s warehouse compute rather than a separate copy of the data, so the same controls that protect the rest of the stack also govern and trace AI-generated outputs.
Implement supply chain analytics with Sigma
Building a supply chain analytics stack means closing the loop from question to action without breaking governance, leaking data into spreadsheets, or stalling out at the dashboard.
Many teams already have a warehouse and a stack of dashboards, but they lack the layer that closes the loop in one governed environment. That layer is what lets a planner spot a fill-rate problem, model a fix on live data, capture the approved decision in a governed warehouse table, and route it to the systems that run operations. Sigma makes all that possible on the warehouse you already trust, with the security model you already enforce, and with an interface your business users already know.
Get a demo or try Sigma free to build your first supply chain workbook on live warehouse data.