What Is Supply Chain Analytics? Types, Use Cases and Benefits

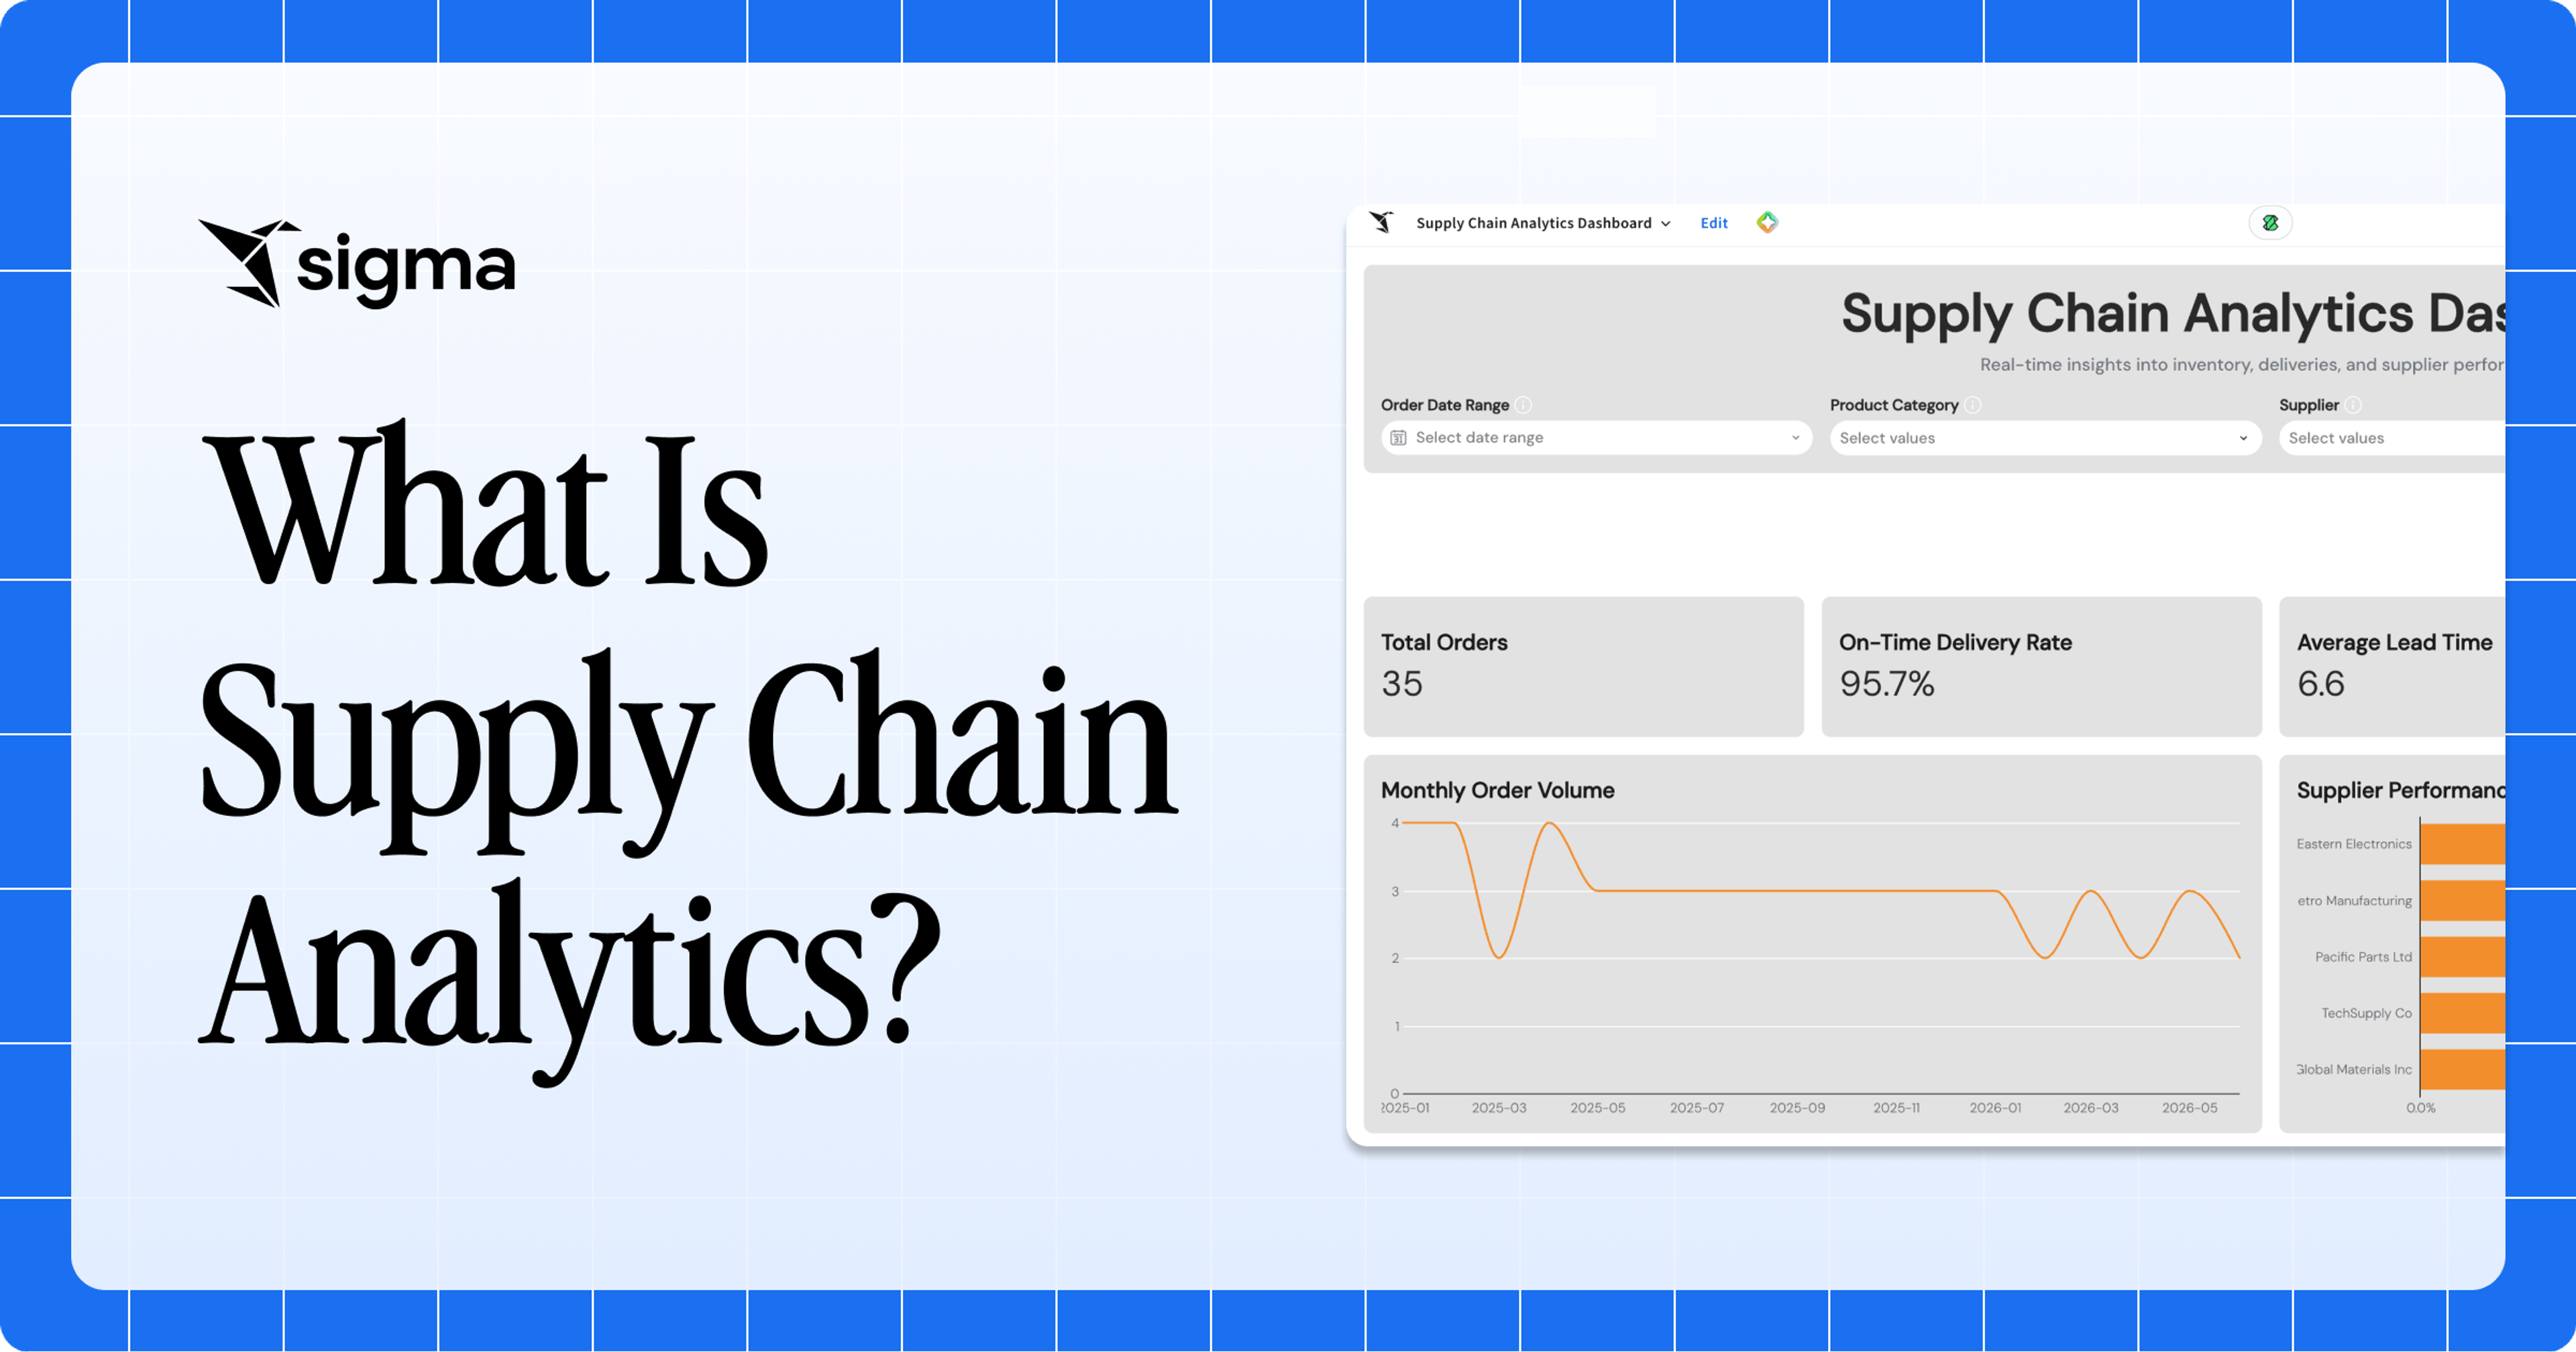
A typical enterprise supply chain generates data from many systems: ERPs, warehouse management platforms, transportation management tools, supplier portals, and point-of-sale feeds.
The data is there, but the shelves still go empty, the trucks still leave half-full, and the demand spike still surfaces in last week's report, after the stockout already happened. Supply chain analytics is the discipline that turns operational data into decisions in time to make a difference.
This article covers what supply chain analytics is, why it matters, how it works, which use cases deliver the most value, and how to put it into practice.
Key takeaways
- Supply chain analytics turns operational data into decisions that change what gets ordered, held, and shipped, taking analytics beyond static dashboards that only describe history.
- Effective supply chain analytics rests on three commitments: anchor every workstream to a specific operating decision, run that work on live, governed warehouse data, and close the loop so outcomes flow back into the next forecast, reorder, and reroute.
- Supply chain analytics programs succeed when they start from a specific decision, run on a single source of live, trusted operational data, reach the operators who act on it, and extend past the dashboard to writeback, alerts, and automated actions.
What is supply chain analytics?
Supply chain analytics is the practice of collecting, integrating, and analyzing data from across sourcing, production, inventory, and logistics to make better decisions about how goods move from supplier to customer.
Data only becomes valuable when it changes what a planner reorders, what a buyer negotiates, and where a logistics coordinator routes a shipment. Without that translation step, even the most instrumented supply chain ends up overstocked in one region, understocked in another, and slow to react when a supplier slips a delivery.
Supply chain analytics draws on demand signals, inventory positions, purchase orders, shipment tracking, supplier performance records, and external variables like weather and market trends. The work connects those data sources and puts the resulting analysis in front of the people and systems that control the chain, while conditions still reflect what is happening on the ground.
High-value use cases for supply chain analytics
A handful of applications return value quickly because they change day-to-day operating decisions directly:
- Demand forecasting. Anticipating spikes, seasonal swings, and shifts in customer behavior so the right inventory is in the right place before demand lands.
- Inventory optimization. Balancing service levels against carrying costs across locations and SKUs, so capital is not locked up in safety stock that will never sell.
- Supplier and logistics risk monitoring. Connecting operational signals (lead times, defect rates, lane reliability) to the financial impact of a disruption before it propagates.
- Route and logistics optimization. Cutting transportation costs and improving fulfillment speed by routing freight through the most efficient combination of land, air, and sea.
Each of these maps to a daily decision that a planner, buyer, or logistics lead already owns, which is why the returns compound: a sharper forecast lowers inventory, which in turn enables better supplier negotiations, which in turn reinforces network decisions downstream.
4 types of supply chain analytics
Supply chain analytics spans four types that build on one another, moving from explaining what already happened in the chain to recommending and automating what to do next.
Descriptive analytics
Descriptive analytics in the supply chain answers "what happened?" by detailing historical activity through aggregates, averages, and KPIs such as on-time delivery rates, inventory turns, supplier lead times, and fill rates. The same descriptive layer can extend beyond shipment tracking. A shared analytics platform improved visibility and decision-making across planning, procurement, manufacturing, and logistics.
Diagnostic analytics
Diagnostic analytics in the supply chain answers "why did it happen?" by moving from "this happened" to "here is why" through drill-down analysis, correlation, and root-cause identification on sourcing, inventory, and logistics data. When fill rates drop on a specific lane, diagnostic analysis correlates carrier performance, weather events, and warehouse throughput to surface the actual cause rather than the symptom. The same approach applies to supplier defects, late shipments, and demand variance, where the value comes from explaining the pattern, not just flagging it.
Predictive analytics
Predictive analytics in the supply chain answers "what is likely to happen next?" by using machine learning, statistical models, and simulations to forecast future conditions across demand, supply, and logistics. The inputs typically combine internal history (sales, shipments, supplier performance) with external signals (weather, promotions, macro trends) to project demand at the SKU level, anticipate lead time variability, and flag the parts of the network most likely to come under stress.
Prescriptive analytics
Prescriptive analytics in the supply chain answers "what should we do about it?" by evaluating constraints, trade-offs, and available choices to recommend specific actions on inventory, sourcing, routing, and fulfillment.
Prescriptive analytics lets companies run what-if simulations on current data, direct inventory allocation decisions to the highest-margin markets, and adjust pricing or promotion strategies before overstocks become write-downs.
Best practices for supply chain analytics
A supply chain analytics program succeeds when there’s clarity on what problem to solve, what data to trust, who gets to act on the output, and how much investment goes into the foundation.
- Start from the decision you want to improve, then work back to the data. Anchor every workstream to a specific operational decision such as a reorder point, an allocation choice, or a supplier scorecard threshold.
- Build on one source of live operational data. Consolidate on a single governed layer, typically the cloud data warehouse, so all the teams involved work from the same view of inventory, demand, and supplier performance.
- Put the analysis in the hands of the people who act on it. You can shorten the time between insight and action by integrating analytics into the interfaces operators already use, and enabling them to filter, model scenarios, and write decisions back into the system.
- Invest in data quality before scaling. Analytics is only as reliable as the data beneath it, and a trust deficit at the source limits planners' willingness to act on model insights.
- Treat the dashboard as the start of the workflow, not the end. A dashboard shows what happened; it does not trigger a reorder, adjust an allocation, or notify a supplier. Effective programs extend past visualization to writeback, automated alerts, and agent-driven actions, so the chart kicks off the decision rather than closing out the report.
The best practices are often interwoven. A decision-anchored program is easier to build on a single data layer; live operational data makes self-serve analysis trustworthy for the planners using it; data quality enables writeback and automation to run without supervision.
How Sigma powers supply chain analytics
Sigma is the runtime layer for building and scaling analytics, apps, and agents on live cloud data warehouse data. Instead of moving data into a separate platform, Sigma queries Databricks, Snowflake, BigQuery, and Amazon Redshift in place, compiling every formula, filter, and pivot to SQL that runs inside the warehouse.
For supply chain analytics, Sigma’s architecture ensures that the data planners, buyers, and logistics coordinators already live in the warehouse.
Live queries on warehouse data keep forecasts and inventory views current
Supply chain decisions degrade fast when the underlying data is stale. Sigma reads from the warehouse without extracts to ensure that inventory positions, open POs, and demand forecasts reflect the current state of the warehouse data.
A planner reviewing a reorder threshold sees the same number as a buyer on a supplier scorecard and as a logistics lead on a shipment tracker. Sigma also supports materialization workflows when reusable metrics or optimized warehouse-backed views are needed.
A familiar spreadsheet interface for the planners who make these decisions
Supply chain planners spend a lot of their time in spreadsheets. Excel is the operating system of demand planning, S&OP, and replenishment. Sigma's interface replicates the visual and behavioral patterns of Excel, including formulas, pivot tables, and cell references, while compiling directly to warehouse SQL.
Planners can analyze billions of rows of live supply chain data, covering every SKU, every lane, and every supplier, without writing a line of code or waiting on a data team ticket. That is what makes self-serve supply chain analytics viable at scale.
Writeback that turns analysis into recorded decisions and what-if scenarios
Supply chain analytics is only useful when teams capture the decisions it informs. Sigma's Input Tables let planners enter and edit data in the workbook and write that data back to the warehouse alongside the original dataset. A planner adjusting safety stock levels, a buyer updating a supplier scorecard, and an ops lead approving a reorder all leave their changes in an audit trail. What-if scenarios, such as a 15% demand spike, a supplier outage, or a port closure, run on the same live data and write results back so teams can compare scenarios and review the chosen path later.
Sigma Agents and Sigma Assistant for analysis, workflows, and action
Supply chains generate too many signals for any planning team to review by hand. Sigma uses AI to help absorb that volume on two fronts.
Sigma Agents are configurable AI agents that builders create inside a specific workbook with selected context, instructions, data sources, and configured actions. A builder can configure workflows or agent-assisted actions around threshold breaches, such as a stockout risk on a high-velocity SKU, a supplier defect rate climbing beyond tolerance, or a lane consistently running late. The agent can then write results back through configured actions and send governed notifications, all under the same row-level security the warehouse enforces.
Sigma Assistant complements those configured workflows with on-demand analysis: a planner can ask a question in natural language, get a chart or pivot built against live warehouse data, and pull the answer into a workbook to share with the rest of the team. Together, they support configured operational workflows and the ad hoc investigation that supply chain operations require.
Implement supply chain analytics today with Sigma
Supply chain analytics only creates value when the people closest to the decisions can access the data, interpret it, and act on it without switching tools or waiting in a queue.
Sigma supports warehouse-native queries, a spreadsheet interface planners already know, writeback that closes the loop between analysis and action, and Sigma Agents and Sigma Assistant that keep the operation responsive. Your warehouse remains the engine while Sigma is the interface.
Get a demo or try Sigma free to see how your supply chain team can move from data to decisions on live warehouse data.