Data Storytelling with AI: How Modern Teams Turn Live Data into Decisions

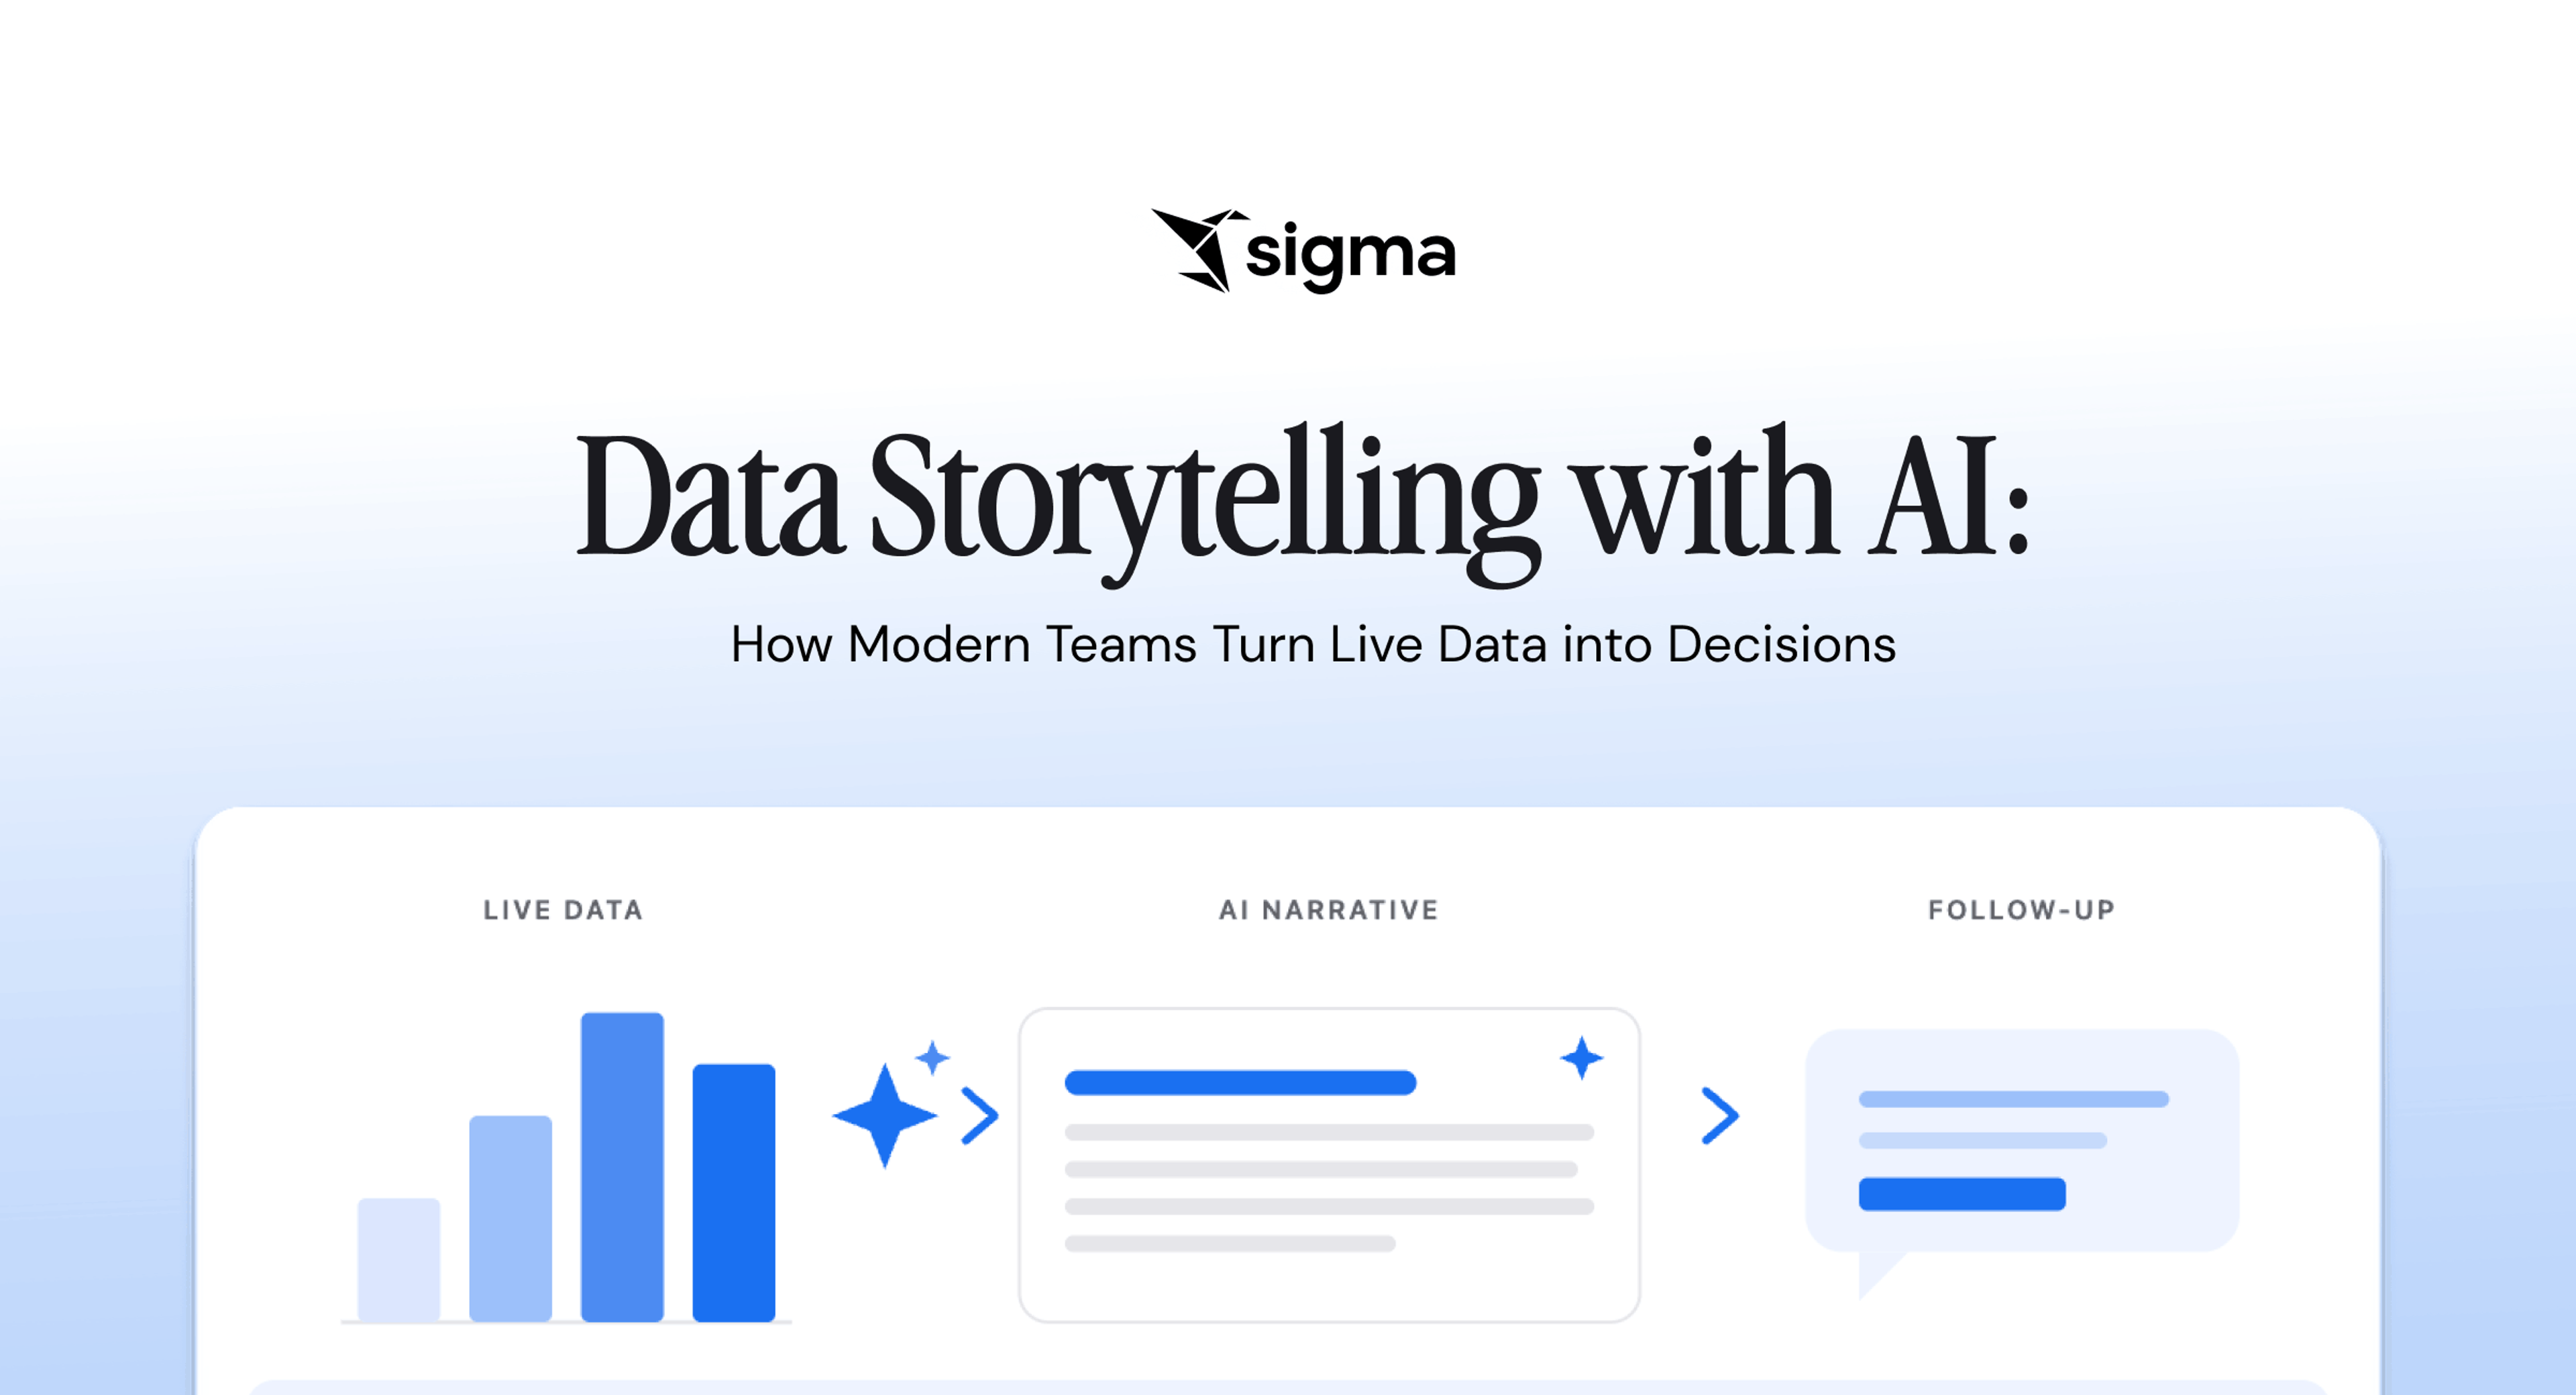
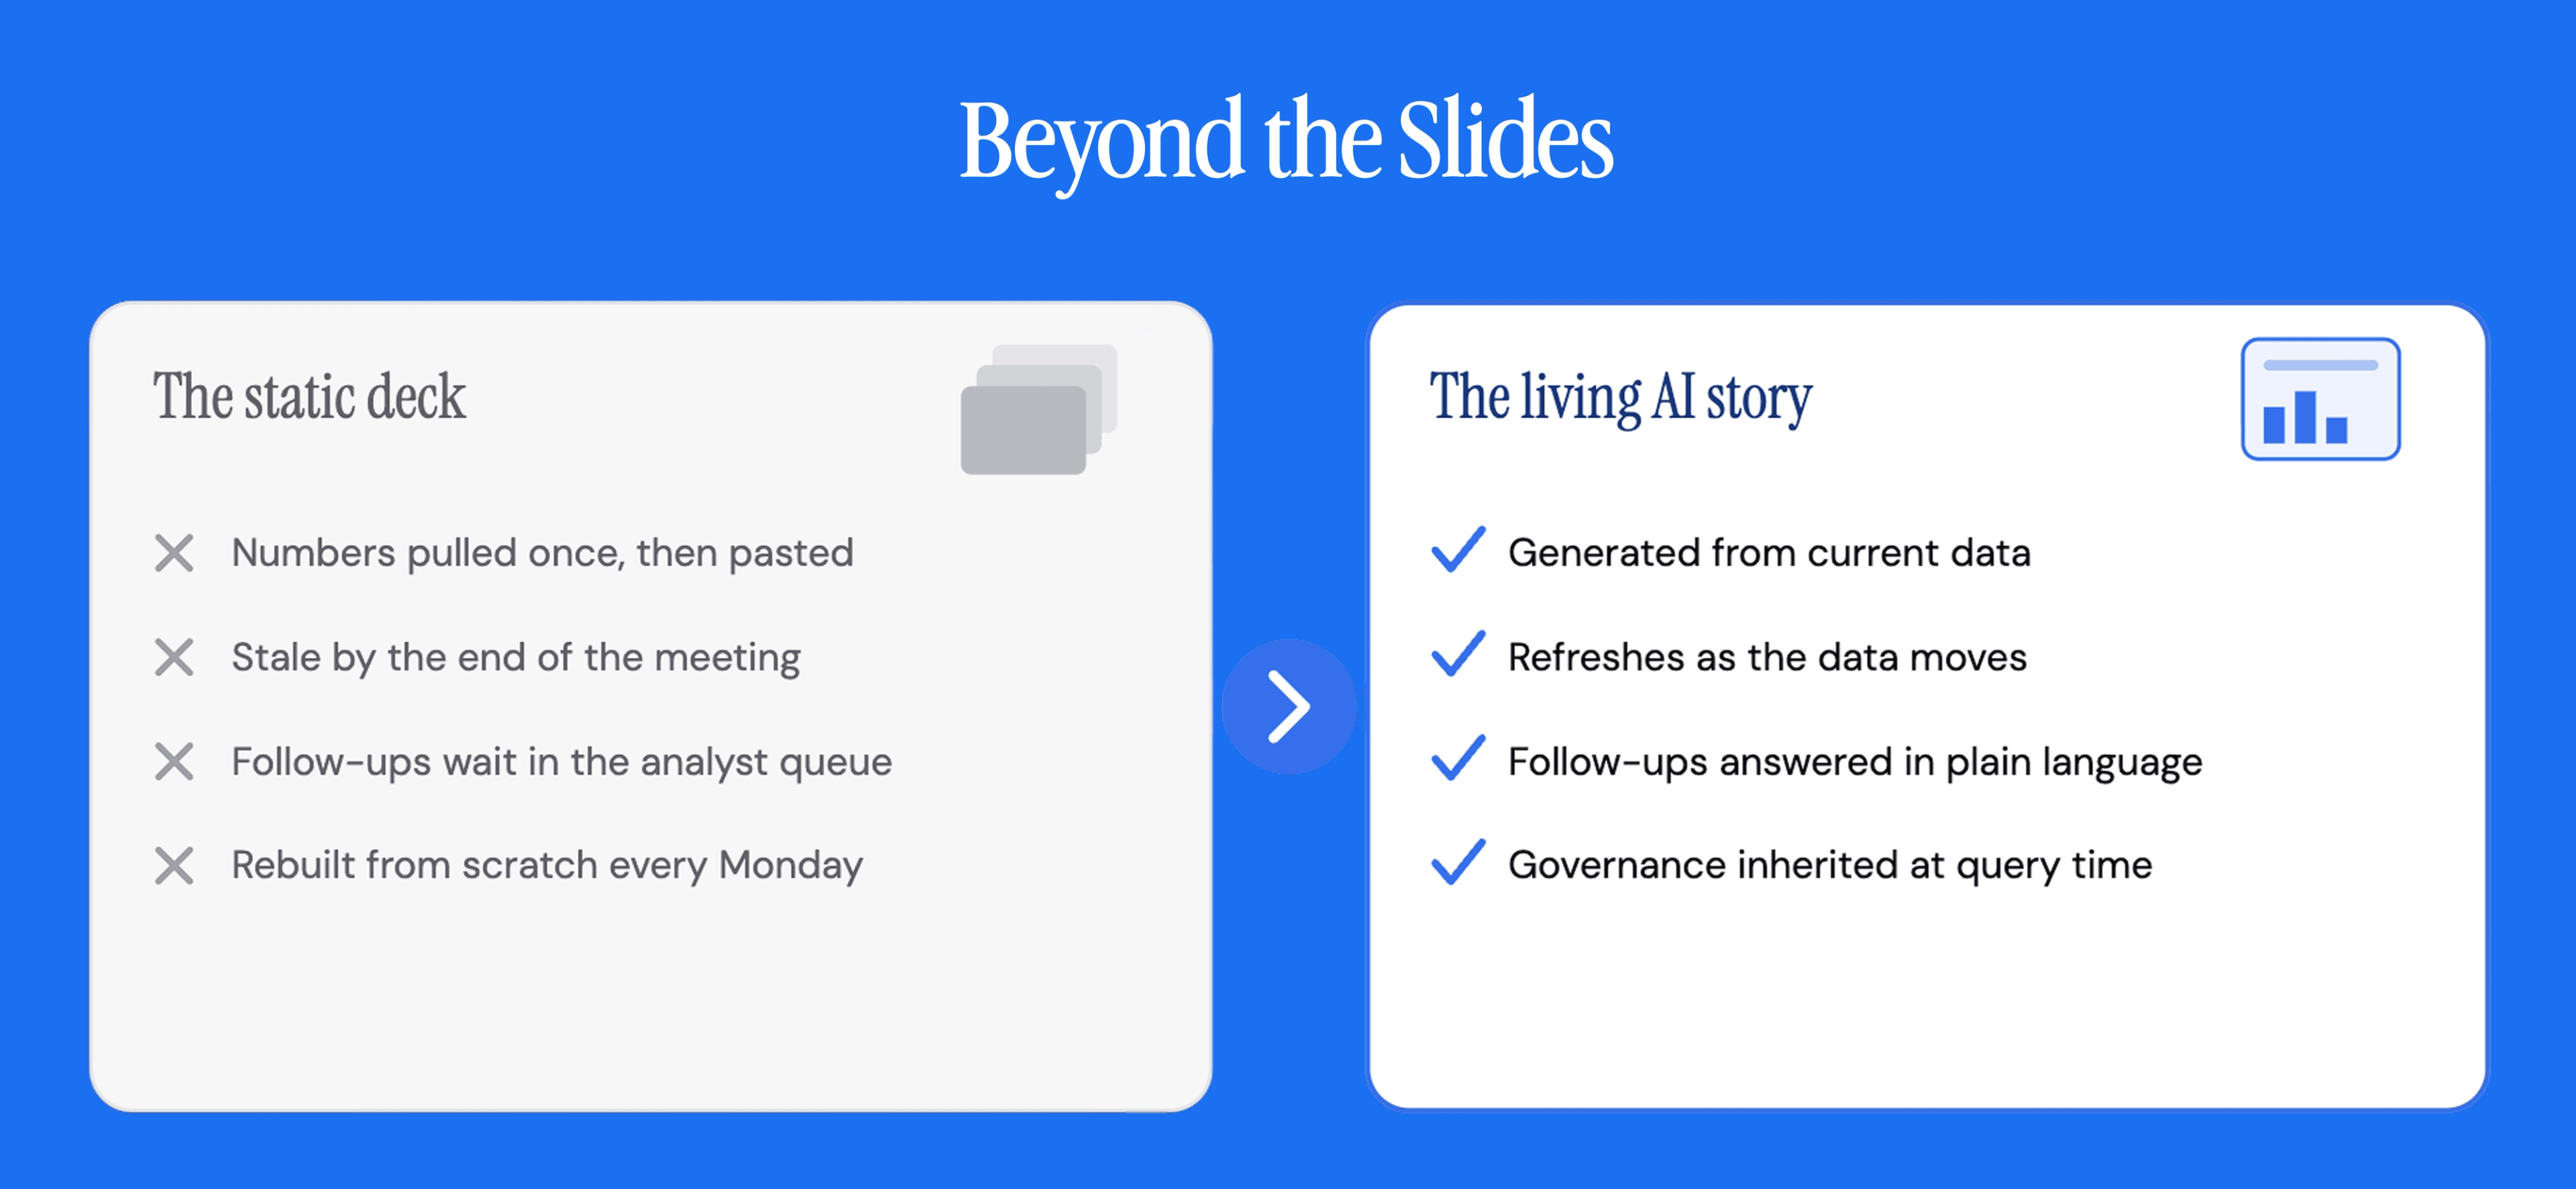
Data storytelling used to mean a static artifact. Someone pulled numbers, built a deck, wrote commentary, and shipped it. In many cases, the story the data was supposed to tell becomes stale by the time the meeting ends. AI grounded in live warehouse data changes that. The team generates the story from current data; the narrative refreshes as the data changes, and the reader asks follow-up questions directly rather than filing a ticket.
Key takeaways
- AI, grounded in live warehouse data, replaces static reports with living stories. Instead of rebuilding decks from stale exports, the narrative refreshes automatically as the data moves.
- Readers can ask follow-up questions in plain language and receive clear answers, so the analyst queue no longer becomes a bottleneck.
- The data model matters more than the AI model. A governed semantic layer with consistent definitions is what keeps the narrative accurate.
What is data storytelling with AI?
Data storytelling with AI is the practice of using AI to generate narrative, visuals, and recommendations from live data so the story stays current and the reader can question it directly. The AI reads the current numbers, writes the explanation, and answers the follow-up. The reader gets a story that reflects what is true right now, rather than what was true when the analyst last exported a CSV.
The difference between data storytelling with AI and traditional data storytelling is structural. With AI, the narrative, the visuals, and the underlying figures all trace back to the same governed source, so the story can't drift from the truth the way a spreadsheet or a static dashboard does.
Two shifts make this possible now:
- Cloud data warehouses put every dimension of the business in one governed place.
- AI can read that data and produce a narrative that reads as if an analyst wrote it.
The stack finally supports a data story that is both current and interrogable, and the teams that adopt this approach stop rebuilding the same reports every week.
How data storytelling with AI works
The workflow runs as a four-stage loop: live query against the warehouse, AI-drafted narrative, reader follow-up in plain language, and action taken on the insight. Each stage inherits from the one before it, so getting the earlier stages right determines how trustworthy the later ones become.
It starts with a live connection to the warehouse
The live connection is what keeps the story current and governed. The AI model works from the same tables the rest of the business runs on, with row-level security and column-level security applied at query time. When asked to summarize what happened in a metric, it issues a governed query against those tables, gets the current numbers, and reasons from them. The same access controls that protect the warehouse protect the model's queries, so the AI can't see anything the reader isn't permitted to see.
The AI drafts the narrative from that data
From the queried data, the AI writes the explanation. It names what changed, quantifies the change, and identifies the drivers behind it. Revenue takes the definition finance already agreed on, drawn from the semantic layer rather than inferred from column headers. The result renders alongside the charts and tables that show the same numbers visually. The reader sees the pattern and the explanation in one place, and the visuals and the narrative stay in sync.
The reader asks the follow-up in plain language
The reader asks a plain-language question, the platform runs a governed query behind the scenes, and the current answer comes back. If the reader wants to know why the West region missed, the query runs under that user's permissions and returns an answer scoped to what they are allowed to see. The story becomes a surface for the reader to interrogate rather than an artifact they receive.
The loop closes when action follows the insight
Mature stories connect to writeback or workflow so the reader can log a decision, adjust an assumption, or trigger a notification without leaving the story. The same view can update a forecast, explain the variance, and record an approval next to the number that triggered it. Teams that use AI to run the business connect the narrative to the next action.
5 prerequisites for data storytelling with AI
Five components make up the minimum viable stack: a live warehouse connection, a governed semantic layer, a narrative generation surface, a conversational interface, and inherited governance. Miss any single one and the story drifts from the source of truth, stops refreshing, or exposes data it should not.
- A live connection to the cloud data warehouse. The story reads current data on every refresh, with no extracts or snapshots in between.
- A governed semantic layer or data model. Certified metrics, defined joins, and consistent definitions so the AI reasons from the same logic the business already uses.
- A narrative generation surface. The AI capability that writes commentary, explains variances, and drafts recommendations from the current data.
- A conversational interface. The path for the reader to ask follow-up questions in plain language and get governed answers back.
- Inherited governance. Row-level security, column masking, and audit logging that hold at query time, so AI-generated answers never expose data the reader isn't allowed to see.
One runtime layer should carry all five capabilities. It reads live data, applies governed definitions, generates narrative, accepts follow-up questions, and enforces permissions at every step. Teams that try to assemble this from disconnected tools end up with a semantic layer in one system, a narrative generator in another, and governance replicated in a third.
How to implement data storytelling with AI
Implementation runs in five steps: ground the story in live warehouse data, build the semantic layer, define the audience and the question, generate the narrative and enable follow-up, and keep a human in the loop.
1. Ground the story in live warehouse data
Point the AI directly at the cloud data warehouse. Avoid exports, cached extracts, and copies sitting in an intermediate business intelligence engine. Every sentence the AI writes should be traceable to a query it just ran, and every follow-up should hit the same governed tables that produced the original narrative.
2. Build the semantic layer
Certified metrics, endorsed data models, and consistent definitions keep the AI output consistent. Without them, four different questions about revenue produce four different numbers, and the reader has no way to tell which one to trust. The semantic layer is where the business encodes the logic that revenue means net of returns, that active customers exclude churned accounts, that the fiscal year starts in February. When the AI reasons from that layer instead of raw tables, the narrative uses the same definitions as the board deck, the finance close, and the operations review. The quality of the data model is the operative variable in AI-driven storytelling; the choice of AI model matters far less.
3. Define the audience and the question
Decide who the story is for, what decision it supports, and what level of detail belongs in the narrative before you prompt the AI to generate anything. A finance leader in a forecast review and a store manager reading the same sales data need different framing. The finance leader wants variance drivers and a revised outlook. The store manager wants to know which SKUs to restock and which ones to mark down. Get the framing right, and the output stays specific to the reader rather than generic about the data.
4. Generate the narrative and enable follow-up
Have the AI draft what happened, why the metric moved, and what to investigate first, grounded in the queried data. Keep the narrative tight and specific, and if the AI can't ground a claim, it shouldn't make it. Then give the reader a way to interrogate that narrative in plain language, with each follow-up running a fresh governed query rather than re-summarizing the paragraph the reader already saw. Most of the productivity gain lives here: the reader answers their own next question instead of filing a ticket.
5. Keep a human in the loop
AI drafts the narrative, and a named person signs off. Someone identifiable has to verify the story against the source before it reaches a decision-maker, especially for narratives that inform meaningful commitments like forecasts, hiring plans, or capital allocation. The reviewer's job is to check that what the AI wrote matches what the data actually shows, and to be reachable if a downstream question ever comes up.
Best practices for data storytelling with AI
Five disciplines keep AI narratives trustworthy in production: ground every claim, inherit governance from the warehouse, make every answer inspectable, review before publishing, and retire stale exports as they surface.
- Never let the AI narrate ungrounded. If it can't verify a claim against the data, it shouldn't make the claim. Ungrounded AI is confident prose about numbers it never checked, and that is worse than no narrative at all.
- Inherit governance from the warehouse. Row-level security and column-level security must hold at query time, regardless of who or what is asking. Avoid building a parallel permissions model for the AI.
- Make every answer inspectable. The reader should be able to see the query the AI ran, trace it to the underlying table, and audit the reasoning. If the answer can't be inspected, it can't be trusted.
- Treat hallucination as inevitable, not hypothetical. Named human review before publication is the control that keeps it out of production.
- Retire stale exports as they surface. Every CSV a team still emails around is a place the governed story has not reached yet. Track them and replace them.
The AI has to operate as a permissioned reader of a governed source. Everything else is downstream of that.
How Sigma supports data storytelling with AI
Sigma runs the entire loop on your cloud data warehouse: live query, AI-drafted narrative, reader follow-up, and action, with warehouse permissions inherited at every step. Sigma is the runtime layer between your warehouse and the AI generating content from that data, so every AI-generated narrative inherits the governance, audit, and lineage that the warehouse already enforces. The story, the numbers behind it, and the follow-up all run on the same governed source.
Sigma Assistant for narrative questions and answers
Sigma Assistant answers plain-language questions directly against governed data models. It draws on certified metrics and endorsed workbooks as context. Every answer is verifiable: inspect the query, trace it to the underlying table, and audit the analysis in a workbook. Row-level security and column masking remain intact, and queries are validated before they run, so the follow-up question the reader asks returns a governed answer rather than a plausible guess.
AI Column for row-by-row narrative generation
AI Column runs an LLM prompt against each row inside the spreadsheet grid. It produces per-row summaries, explanations, or classifications from current warehouse data. The commentary refreshes with the data because it is computed from it, and it remains governed by the same row-level security as every other column.
Sigma Agents for scheduled and conversational storytelling
Sigma Agents are configurable workflows that turn narrative generation into a durable capability. A builder defines the instructions, the data the agent can read, and the actions it can take. A scheduled agent can run before a Monday meeting, summarize what changed in the forecast over the weekend, and open the review with the story already written. Sigma Agents are configured within a workbook context and can support conversational, human-in-the-loop, and autonomous or scheduled interaction patterns where approved. A conversational agent can sit inside a workbook and answer follow-ups in context. Both inherit the running user's permissions, so the agent never surfaces data the caller can't see.
Pixel Perfect Reporting for audit-ready distribution
Some audiences need a formatted document. Pixel Perfect Reporting produces audit-ready paginated reports with PDF and image exports, export bursting, custom SMTP, and scheduled runs. Because it runs on the same live connection, the report reflects current numbers instead of last week's export.
Get started with data storytelling with Sigma
The choice is between a story your team rebuilds every Monday and one built once that automatically stays up to date. Teams that make this shift stop paying the weekly tax of assembling decks from stale exports and start operating from a single governed surface where the narrative, the numbers, and the follow-up all live together.
Sigma runs that story warehouse-native, so the governance the business already enforces on its data extends automatically to the AI generating against it. Every reader can carry an insight straight through to a decision without leaving the platform.
To see whether this approach fits your team, run it on your own data and questions. A short demo with your metrics or a free trial in your warehouse can help you see where manual reporting time is going.
Get a demo or try Sigma free and see it on your own data.