How Much is AI Costing Us? Get a Clear Breakdown in Sigma’s AI Cost Monitoring Templates


Last year, every conversation about AI started with, "What can we do with it?" This year it starts with, "Why are we spending so much on it?"
AI has moved from an experiment to a permanent line item, and for most teams it's one of the fastest-growing costs and one of the least understood. The invoice arrives every month, but the breakdown doesn't. Spend is scattered across model providers, the warehouse, and the platforms on top, and no single view ties it together.
Until now. Today, we're launching AI cost monitoring templates to help you assess AI spend across multiple AI platforms.
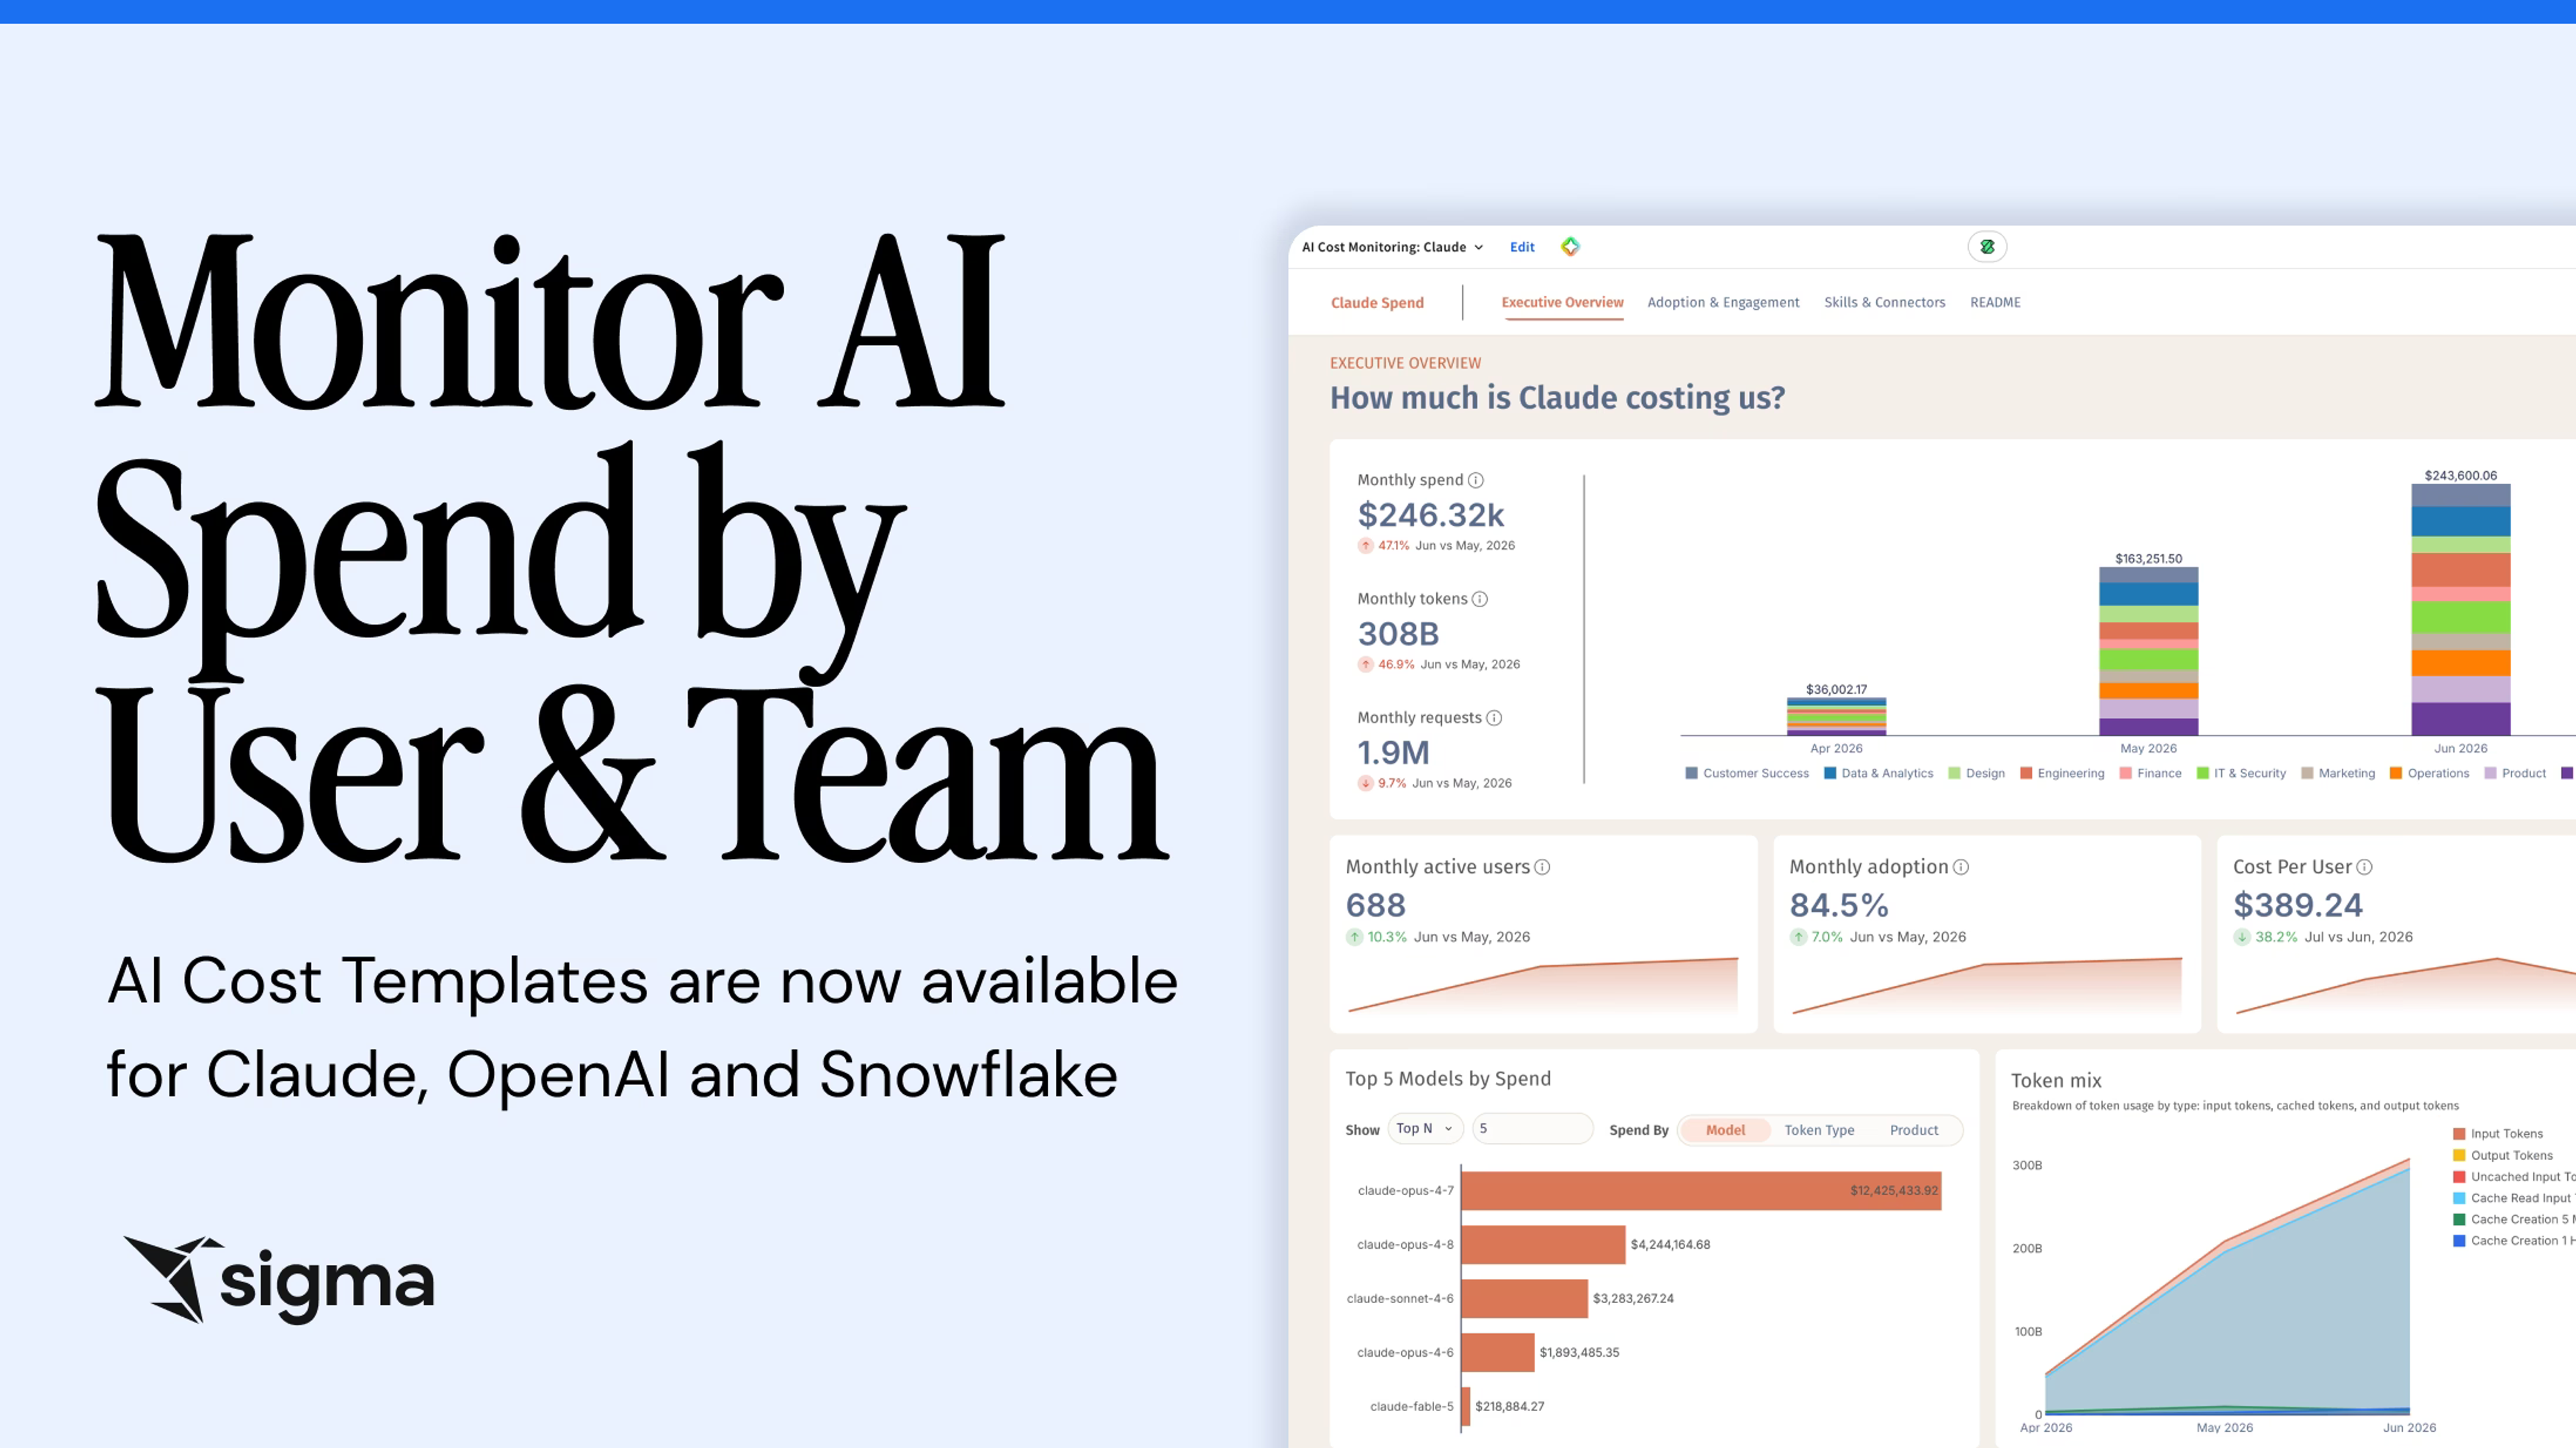
These templates are prebuilt Sigma dashboards that break down what your team spends across AI services, starting with:
- Claude Enterprise Spend Template
- OpenAI Consumption Spend Template
- Snowflake AI Functions Spend Template
The templates are available now for Sigma customers. Access them under “Templates” in your Sigma home screen to get started. (If you’re not a customer yet, request a demo to learn more about Sigma.)
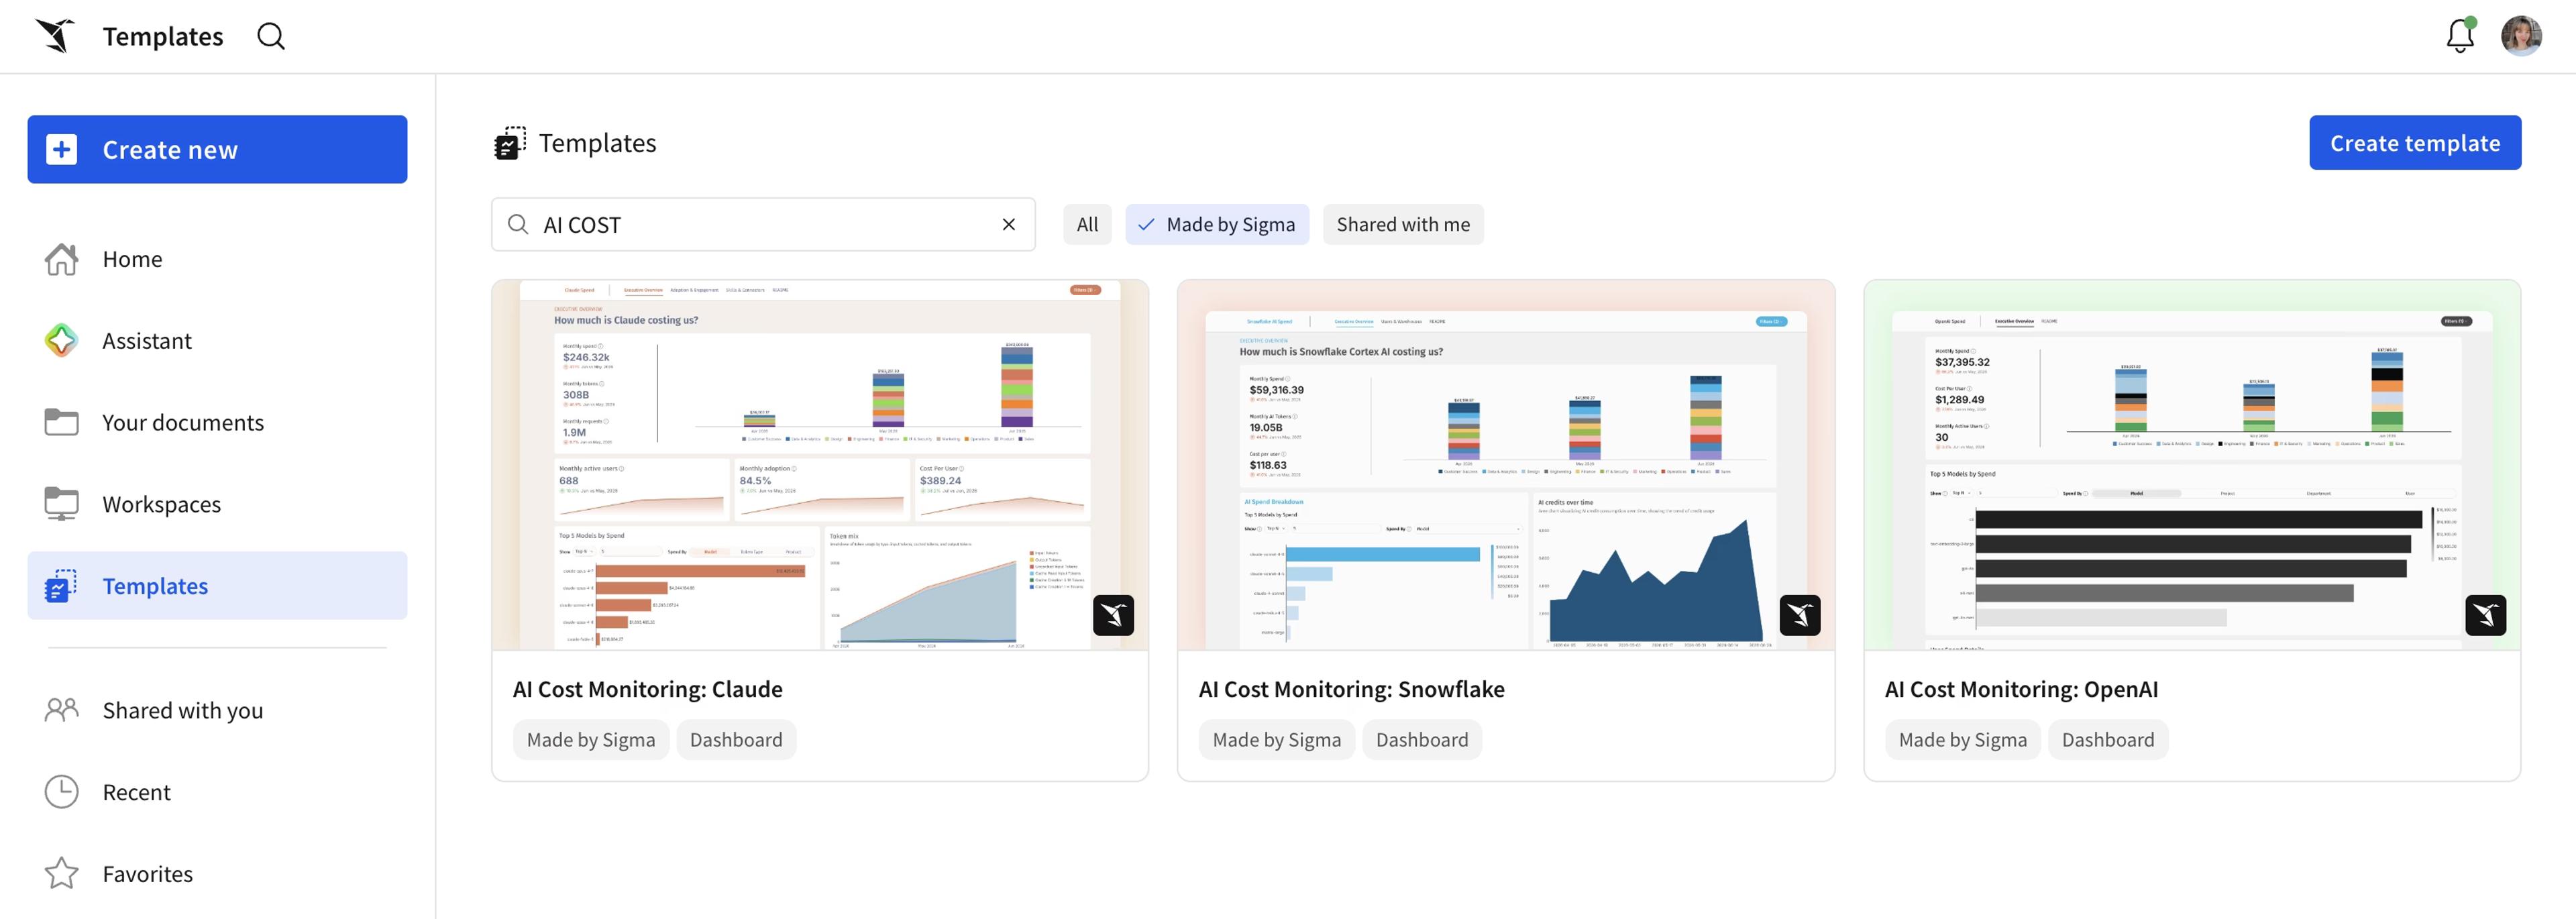
These AI cost monitoring templates join Sigma's native AI usage dashboard, which shows how AI is used inside Sigma itself. Together, both assets allow you to see AI spend by service, team, user, use case, and feature in one place, then judge whether that spend is driving value.
TL;DR: Every AI service reports spend in a different format, so Sigma's AI cost monitoring templates reconcile those exports — Claude, OpenAI, and Snowflake — into standardized dashboards in Sigma, and the AI usage dashboard shows how AI is used inside Sigma. You get spend broken down by service, team, and use case in a dashboard you can share, refresh, and build on, so you can tie cost to outcome instead of guessing.
Why is AI spend so hard to track?
Most teams can name their total AI bill but not what's driving it. The data usually exists, but it's fragmented: one service exports a token breakdown, another a credit summary, and a third just a final dollar amount, often as a raw JSON dump. That fragmentation makes it hard to map usage to business outcomes, and even harder to compare spend across platforms on equal terms.
The result is three blind spots. You can't see:
- Which use cases cost the most
- Which teams are driving the spend
- Whether that spend maps to real value
Every month an IT lead signs off on invoices without knowing which teams, features, or use cases created them. Data and business leaders are asked to prove the investment is paying off with no way to check whether users actually got useful answers. Finance watches the total rise and, without granular visibility, reaches for the bluntest lever available: across-the-board token limits and cost cuts that can kill high-value work alongside the wasteful kind. Left unmonitored, costs can also run away just as fast.
How can you see AI costs in a chart or table format?
Sigma's AI cost monitoring templates bring usage and cost from your key AI services into one picture, broken down in charts and tables. No two services report usage and cost the same way, so each gets its own template tuned to that service's export format. You follow the README to land the data in your warehouse and connect the template in a couple of clicks.
Each template opens as a working, plug-and-play workbook. If you already have departmental definitions in Sigma, the breakdown by team and cost center works out of the box. Here's how to set one up:
- Find a template. From the home page, open Templates and search for “Cost Monitoring,” “Claude,” “OpenAI,” or “Snowflake.”
- Land the usage data in your warehouse. Follow the README to get that service's spend data into your warehouse.
- Connect and swap. Connect the template to your data and swap the sample data for your own.
The AI Cost Monitoring Template for Claude Enterprise
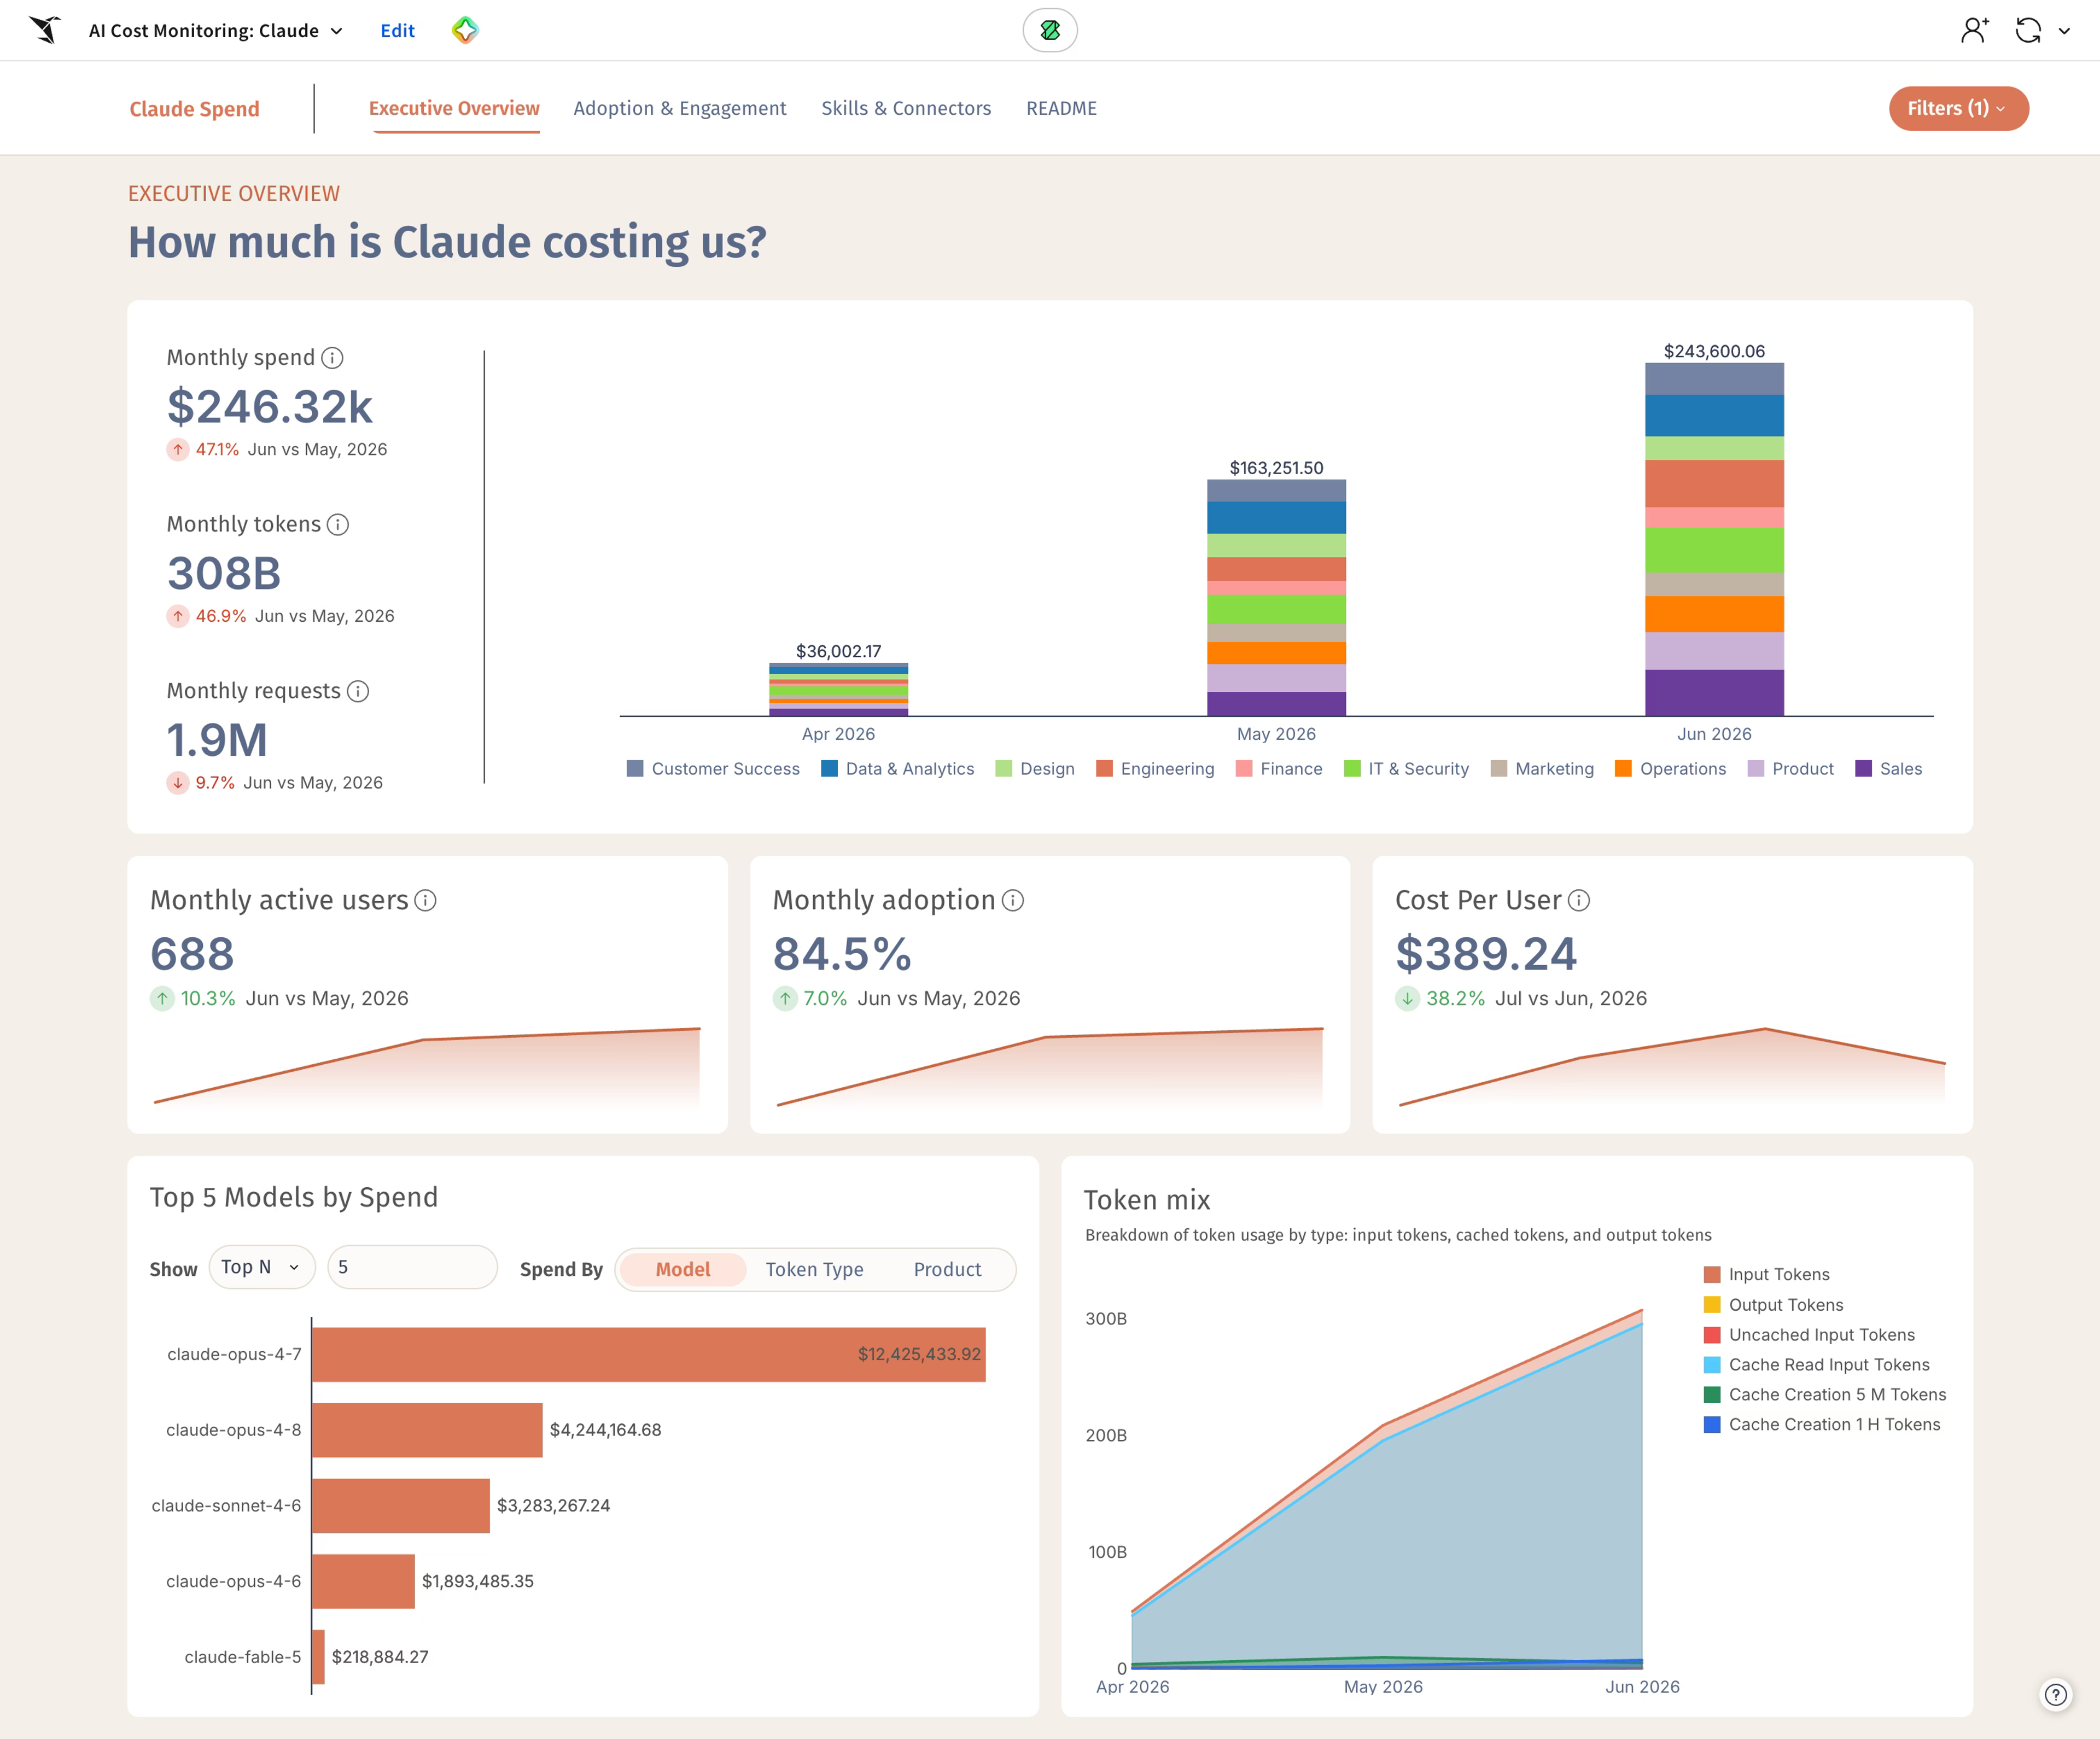
The Claude Enterprise template covers your team's usage of Claude's products, Claude Code, Claude Chat, Claude Cowork, and Claude Design, which Anthropic exports as a series of JSON files. This Sigma template opens to an executive overview of high-level spend and user metrics.
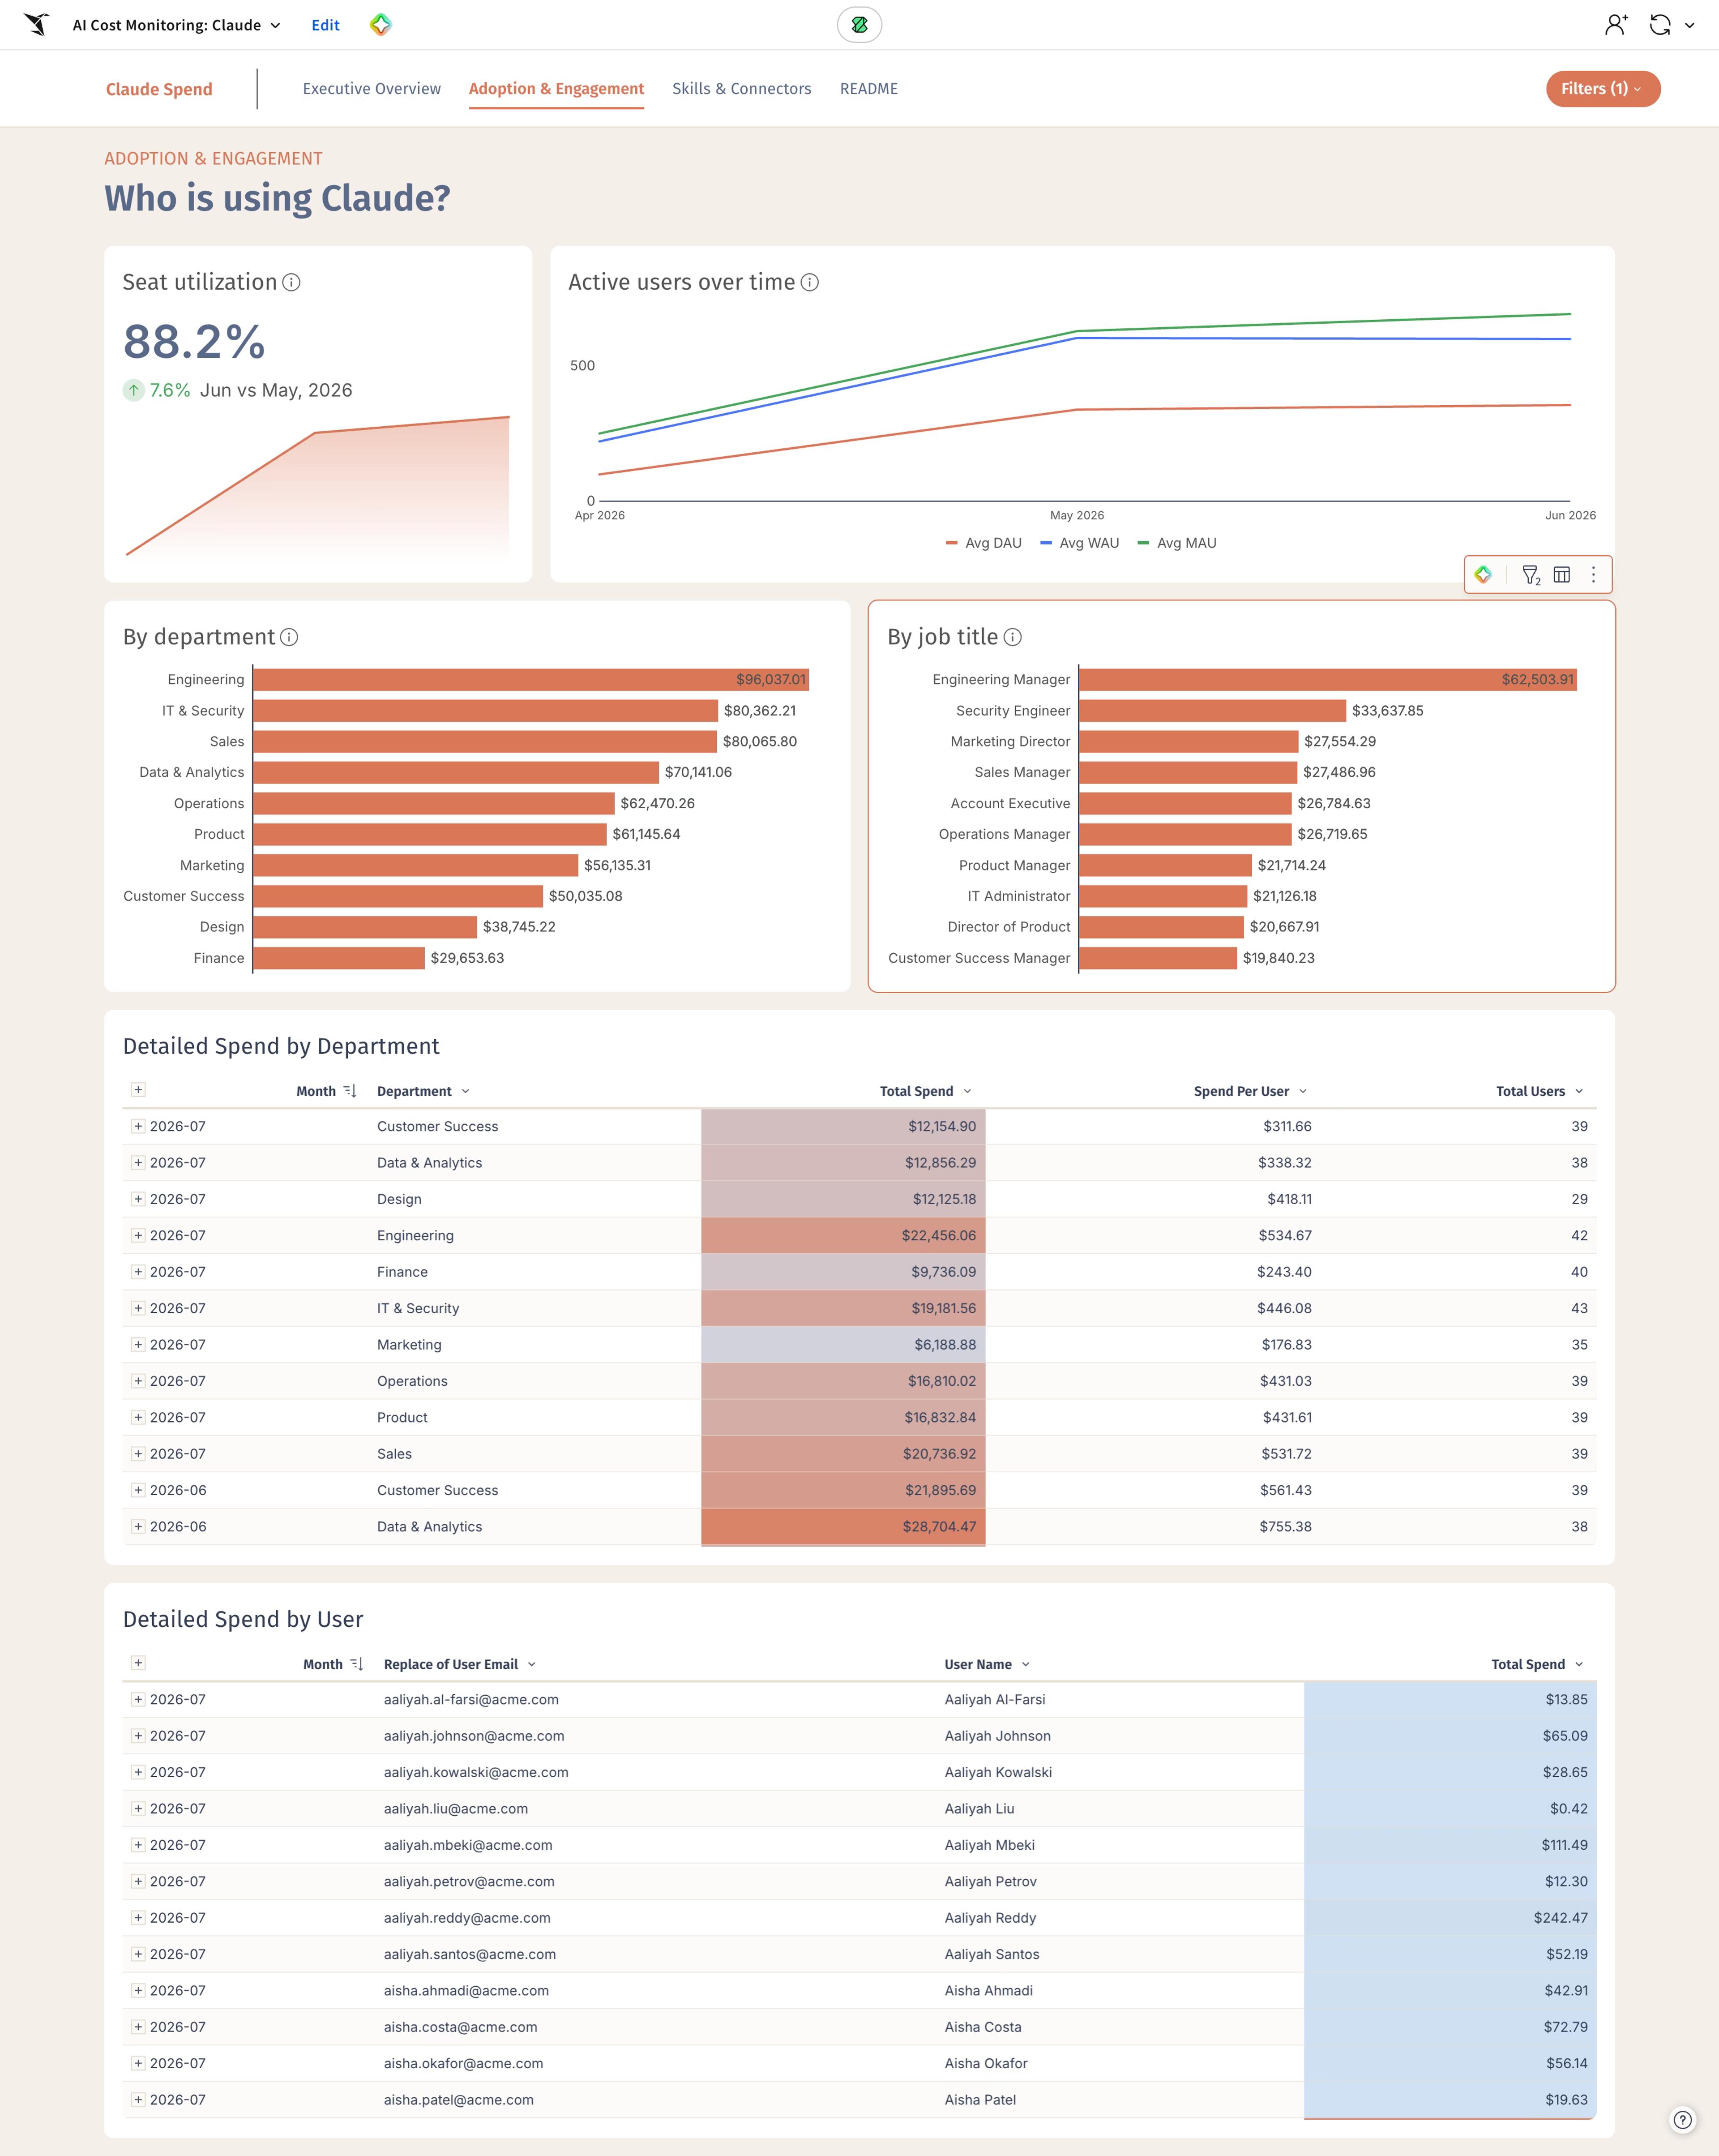
The next tab, “Adoption and Engagement,” shows active users over time, seat utilization, and spend by department and user. You can drill down into the data to see specifics about how and when AI was used.
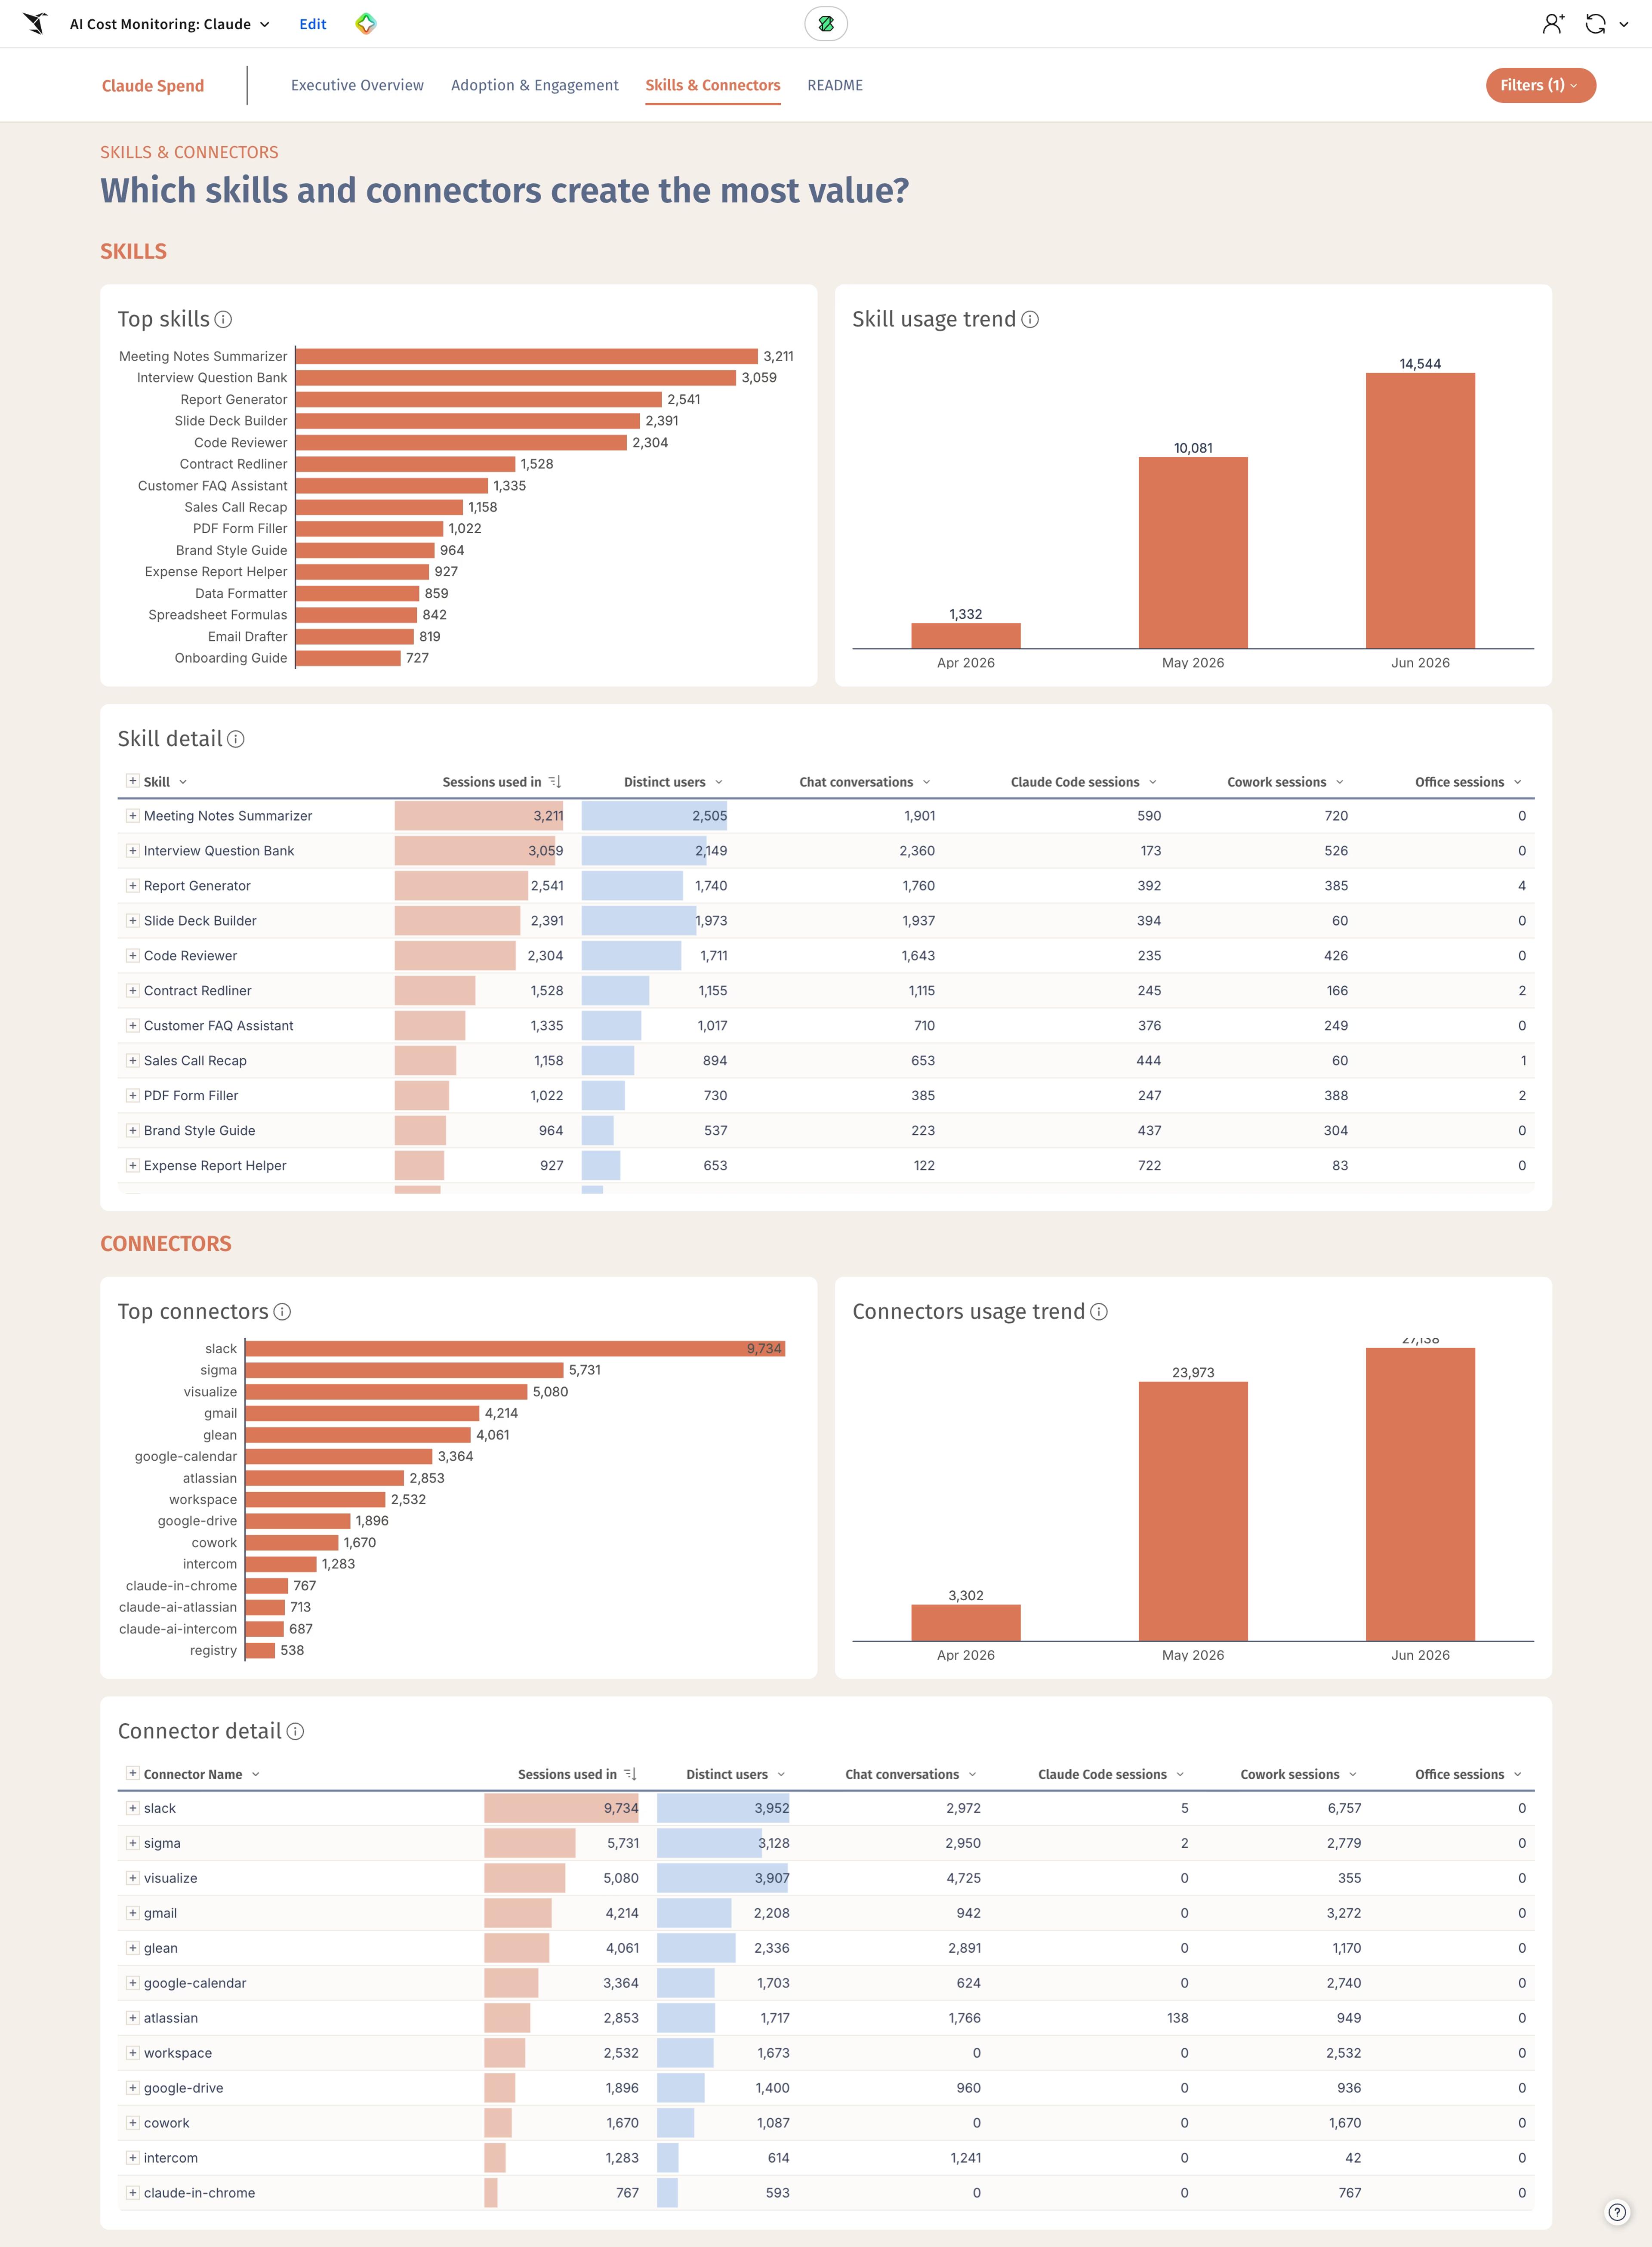
A third page shows which skills and connectors are driving the most value. Like all Sigma workbooks, you can drill in to see the full grain of data underneath.
Finally, a README page walks you through setup, with a date filter to scope the whole workbook. The template ships with sample data you swap for your own, and it joins to your Sigma departmental definitions so the team and cost-center breakdowns populate automatically.
The AI Cost Monitoring Template for OpenAI
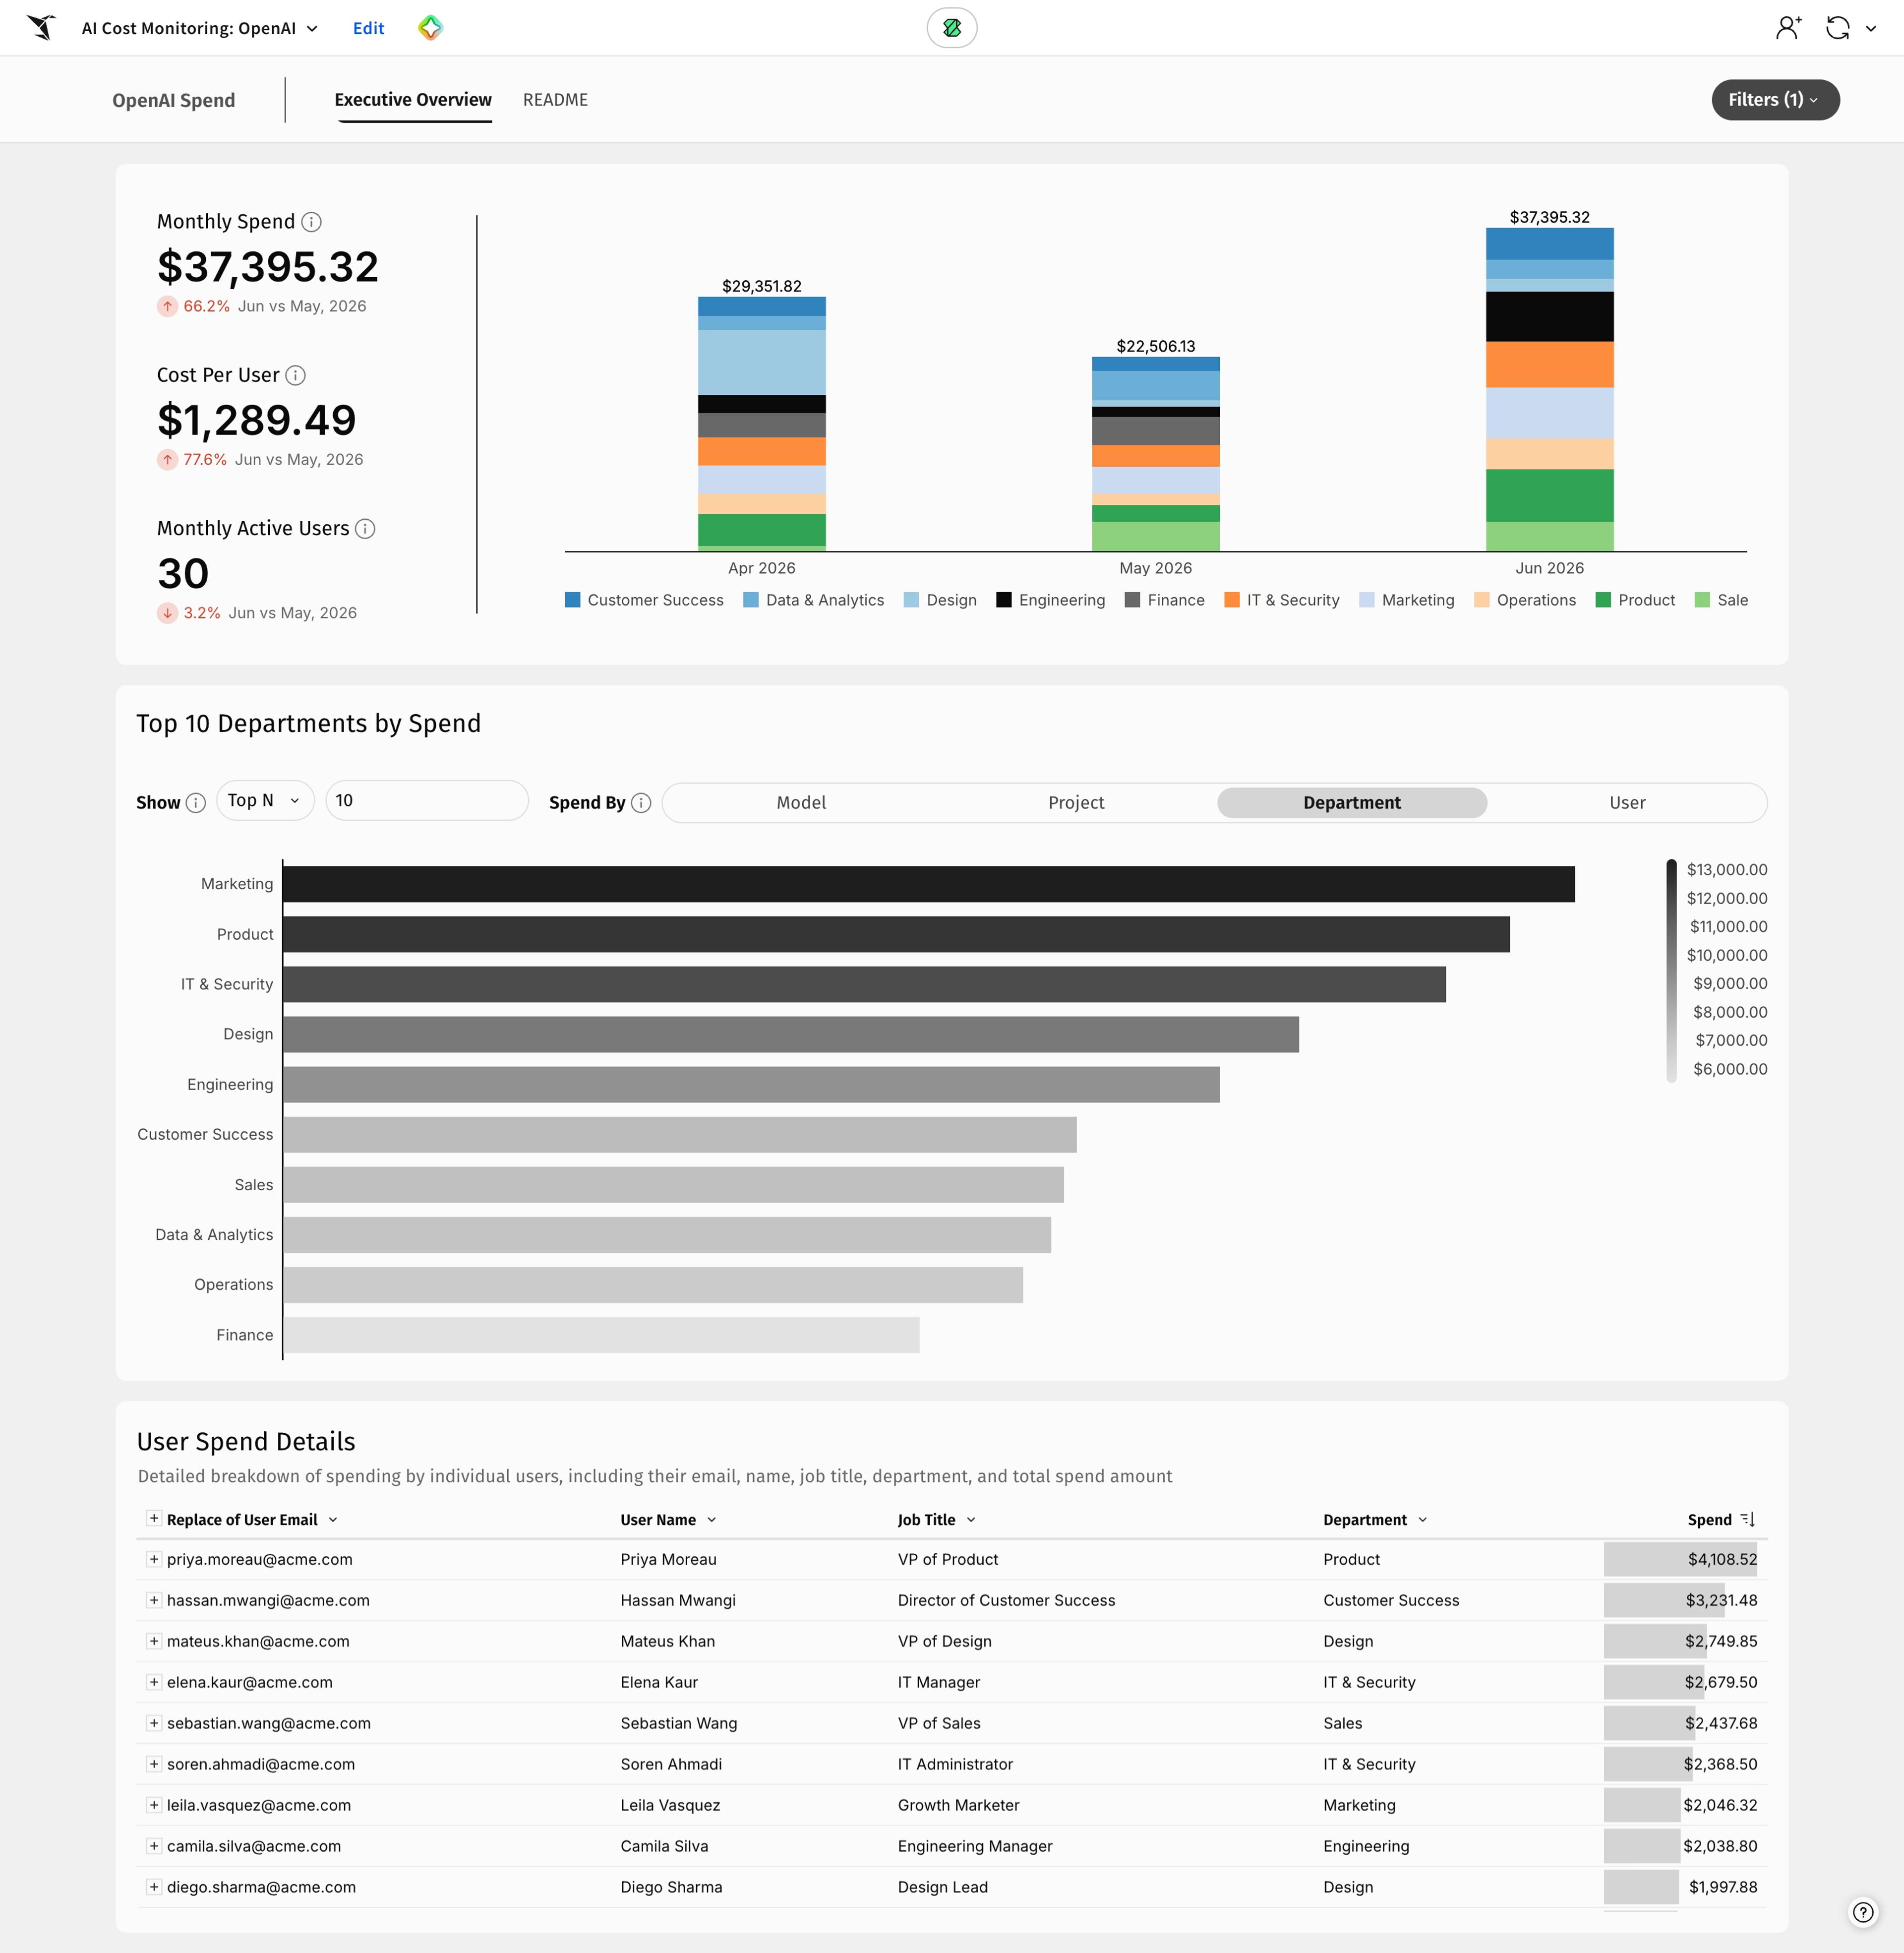
The OpenAI template covers your OpenAI Enterprise usage, broken down by user and team so you can see who is driving spend and how it trends over time. Like the other templates, it ships with sample data you swap for your own and joins to your Sigma departmental definitions, so cost-center breakdowns and side-by-side comparison with your other AI services work on the same terms.
The AI Cost Monitoring Template for Snowflake Cortex AI Functions
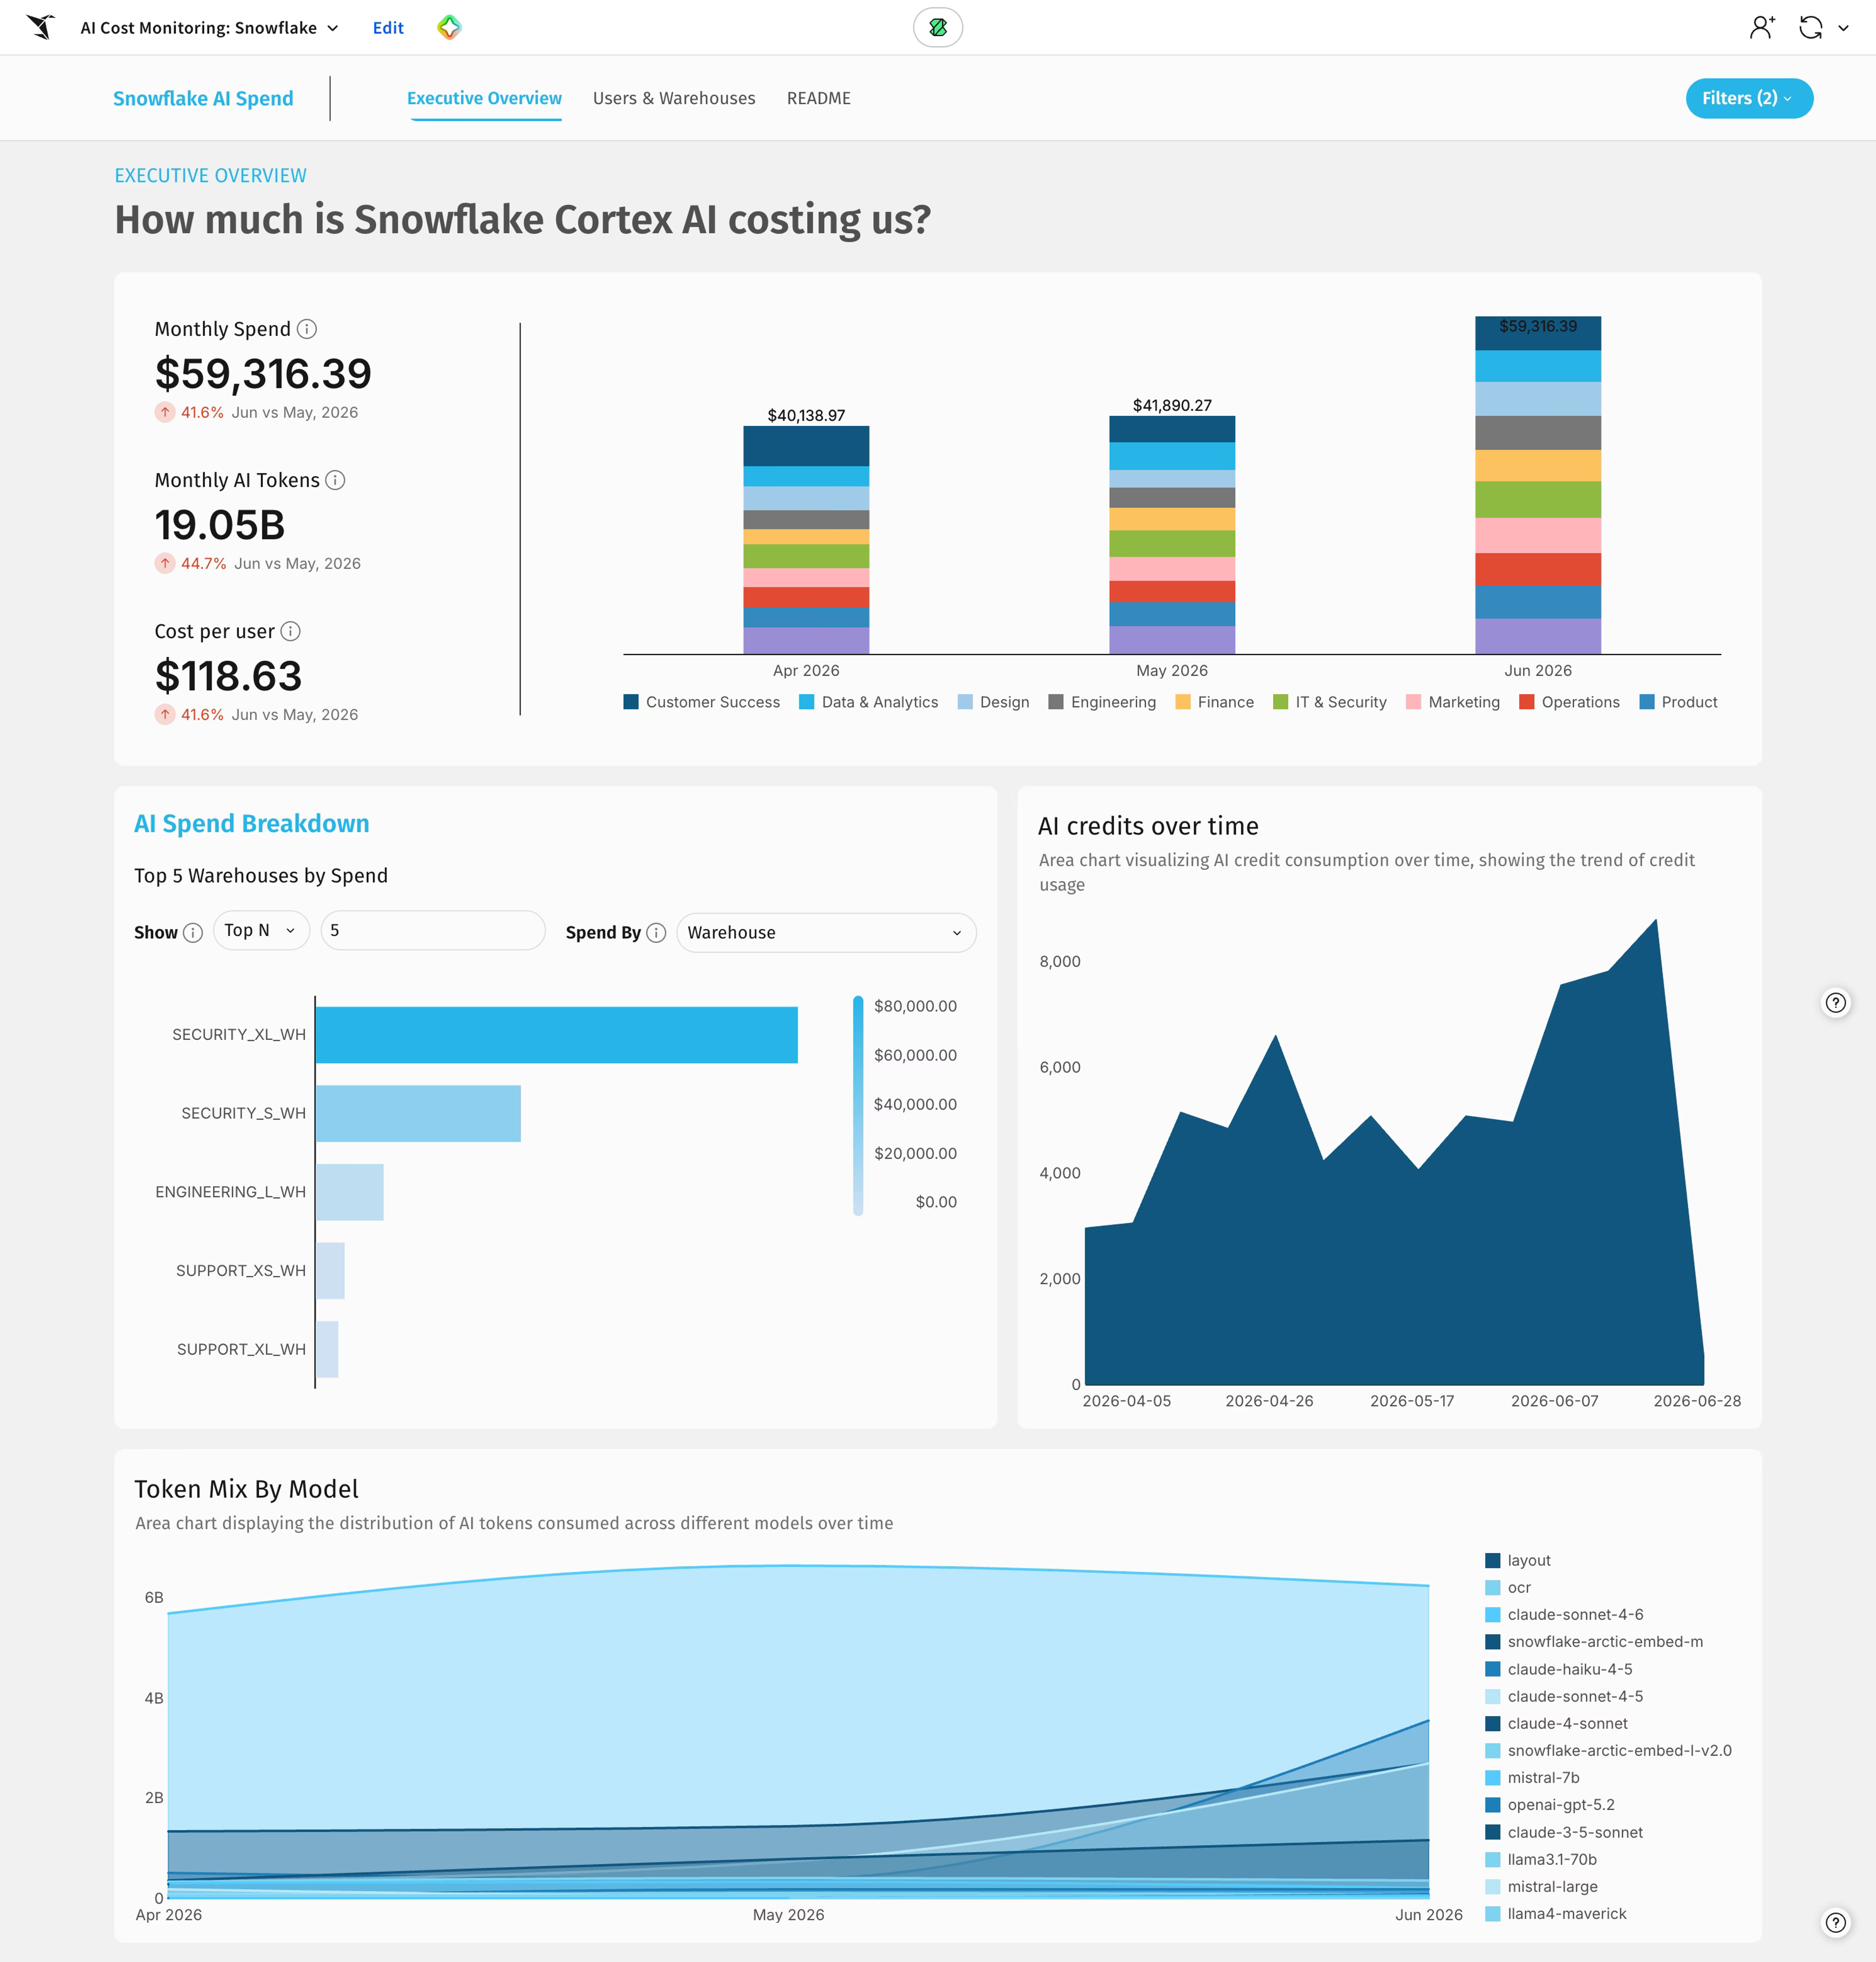
Snowflake bills all of its Cortex AI function usage as a single line, without breaking out which teams or use cases are behind the number. The Snowflake Cortex AI Function Template in Sigma breaks that line down and joins it to your Sigma departmental definitions, so you can attribute Cortex AI-function spend by team, cost center, model, and warehouse.
Why monitor AI costs in Sigma instead of building your own dashboard?
You can hand an AI service its own usage export and get a dashboard back in minutes, but a one-off dashboard is hard to share, hard to secure, and out of date the moment new spend lands, and it only ever covers the one service that produced it. Sigma reconciles every service's export into one governed view your whole team can trust, refresh, and build on.
Every AI service reports spend in its own way with different tables and files. Others hand you a credit summary or a single dollar total. Ask any one of them to spin up a dashboard and you get a quick answer that lives on one person's screen: there's no shared source of truth, no inherited permissions, and no automatic refresh, so the next month's numbers mean rebuilding it.
Sigma has already done that reconciliation work. We analyzed how each service structures its exports and where the fields overlap, so the templates normalize the shared fields and visualizations to give you comparable views all in Sigma, across the dashboards you set up.
Because the dashboard runs live on your warehouse, it inherits the permissions and row-level security you've already set, refreshes as new spend data lands, and can be endorsed as a trusted source and shared across the team. And because it's a Sigma workbook, the dashboard is a starting point rather than an endpoint: you can extend it into a larger cost report, build an AI App on top of it, or add a Sigma Agent that reviews spend on a schedule and flags anomalies. For existing Sigma customers, using the prebuilt templates means analyzing spend in a governed workbook from day one instead of rebuilding and reconciling a separate dashboard for every service.
How do you track AI usage inside Sigma?
In addition to the AI cost monitoring templates for Anthropic, OpenAI, and Snowflake, Sigma provides a prebuilt AI usage dashboard that shows AI usage in Sigma specifically.
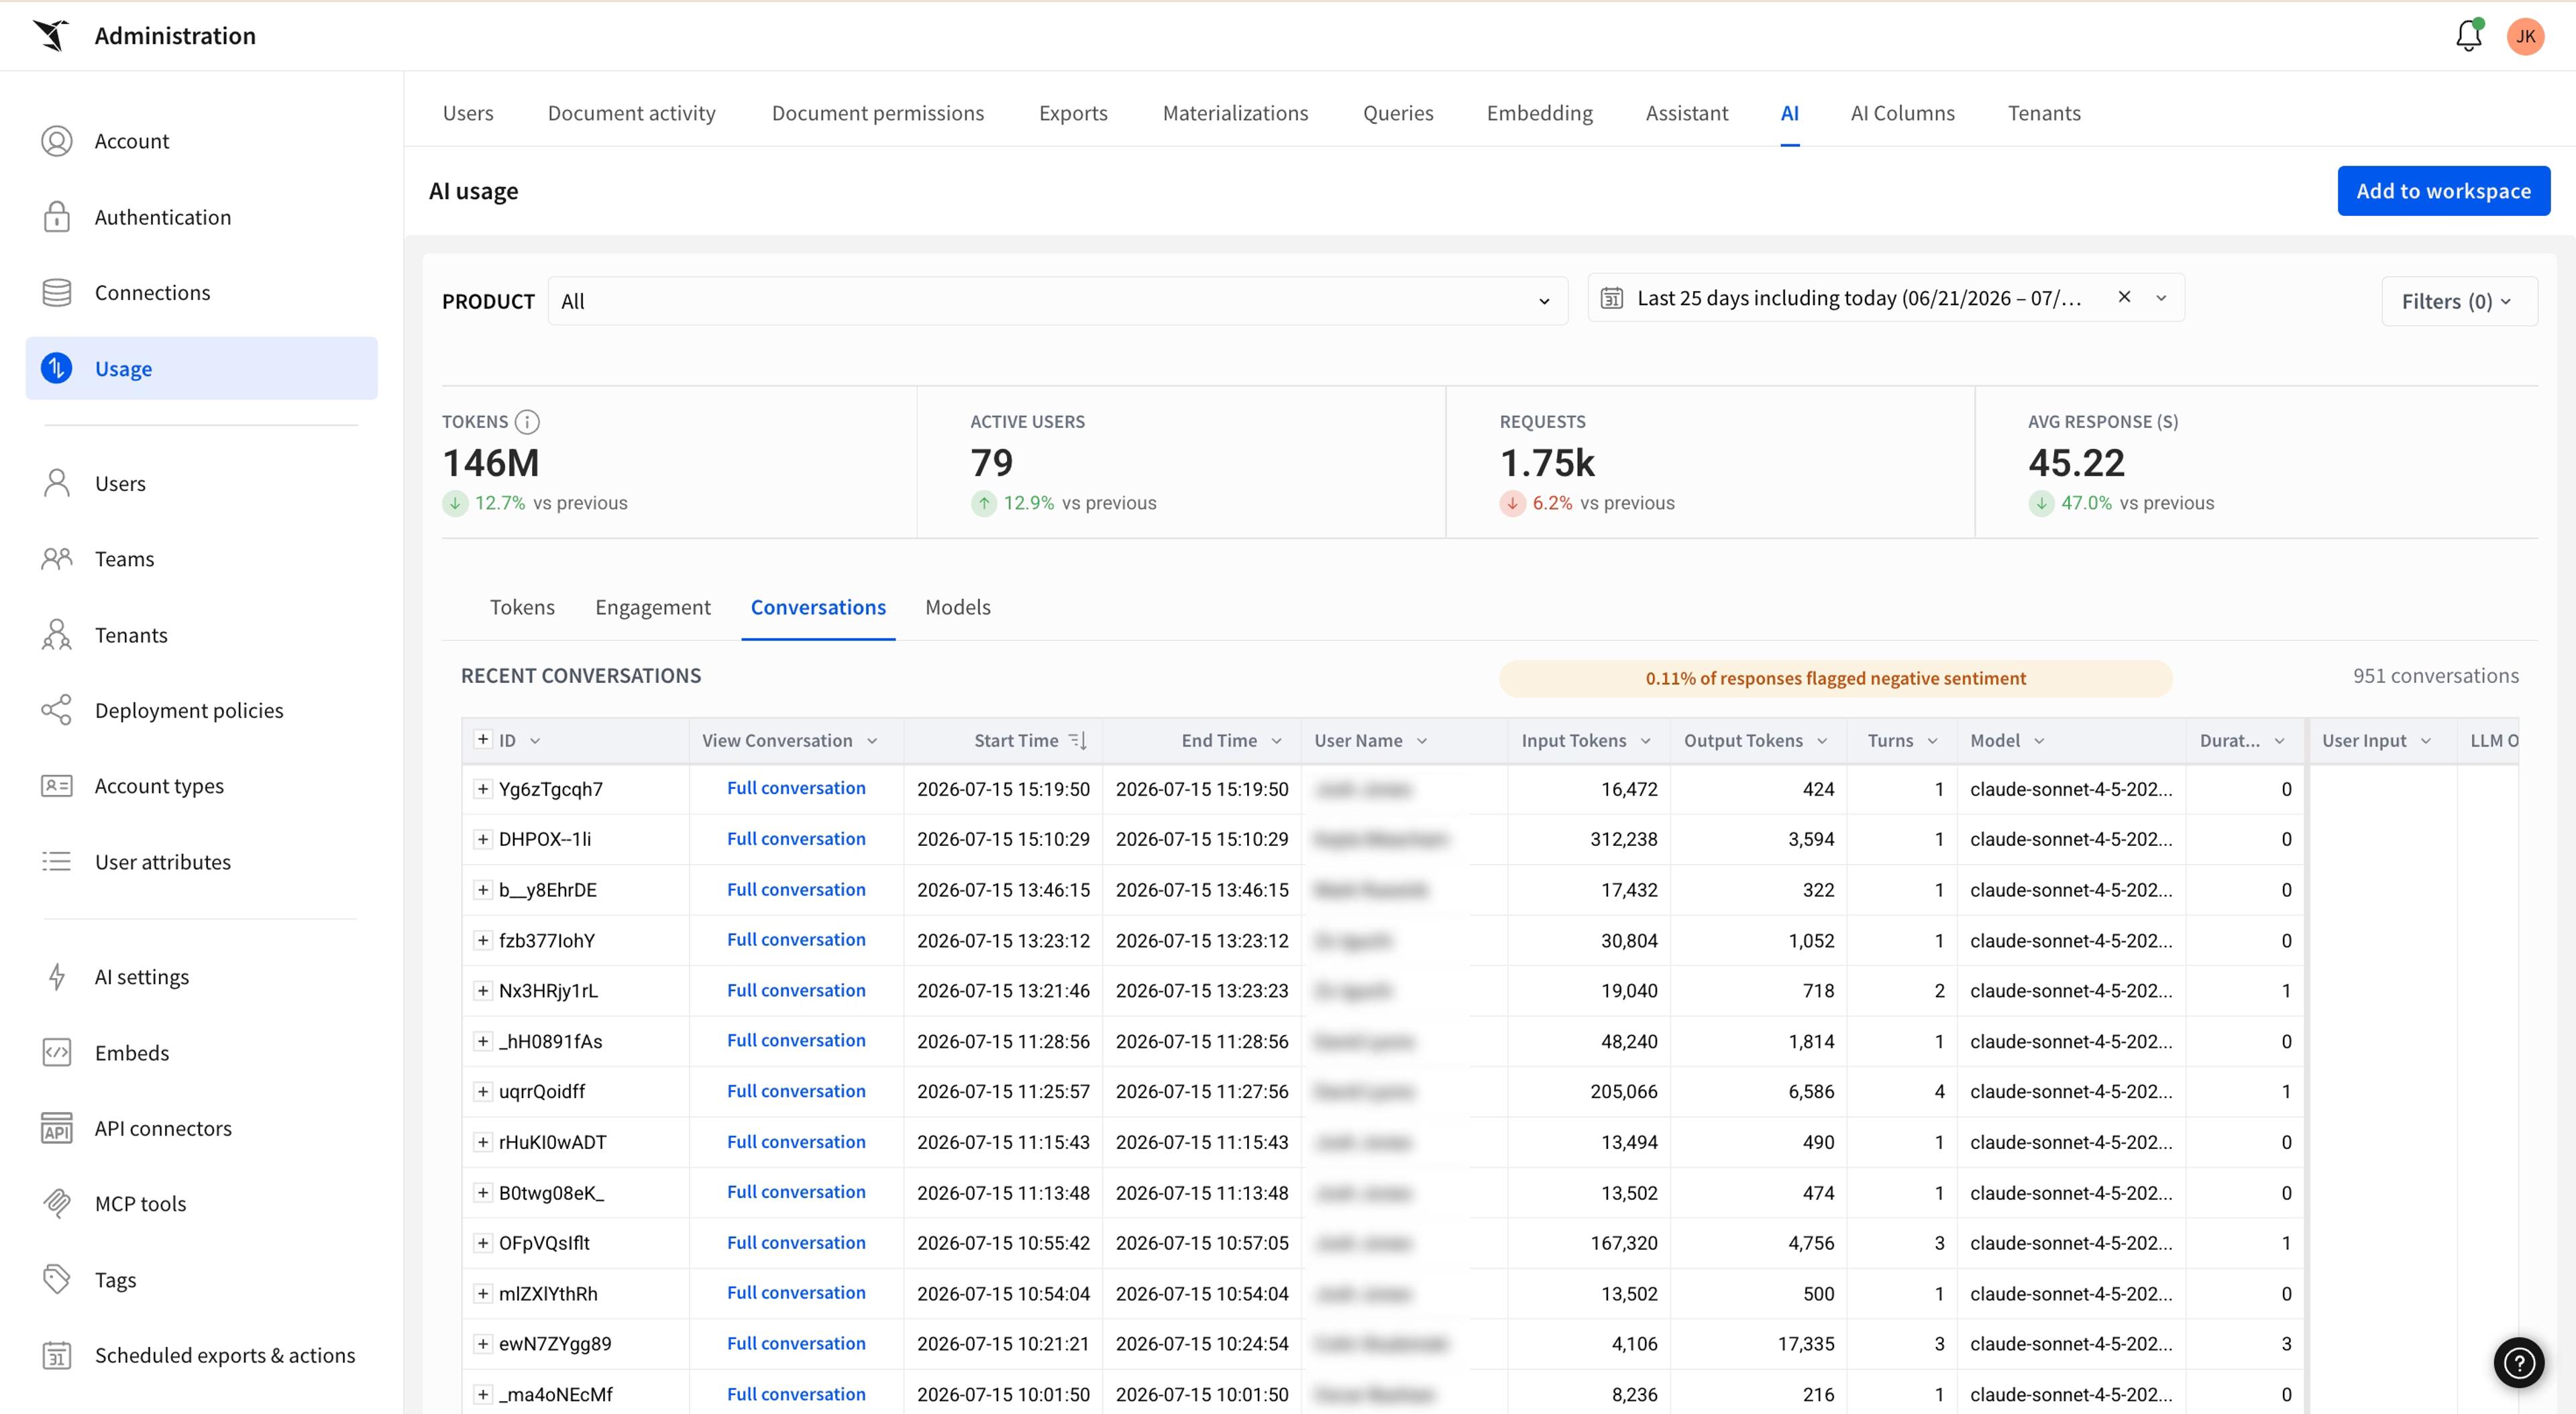
The AI usage dashboard gives admins a breakdown of token usage and trends by user, team, and feature or use case, all inside Sigma. It covers usage across all of Sigma's AI features, with filters for each product surface, model used, user feedback sentiment, and team.
You can add the dashboard to your workspace and shape the workbook however you need. You can fully customize the view: set your own alerts, add Sigma Agents, and layer your own context and KPIs on top of token usage.
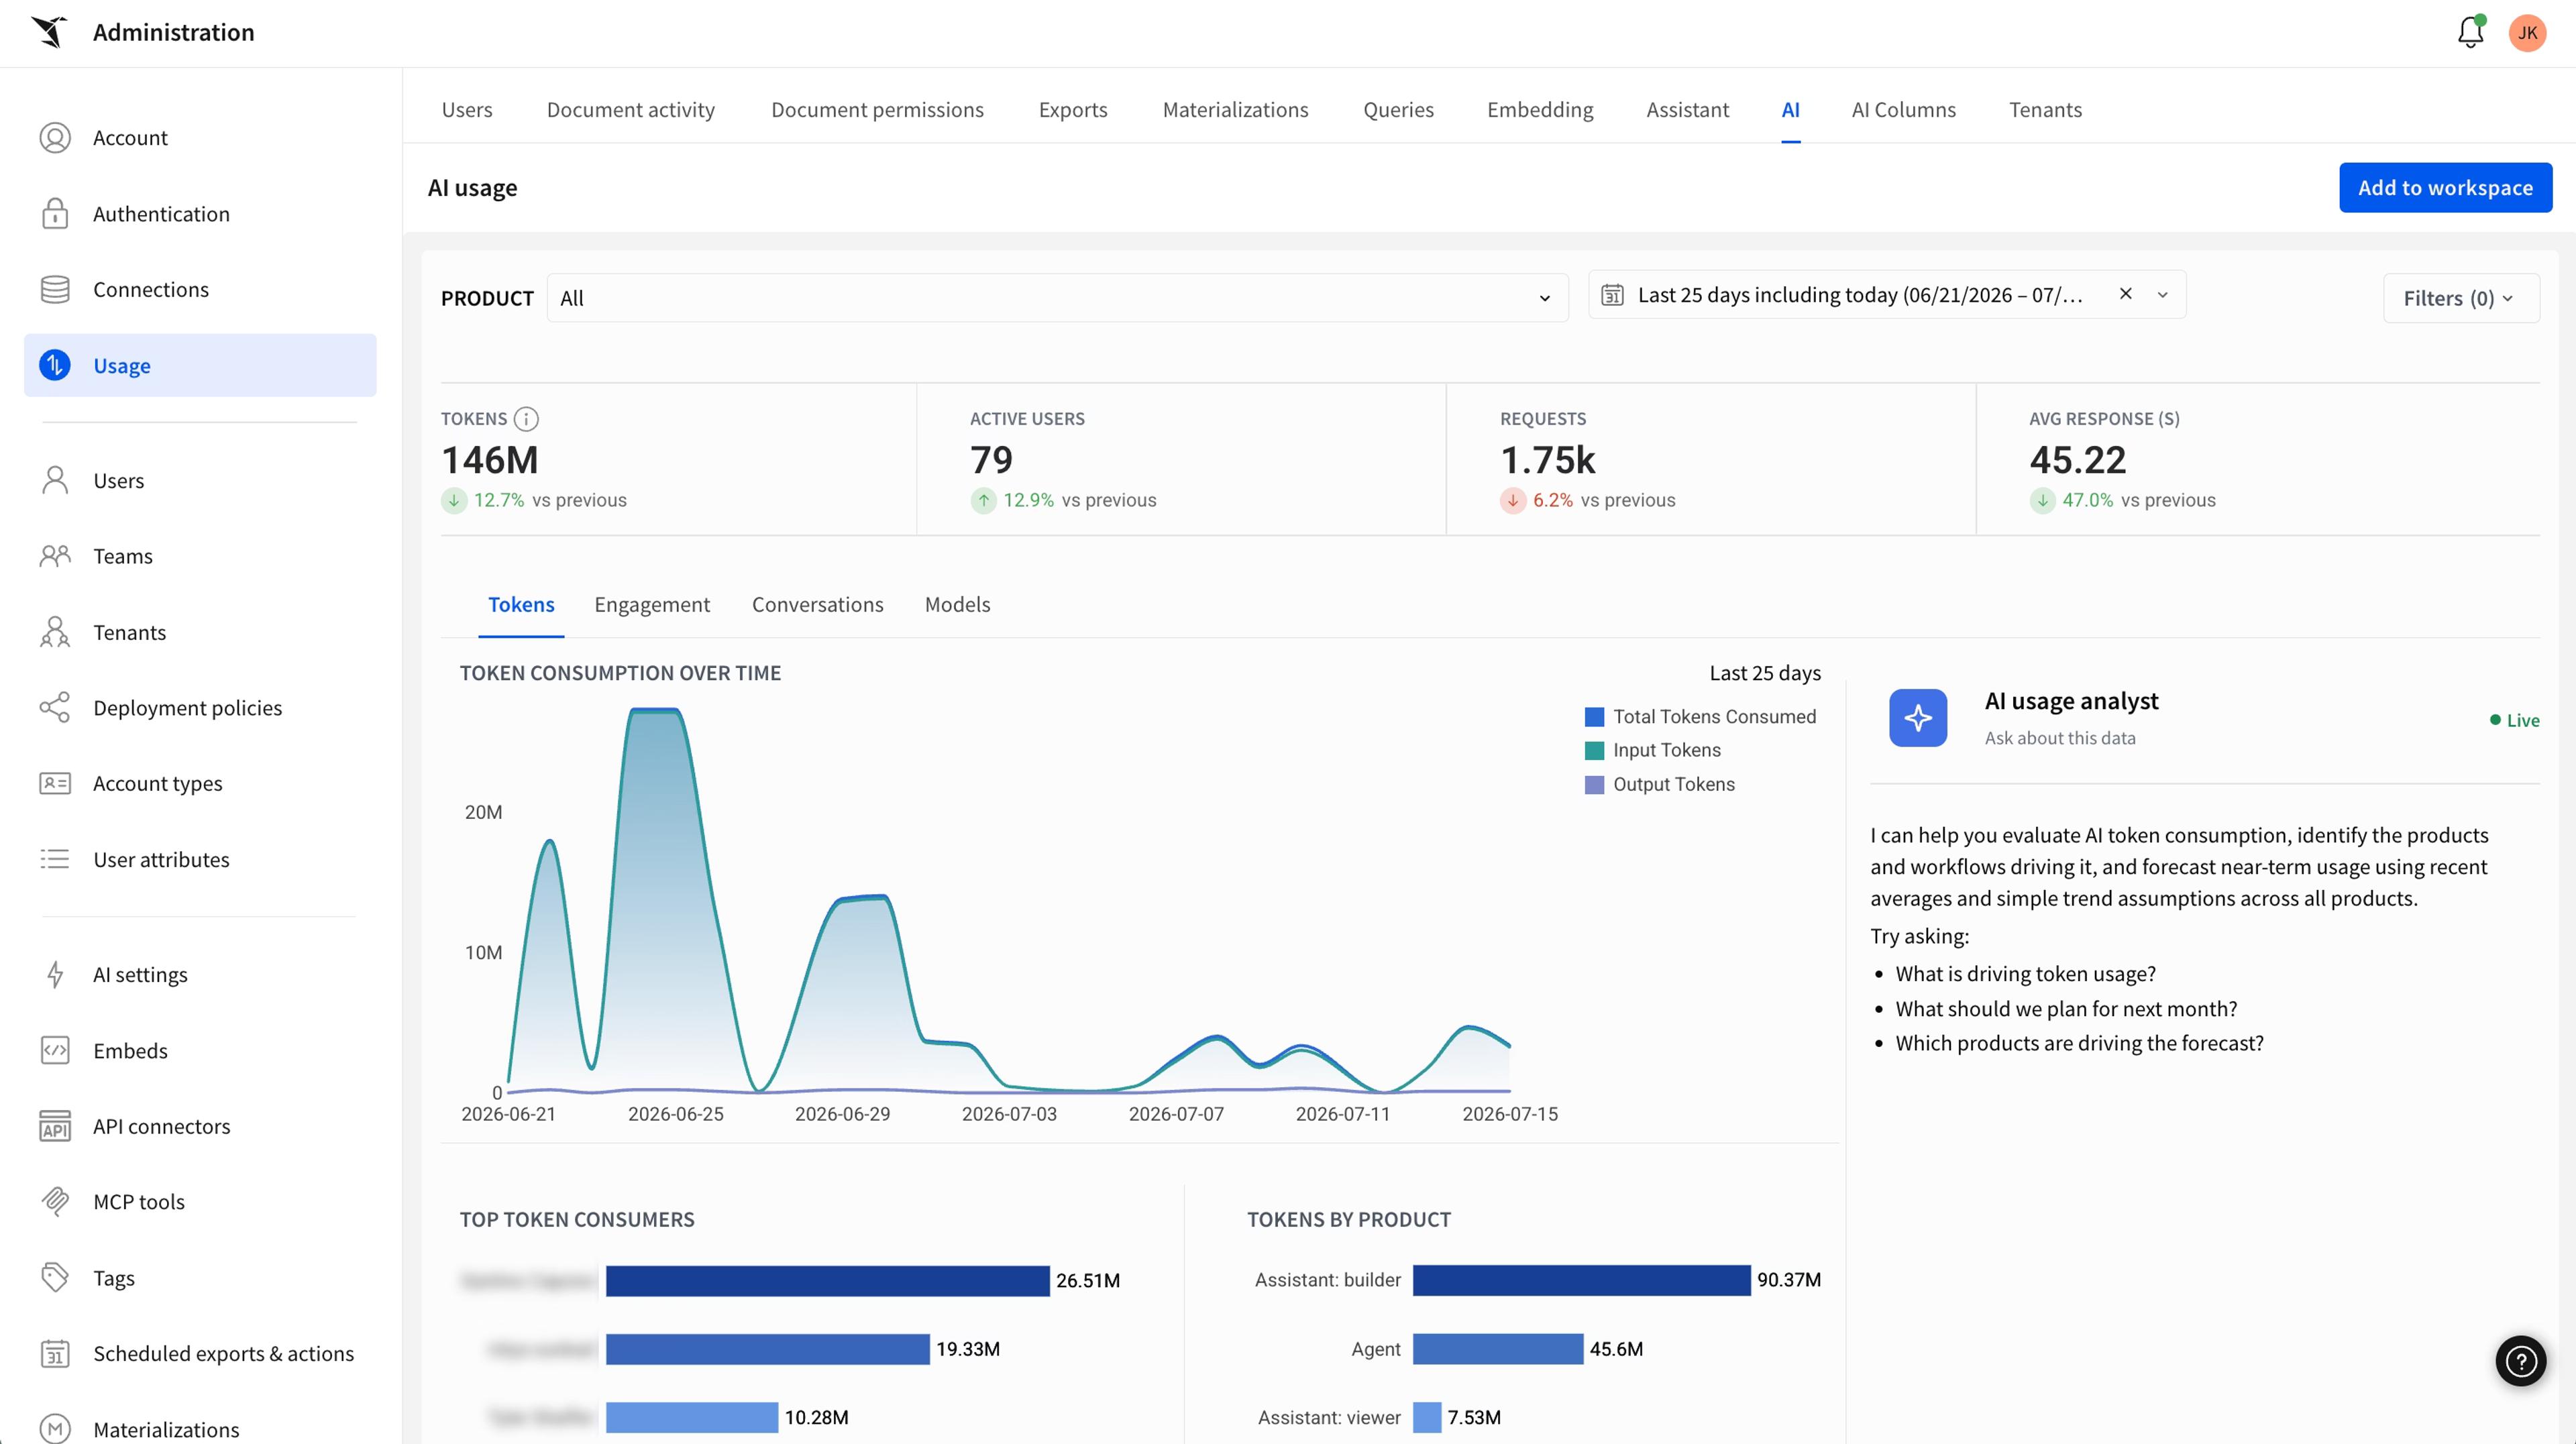
Usage is only half the question. The next step is evaluating which AI use is driving value. The AI usage dashboard gives you a full view of your AI inputs and outputs, plus the user feedback on those outputs, written to a schema in your own data warehouse and owned by you. With that data, your data team can evaluate how well AI is working for analysis and building, adjust the business context, metadata, or semantic layer, and double down on the use cases that are adding value.
To set up your usage view:
- Configure Sigma to write usage data to your warehouse. In the admin console, open AI settings and set the schema where your AI inputs, outputs, and usage data should be written. The data for all your AI features will be stored in this writeback schema on your connection.
- Open the AI usage dashboard. Go to Administration, select Usage, and open the AI usage dashboard. You'll see options to filter by each feature, filters for team and product, and trend charts.
- Make it yours. Click “Add to workspace” to bring the dashboard into your workspace and customize the workbook.
Why does AI cost visibility matter now?
AI is entering its accountability era. FinOps came for cloud spend once it became too big to ignore, and it's coming for AI the same way. The teams that keep investing in AI a year from now will be the ones who treat AI spend like any other managed investment: measured, attributed to a team and a use case, and optimized against the value it returns. Spending with intent beats spending the most, and you can only spend with intent once you can see where the money goes.
That's the shift Sigma is built for. Because everything runs on your own warehouse, your AI spend data lives where your governance already does, and every breakdown inherits the permissions and row-level security you've already set. There's nothing new to govern and no data to move.
Get started
Already a Sigma customer? The AI cost monitoring templates are on your home page now, and the AI usage dashboard is in the admin portal. All are generally available. Visit the following documentation to learn more:
- Claude Enterprise Spend Template
- OpenAI Consumption Spend Template
- Snowflake AI Functions Spend Template
- AI usage dashboard
New to Sigma? Schedule a demo to see how governed AI cost monitoring works on your own data.
Frequently asked questions
How is this different from the previous Assistant usage dashboard? The earlier dashboard covered usage for Sigma Assistant only. The AI usage dashboard covers all of your AI features in Sigma in one place, with richer breakdowns and the ability to customize the dashboard. In the admin console, open AI settings and set the new schema where your AI inputs, outputs, and usage data across all AI features should be written.
Which services do the cost monitoring templates cover today? Anthropic (Claude Enterprise), OpenAI, and Snowflake Cortex AI Functions are covered today.
For Anthropic:
- Claude Code, Claude Cowork, Claude Chat, Claude Design and Office agent are covered.
- Coverage is for product usage, not API usage.
For OpenAI:
- Consumption-based use of Codex and API is covered.
- ChatGPT product use is billed per license, and therefore not covered in consumption costs.
For Snowflake:
- All Cortex AI function calls (ex: Complete, Embed) are covered. Cortex Search / Agents are covered.
- CoCo and Snowflake CoWork coverage is coming soon.
Are there more cost monitoring templates coming soon? Yes, we plan to launch more templates for Claude Platform, all other Snowflake Cortex AI products, Databricks, Cursor, and Gemini.
Where does my usage data live? In your own data warehouse. Your AI inputs, outputs, usage, and the user feedback on those outputs are written to a schema you own. The templates use external spend data that you choose to store in your warehouse too.
What do I need to set up the templates? Follow each template's README to export spend data from the service into your warehouse, then connect the template. Because the template matches the service's export format, your real data swaps in with a couple of clicks.
Is it available now? Yes. The AI cost monitoring templates are live now, and the AI usage dashboard is already available in Sigma.