How to Build a Sales Dashboard: A Step-by-Step Guide

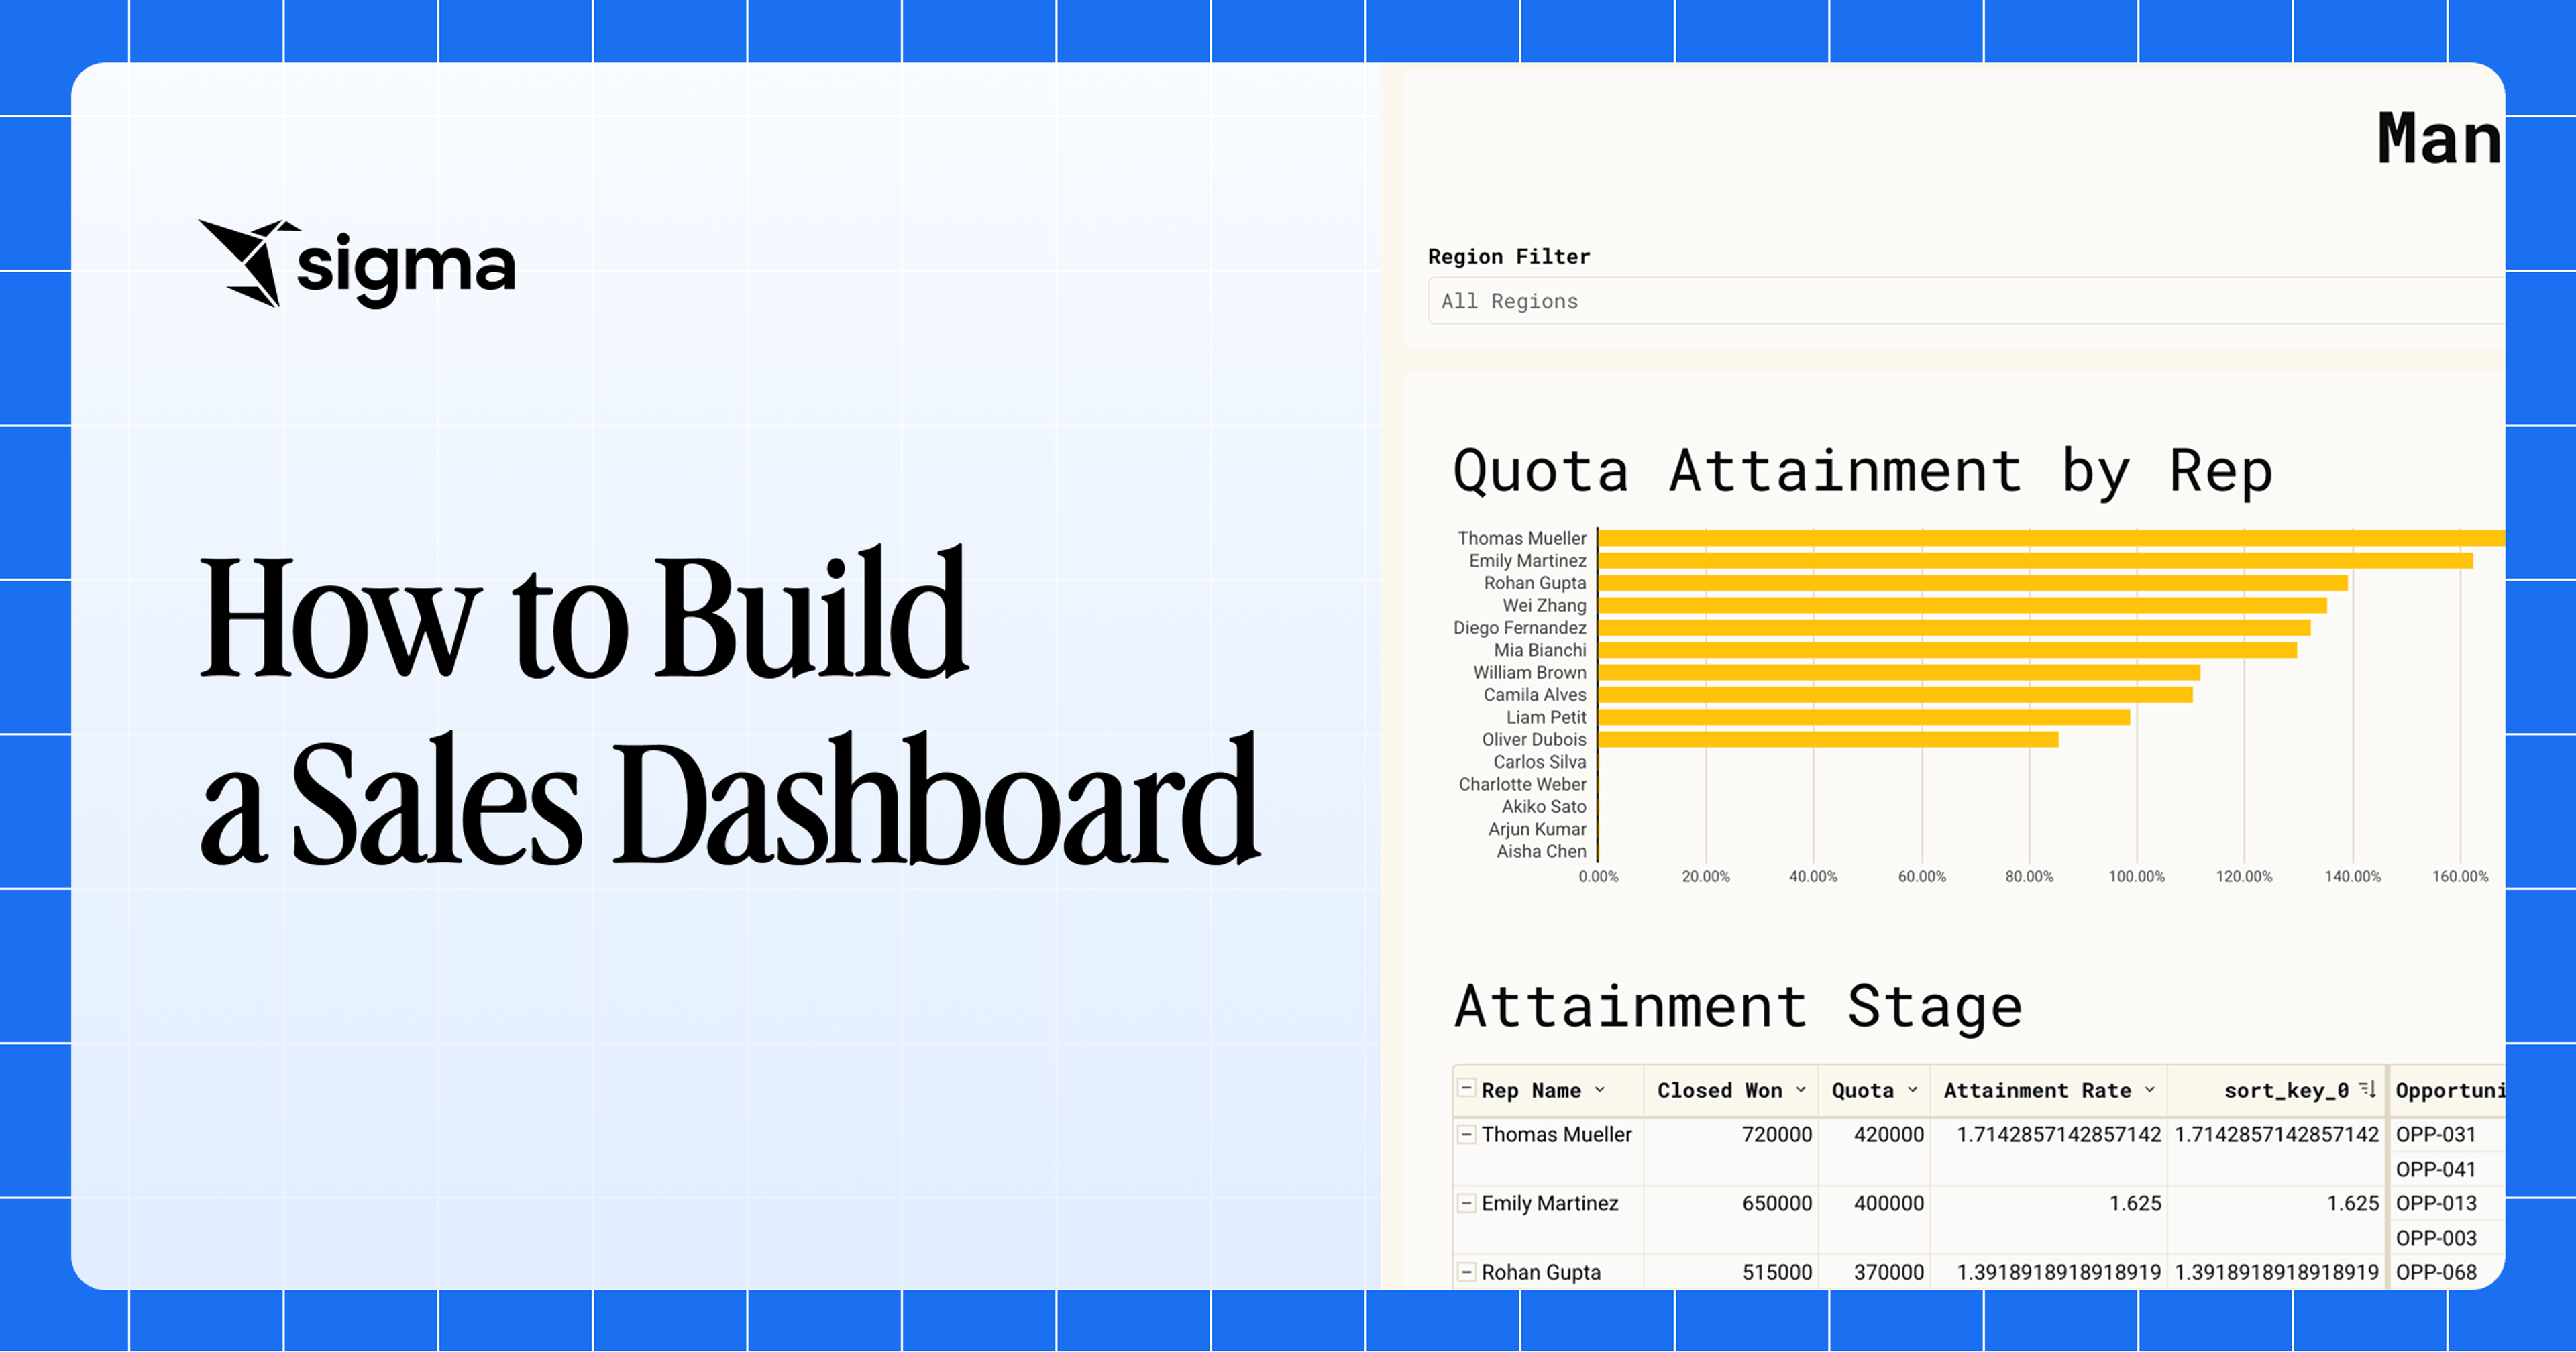
A sales dashboard turns scattered CRM, billing, and quota data into one shared view of the pipeline that reps, managers, and executives can act on. With reps’ focus pulled in many areas, a sales dashboard can cut the admin and reconciliation tax, so reps have more time to close deals.
This guide covers the prerequisites, the build sequence, and the practices that keep the sales dashboard useful after launch.
Key takeaways
- Before building a sales dashboard, start by defining audience decisions, preparing governed data, and selecting metrics that matter to your business.
- A sales dashboard delivers value when each view answers a specific question for a specific audience: reps deciding what to work on today, managers checking team health, executives forecasting the quarter.
- Put consolidated sales data in a cloud warehouse, deduplicated CRM records, locked metric definitions, and role-based access in place before the build.
- Pair each metric with the decision it triggers, match refresh cadence to that decision cycle, and add short annotations so meetings move straight to next steps instead of debating what the chart means.
What is a sales dashboard?
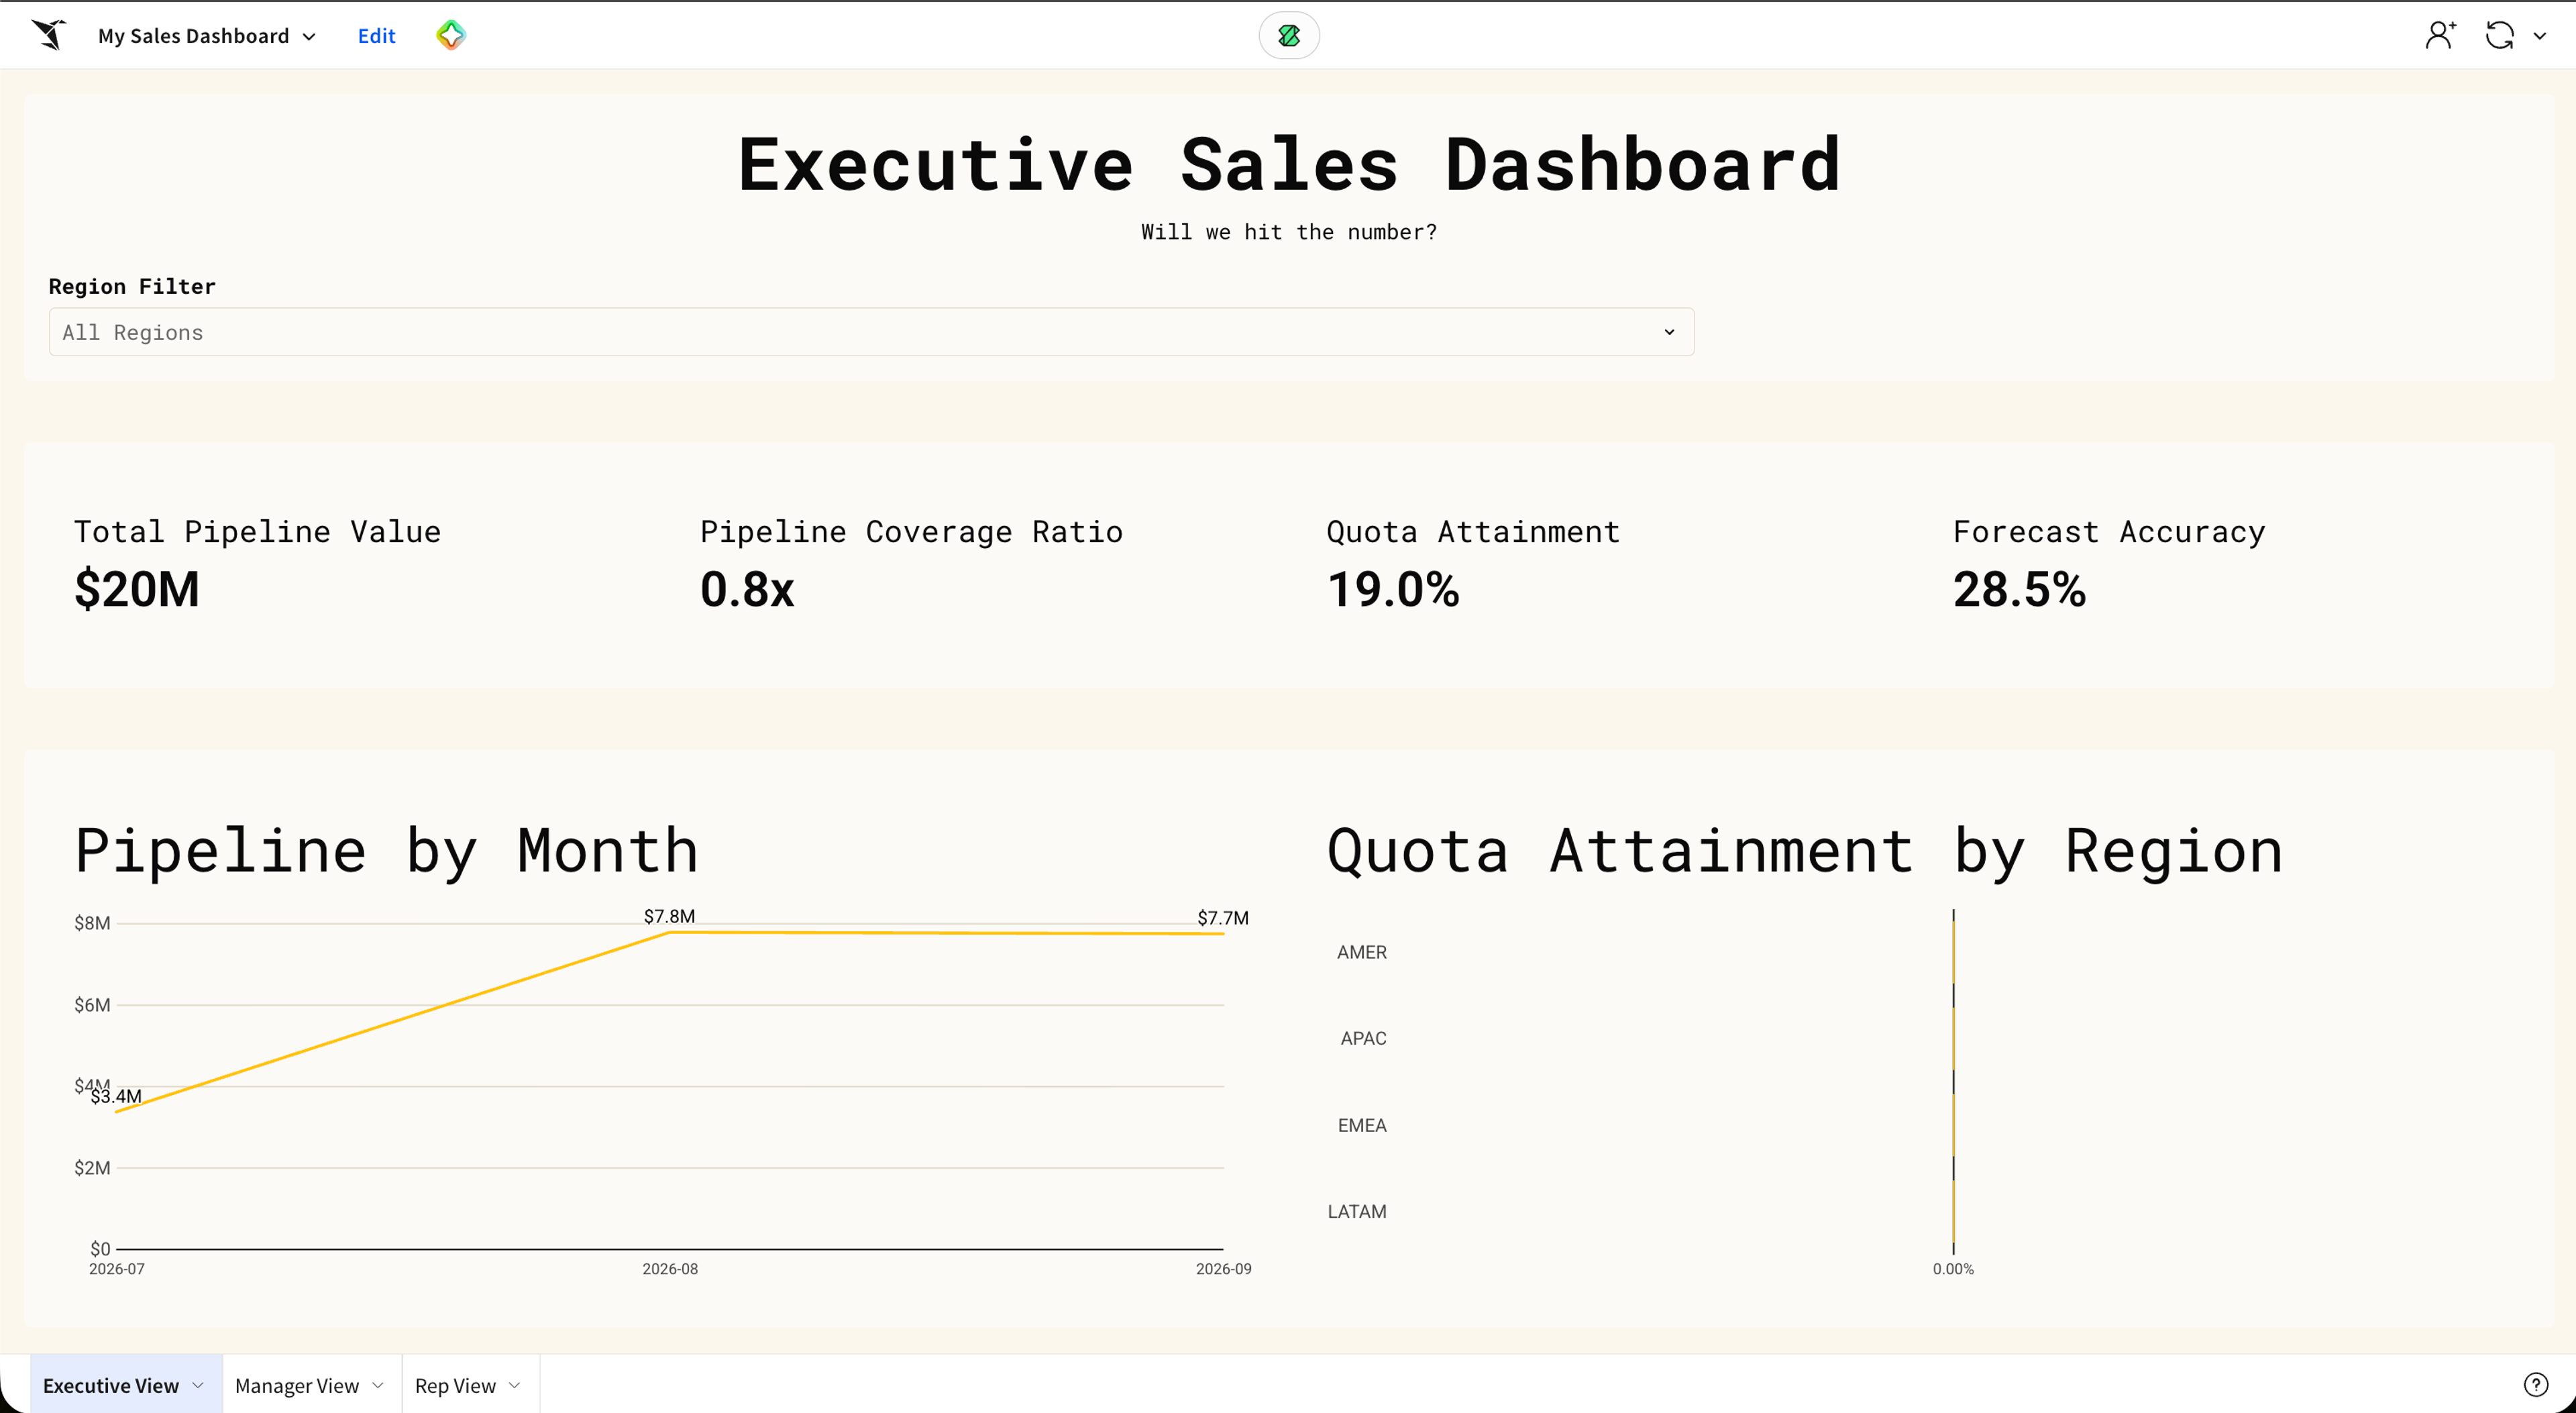
A sales dashboard is a centralized view that pulls pipeline, activity, and revenue data from across the sales stack (CRM, billing, quota assignments, and related systems) into one place where reps, managers, and executives can read the same numbers.
A sales dashboard typically covers a few core components:
- Pipeline and coverage metrics that show open opportunities, weighted pipeline, and coverage against quota.
- Activity and leading-indicator metrics such as calls, meetings, and new pipeline generated.
- Conversion and velocity metrics including win rate, stage-to-stage conversion, and sales cycle length.
- Quota attainment and forecast accuracy at the rep, team, and org level.
- Role-based views that let each audience see the slice of the pipeline relevant to their decisions.
Done well, a sales dashboard replaces the patchwork of CSV exports and one-off spreadsheets with a single source of truth that updates as the underlying data does.
The benefits of a sales dashboard
A sales dashboard pays off when it changes how the team works, not just what they see. The five benefits below consistently appear across pipeline reviews, forecast calls, and QBRs.
- Team-wide visibility. Reps, managers, and executives read from the same pipeline values, stage definitions, and close dates instead of comparing different exports.
- Less manual reporting. Automated views replace the CRM-pull-and-reconcile cycle that eats hours before every pipeline review. Sales professionals spend 60% of their time on tasks other than selling during an average workweek.
- Earlier risk detection. Coverage below target, deals past the expected close date, and conversion drops at a specific stage surface weeks before they show up in a static report.
- Faster forecast calls and QBRs. Meetings open with the numbers already aligned, so the conversation moves to next steps instead of debating whose figure is correct.
- Better coaching conversations. Managers can drill from team-level trends into individual rep activity and pipeline without rebuilding the view in a spreadsheet.
Taken together, these benefits turn the dashboard from a reporting artifact into the surface on which pipeline decisions are actually made.
5 prerequisites for building a sales dashboard
Five prerequisites set the foundation for a sales dashboard the team can trust, one that holds up when the underlying schema changes.
1. A single source of truth for sales data
Sales data is fragmented by default: opportunities live in the CRM, invoiced revenue in billing, attribution in the marketing automation platform (MAP), and quota assignments often in a spreadsheet on someone's laptop. Land that data in a cloud data warehouse (Databricks, Snowflake, BigQuery, Amazon Redshift, or similar) and model it there, so every downstream consumer reads from the same data.
2. Clean, deduplicated CRM data
A dashboard built on dirty or messy data will report inflated, unreliable numbers, no matter how well designed the views are. Bidirectional syncs between systems often produce duplicate opportunities because most integrations don't deduplicate by default. Establish merge rules, add validation rules that block new duplicates at the point of entry, and run a baseline audit before building.
3. Agreed metric definitions
Every metric on the dashboard needs a single definition the whole team agrees on. "Revenue" in the CRM and "revenue" in billing often differ because of timing, discounts, or contract amendments. "Pipeline" can mean total open value, weighted pipeline, or just deals above a certain stage depending on who you ask. Lock these definitions before building and encode them in a centralized transformation layer so every downstream view inherits the same logic.
4. A clear access and permissions model
Ensure the system your building in supports role-based access and fine-grained permissions before adding the first chart to the canvas. Reps should see their own pipeline. Managers should see their team. Executives should see the full org. Row-level security inherited from the warehouse keeps this clean without forcing the team to maintain a separate dashboard for each role.
5. A platform the builders can actually use
The team that knows which sales metrics matter is rarely the same team that writes SQL, and that mismatch is where some dashboard projects stall in the pilot phase. The build platform should let RevOps analysts, sales operations leads, and finance partners author and adjust views directly on live warehouse data.
Step-by-step guide to building a sales dashboard
With the prerequisites in place, the build follows a clear sequence: define the questions the dashboard answers, prepare the data, choose the metrics that earn a place, then build, validate, and share.
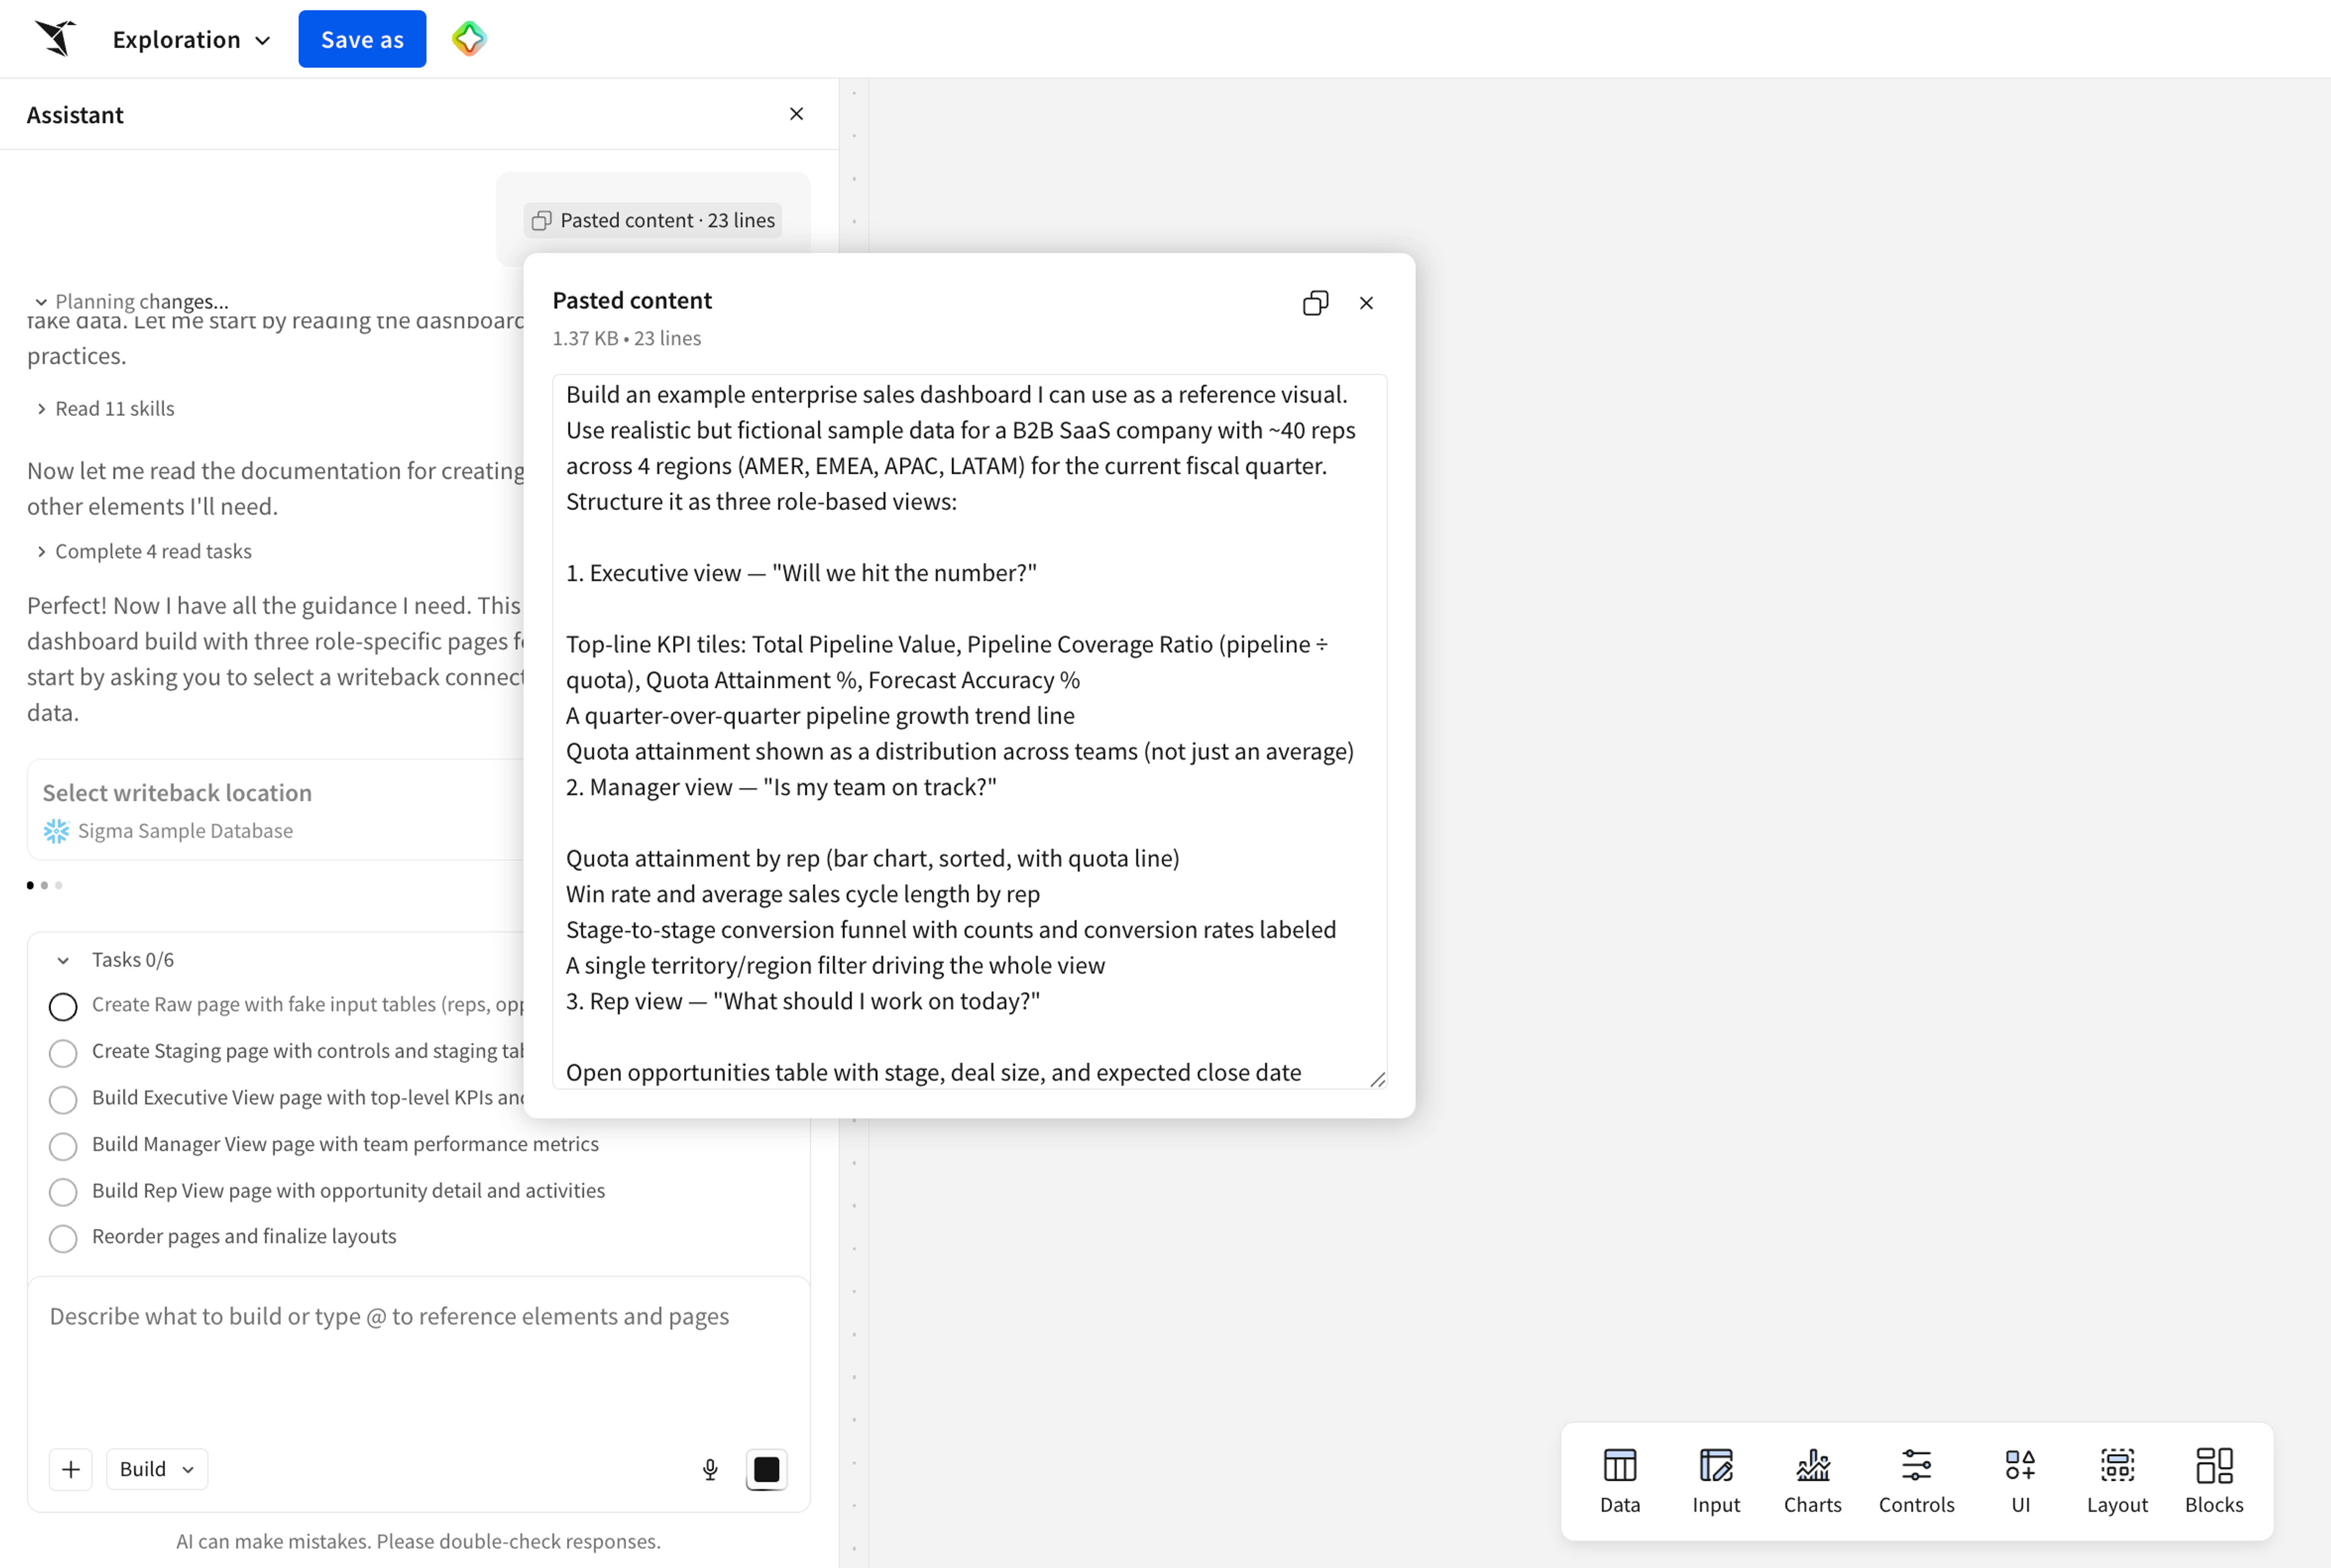
Step 1: Define what your dashboard needs to answer
Decide who the dashboard serves and which specific decisions it drives. Reps, managers, and executives use dashboards on different cadences and for different decisions, so they need different metrics, time horizons, and levels of detail.
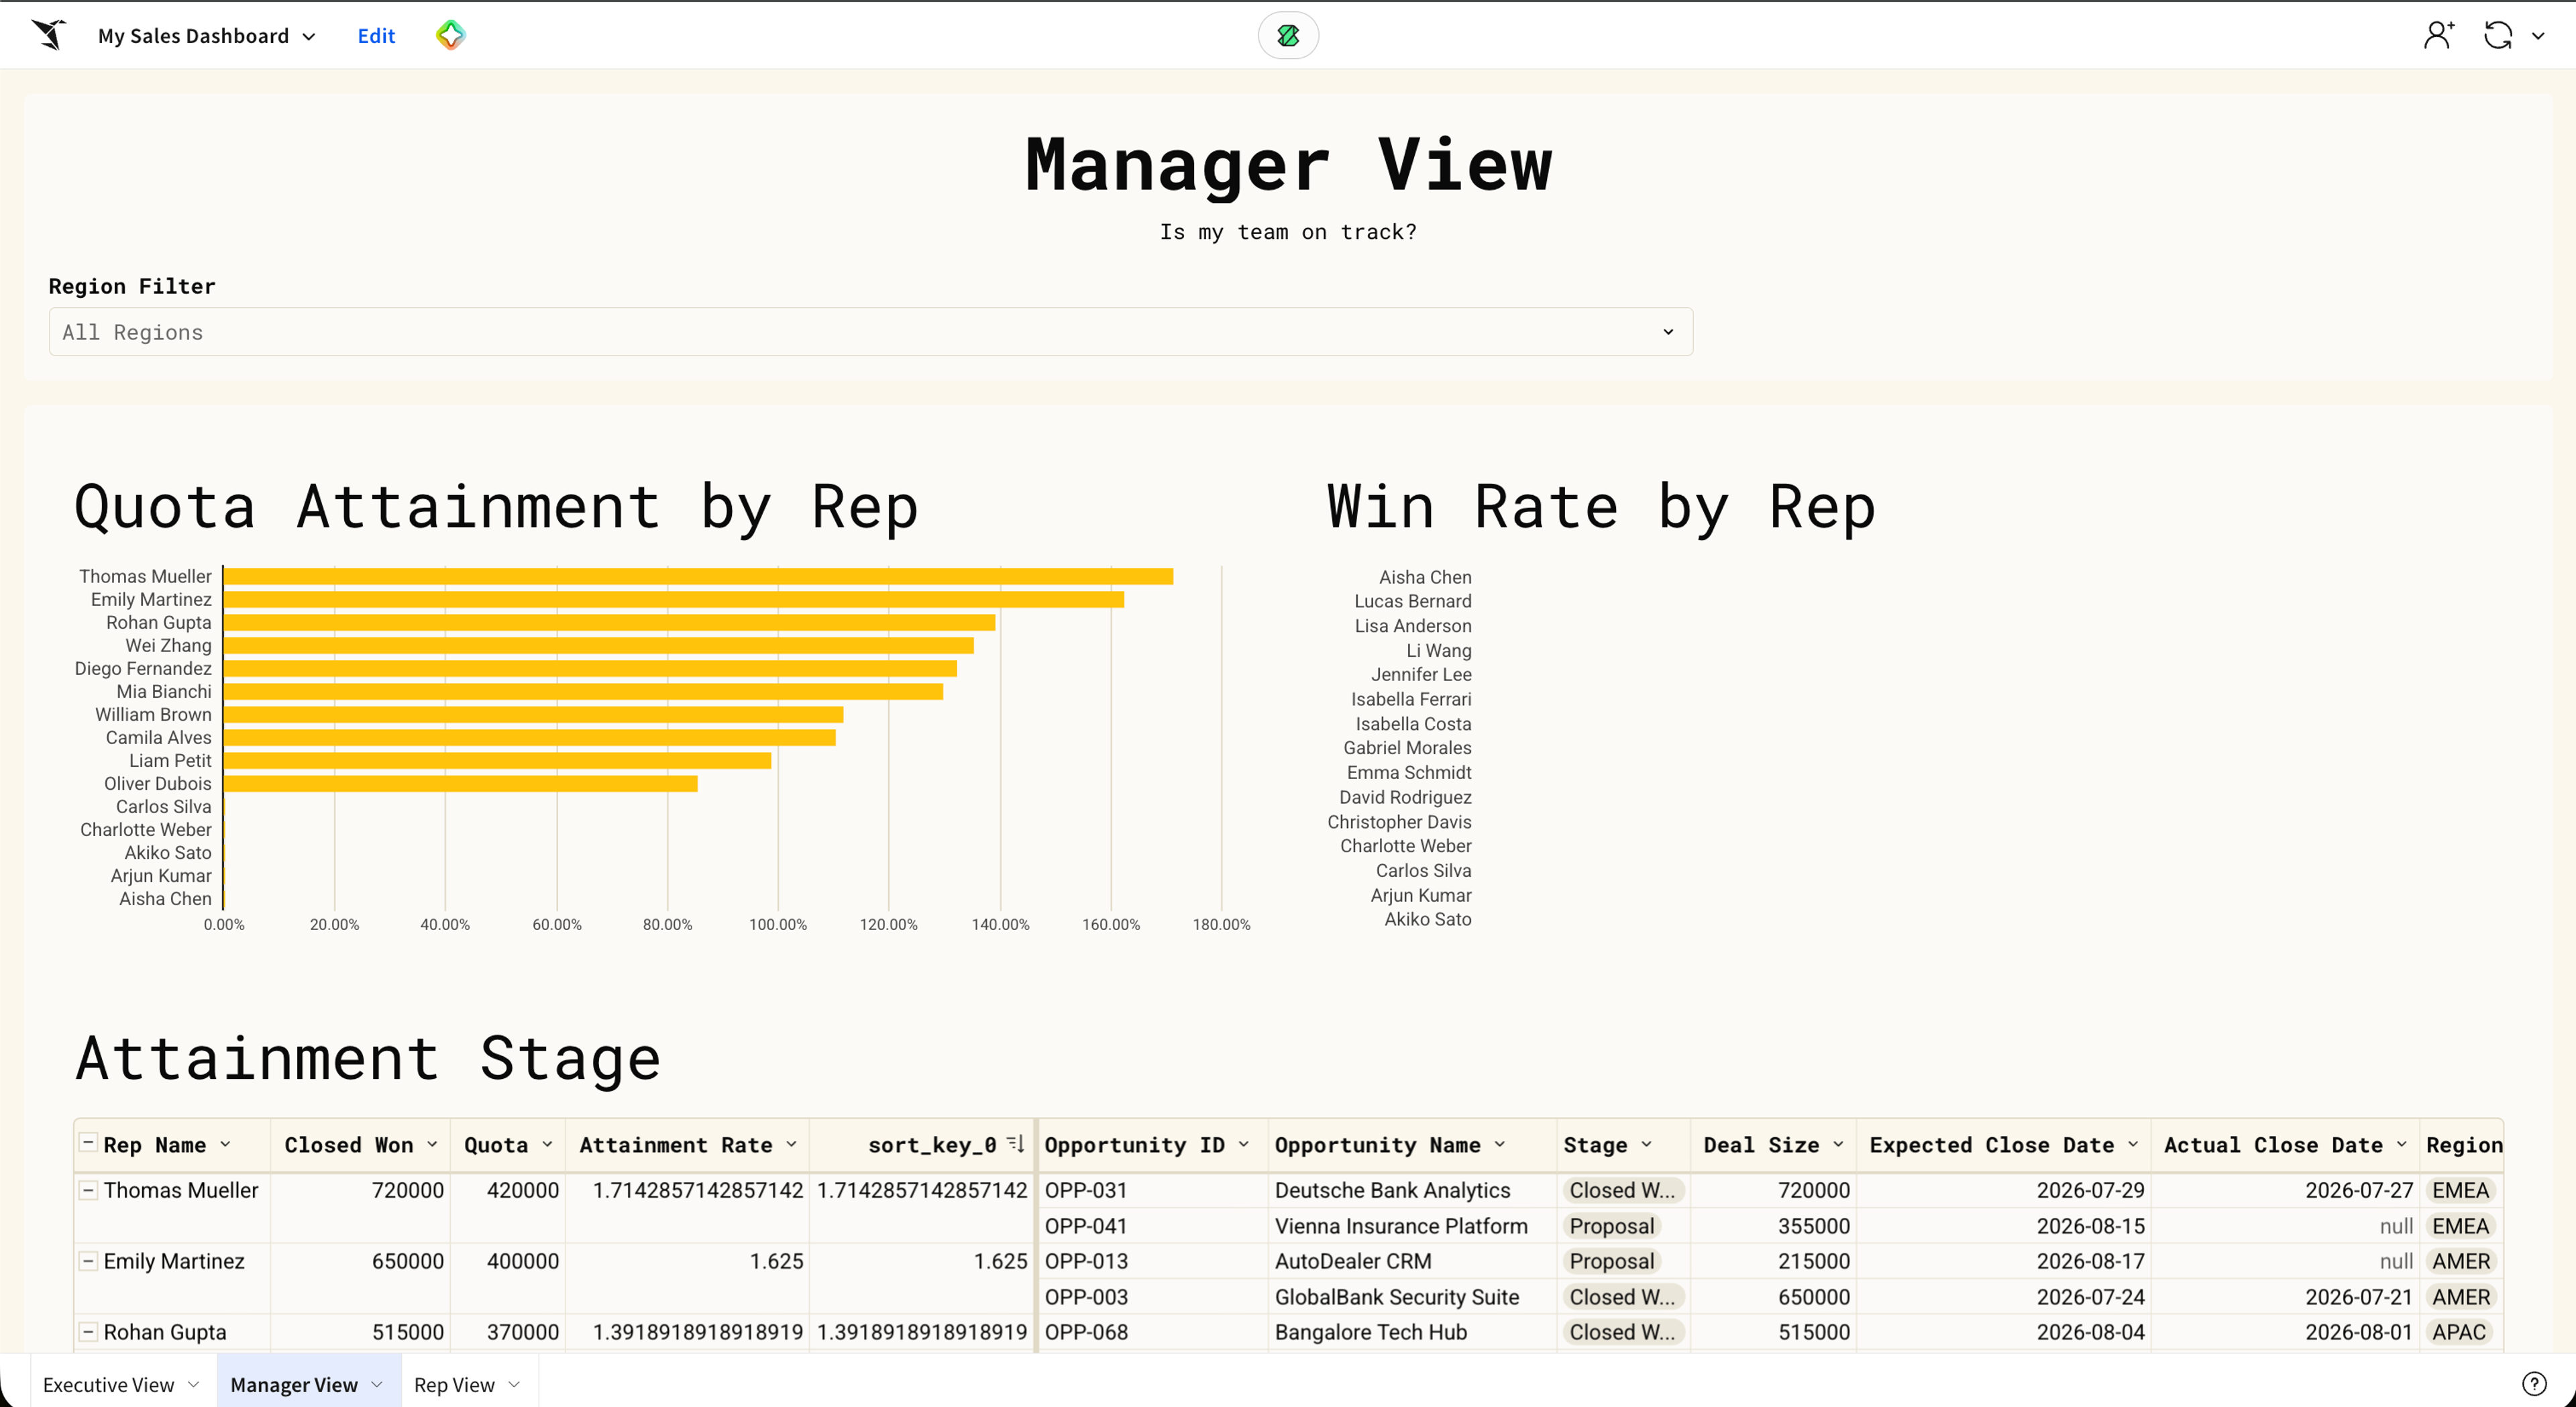
- Map the dashboard to a specific audience and decision. A rep view answers the question, "What should I work on today?" A manager view answers, "Is my team on track?" An executive view answers, "Will we hit the number?"
- Pick one primary question per view. If a single view tries to answer all three questions above, it serves none of them well.
- Choose the segments and grain it breaks down to. By rep for coaching, by region or product line for resource allocation, or by deal stage for pipeline health.
- Set the time frames and comparison periods that matter. Weekly for activity metrics, monthly for revenue trends, quarter-over-quarter for pipeline growth.
Get these answers locked before touching the data, so the dashboard maps to real decisions rather than to what's easy to chart.
Step 2: Prepare the data layer
The next step is to shape that data into something the dashboard can query directly. Most of the work happens in your transformation layer: building the joins, reconciliations, and refresh logic the metrics will depend on.
- Consolidate the sources into one modeled layer. Bring CRM, billing, and related systems together so the dashboard reads from a single set of tables rather than connecting directly to each source. Connecting source-by-source adds maintenance overhead every time an upstream schema changes.
- Confirm you can access every source you need. Map which system holds which data and who maintains it, and verify credentials before building.
- Encode reconciliation logic in your transformation layer. Reconcile CRM "closed won" with billing "invoiced revenue" upstream of the dashboard, so every downstream consumer reads the same number.
- Plan how you will keep the data current. Daily refresh works for most pipeline and deal data. Operational alerts may need event-driven or near-real-time updates. Document the cadence at each connection point.
Once the modeled layer is in place, every chart you build inherits the same reconciled, refreshed data rather than pulling its own.
Step 3: Choose the metrics that earn a place
A sales dashboard should track the metrics that drive the decisions you defined and leave everything else in deeper reports. The categories below cover most enterprise needs.
- Track pipeline and coverage metrics. Total pipeline value, pipeline coverage ratio (pipeline divided by quota), and deal slippage rate.
- Track activity and leading-indicator metrics. Calls made, emails sent, meetings booked, and new pipeline generated. These predict future performance and serve as coaching triggers for SDR and AE views.
- Track conversion and velocity metrics. Win rate, stage-to-stage conversion rates, average sales cycle length, and sales velocity (opportunities × average deal size × win rate ÷ cycle length).
- Track quota attainment and forecast accuracy. Show quota attainment at rep, team, and org level as a distribution so managers can see variation. Forecast accuracy (1 minus the absolute difference between the forecast and the actual, divided by the actual) closes the loop on planning reliability.
If a metric doesn't influence a decision the audience makes, it doesn't earn a place on the screen.
Step 4: Build, validate, and share
With the questions defined, data prepared, and metrics chosen, the build itself is mostly execution. Many sales dashboards don't go past the design stage because the team that defined the metrics can't build the models, and the team that can build the models doesn't know which metrics matter.
- Model the data into the structure your metrics require. Build one authoritative model per metric. Pipeline coverage, sales velocity, and quota attainment each need specific joins between CRM, billing, and quota data.
- Lay out views in order of the decisions they drive. Put the primary KPI where users see it immediately, then arrange the rest so they can scan from the summary to the supporting details.
- Build each visualization with the filters users need. Use a single chart with a territory filter rather than separate charts by region. Label stage-based views with counts and conversion rates.
- Validate the numbers against a trusted source before sharing. Check closed-won against billing and quota attainment against the compensation team's numbers. If the first thing someone notices is a discrepancy, adoption gets harder.
- Share the dashboard and set who can see each view. Apply the role-based access model from the prerequisites.
Once the dashboard is shared and the numbers reconcile, the build is complete. The work of keeping it useful starts the same week.
Best practices for a useful sales dashboard
A dashboard earns its place by helping the team make decisions faster, not by displaying more data. The habits below keep dashboards useful long after launch: three things to do, two things to avoid.
- Do focus each view on a single decision. Every chart should serve one question, and reviews should remove anything that isn't driving action.
- Do match the refresh cadence to the decision cycle. Activity metrics may need real-time updates; pipeline health operates on a daily cadence; and teams typically review revenue and forecast metrics weekly.
- Do design for action with brief annotations. Add short interpretive notes (for example, "Coverage is 2.4x in EMEA. Three deals pushed from Q3 to Q4") so meetings move straight to next steps.
- Don't let the dashboard grow into a kitchen sink. Resist the "one more thing" requests that stretch a focused view from six metrics to 20 and bury the decisions it was built to drive.
- Don't show stale data during live decisions. A dashboard showing out-of-date pipeline during a forecast call erodes trust immediately, and that trust is hard to recover.
When the dashboard stays focused, fresh, and prescriptive, it becomes the place teams actually run pipeline reviews from, not a screen they glance at before opening a spreadsheet.
How Sigma supports your sales dashboard build
Sigma is the runtime layer to build and scale analytics, apps, and agents on live data. It sits between your cloud data warehouse and the people building on it, turning AI Apps, dashboards, and agents into production-ready software that inherits your existing governance.
For sales, Sigma enables the team closest to the pipeline (RevOps, sales operations, finance partners) to build, adjust, and act on pipeline views directly in a familiar spreadsheet interface, without filing tickets or waiting on extracts.
Query live warehouse data without managing extracts
Sigma queries CRM, billing, and quota data once it's modeled in platforms such as Databricks, Snowflake, BigQuery, and Amazon Redshift. There are no extracts, no separate staging layer, and no parallel governance model to maintain. Row-level security and column-level security apply at query time, so IT keeps the guardrails and sales teams work from governed pipeline data without waiting on extracts.
Build dashboards in a familiar spreadsheet interface
The team that knows which metrics matter can build the dashboard themselves. Sigma's spreadsheet interface compiles more than 200 familiar formulas, pivots, and filters directly to warehouse SQL, so a RevOps analyst can build pipeline coverage, deal slippage, or quota attainment views without writing SQL or Python. When a VP asks to add a new breakdown to the manager view, someone on the RevOps team can add it directly rather than filing a ticket.
Keep every view running on live warehouse data
Sigma runs views on live warehouse data instead of extracts. There are no snapshots to manage, and no row-count ceiling beyond what the warehouse itself can handle. Workloads that crash legacy business intelligence (BI) or stall in Excel run live.
Update forecasts and deals from inside the dashboard
Sigma extends the sales dashboard from reporting into action. Native writeback through Input Tables lets reps and managers update forecasts, adjust commit deals, or reassign accounts inside the dashboard, and every change writes back to the warehouse with a record-level audit trail.
Sigma Assistant answers natural-language questions about pipeline directly inside the workbook. A builder configures Sigma Agents with instructions inside a workbook context, and the agent can then support scheduled or human-approved workflows such as flagging overdue deals, drafting commit summaries, or notifying managers.
Start building your sales dashboard on Sigma
A sales dashboard is worth building when the team trusts the numbers and can act on them inside the same workflow. Sigma is warehouse-native, so sales data stays where IT already secured it. A familiar spreadsheet interface lets the people closest to the pipeline build their own views. Live queries replace dashboard extracts and stale snapshots. Native writeback turns the dashboard into the place where teams make forecast adjustments and deal updates.
Get a demo or try Sigma free to build your first sales dashboard on live warehouse data.
Learn more: Sales dashboards are one way to put warehouse data to work. Sigma's own solutions engineering team took the same idea further, using AI to score and coach sales calls at scale. Read how it started with SE Buddy and scaled into AE Buddy.