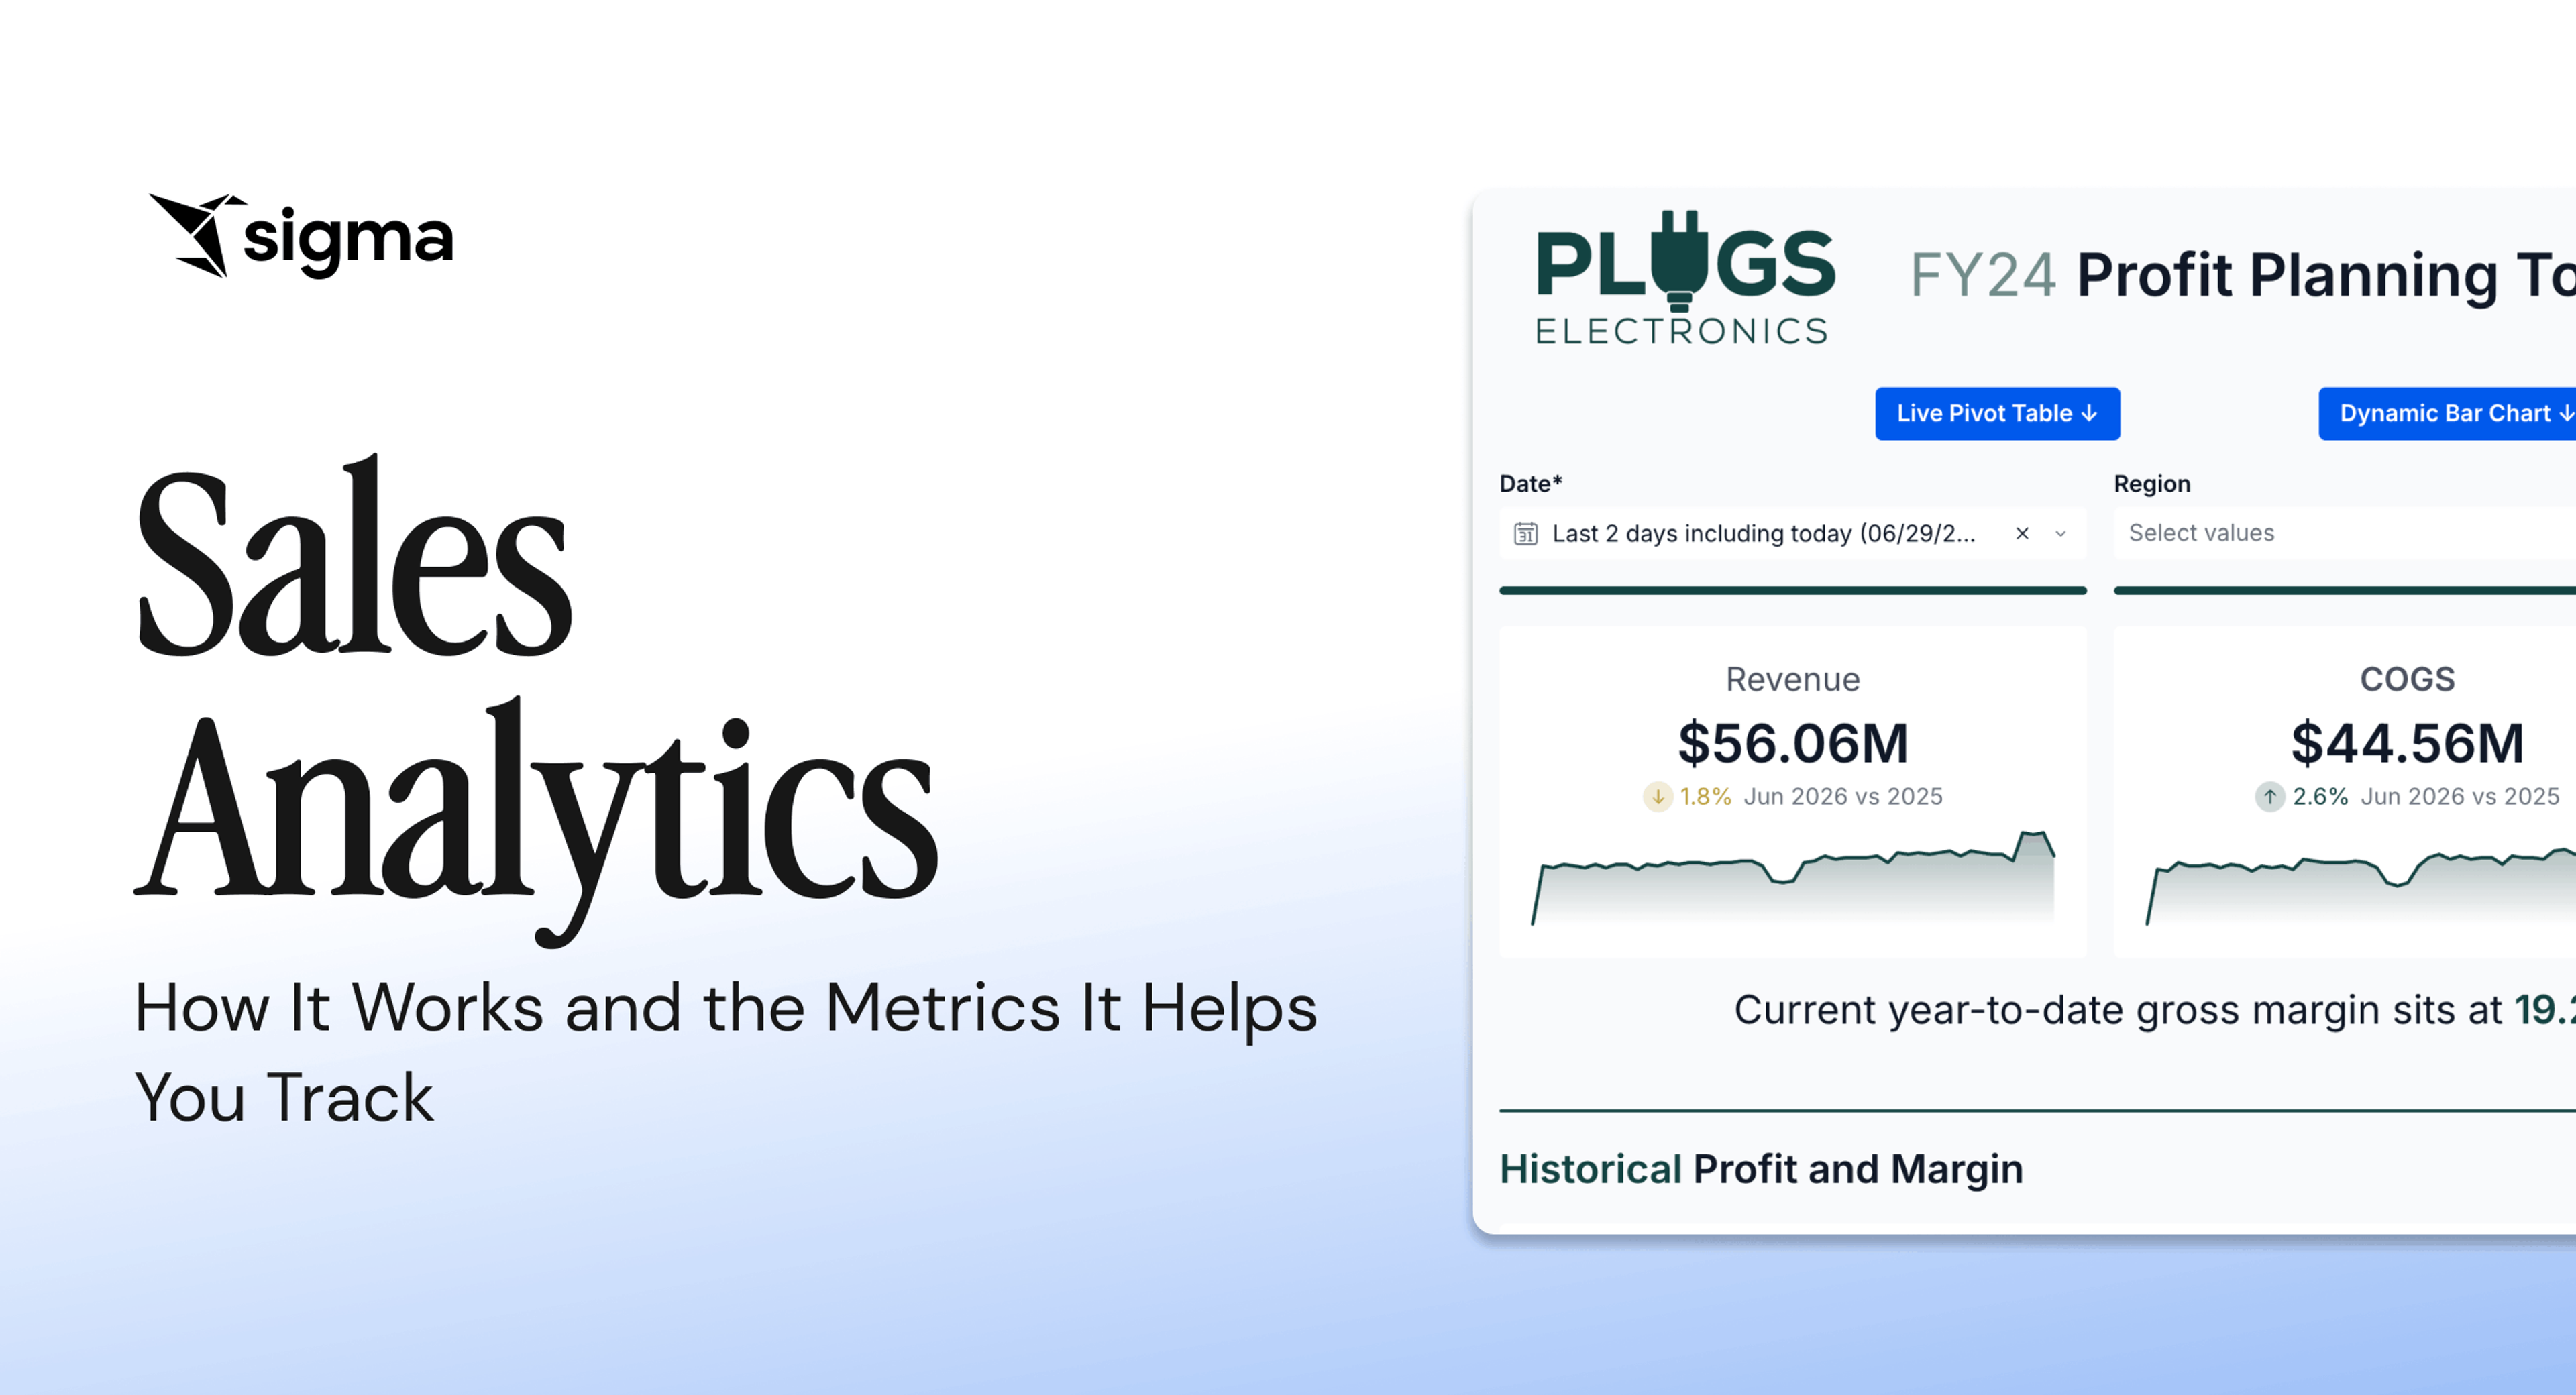
What Is Sales Analytics? How It Works and the Metrics It Helps You Track
It’s Monday morning, and your CRM dashboard shows the quarter tracking 12% behind plan, two large deals downgraded from commit to upside, and a rep who hasn’t logged an activity in nine days.
The dashboard shows you what’s happening, but stops short of why it’s happening or what to do next. You still need to decide which rep to coach first, which deal to rescue, and what number to present to leadership during the next meeting.
Sales analytics answers those questions, turning raw sales data into decisions—pipeline, revenue, and forecast quality decisions and actions. This article covers what sales analytics is, how the process works from raw data to decision, and the metrics worth tracking to tell whether your pipeline and forecast are healthy.
Key takeaways
- Insight that arrives after a deal stalls is reporting. Insight that arrives while the rep can still act is sales analytics.
- A team that reads its numbers well spots a stalling deal before it dies, catches a rep who needs coaching before quota slips, and forecasts a quarter the board can actually trust.
- The metrics that matter fall into three groups: pipeline and conversion, activity and productivity, and forecast and revenue.
- Sigma supports sales analytics with live warehouse data, governed metric definitions, native writeback, and AI Apps and Agents, all on a single platform.
What is sales analytics?
Sales analytics is the practice of collecting, measuring, and interpreting sales data to evaluate performance, forecast revenue, and guide decisions. It turns raw numbers from CRM systems, transactions, and pipeline activity into metrics like win rate, average deal size, and sales cycle length, so teams can see what is working and where to focus next.
What sets sales analytics apart from general business reporting is its focus on the movement of revenue rather than its record. Finance reporting closes the books on what has already happened. Sales analytics looks at deals still in flight, the behavior of the reps working them, and the probability that the quarter lands where leadership expects it to.
Who uses sales analytics and how
Sales analytics is a shared discipline. Several functions analyze the same data for different decisions:
- RevOps: owns the infrastructure and the metric definitions that keep numbers consistent across reports and teams.
- Sales leadership: uses the output to set targets, allocate territory, and decide where to invest.
- Frontline managers: lean on it to coach reps and triage deals in their book before the quarter slips.
- Finance: pulls from the same data to model revenue, validate the forecast, and stress-test the plan.
When these groups share one trusted view, sales analytics turns shared data into aligned decisions.
4 types of sales analytics
Sales analytics operates across four core analytics techniques, each answering a different question.
- Descriptive analytics: summarizes historical data (deal volume by stage, revenue by region, win rate over time) to tell you what already happened.
- Diagnostic analytics: uses drill-down, segmentation, and correlation to explain why the numbers moved.
- Predictive analytics: applies historical patterns and statistical models to forecast outcomes such as deal close probability, revenue projections, and churn risk.
- Prescriptive analytics: recommends specific actions (reassign reps, apply a structured discount, increase SDR outreach in a target vertical) and depends on the highest data quality of the four, because earlier errors carry through into the recommendation.
In practice, these four types of sales analytics often overlap. A pipeline review starts descriptive, turns diagnostic when a number looks off, leans predictive at the point of forecasting, and ends prescriptive when someone decides what to do next.
The key metrics that sales analytics help you track
Sales analytics pulls scattered data into a single view so you can track the metrics that change decisions. They group into three categories that map to the questions sales leaders ask most.
Pipeline and conversion metrics
The pipeline and conversion group answers one question: Are deals moving, and where are they getting stuck? Five common metrics businesses use to track these:
- Win rate
- Conversion rate by funnel stage
- Sales cycle length
- Pipeline coverage
- Lead-to-opportunity rate
Sales analytics shows its value here by breaking down aggregate funnel numbers. A win rate that looks flat company-wide can hide a 12-point drop in one segment, and a healthy coverage ratio can mask a single region carrying the whole pipeline. Drill-down, segmentation, and cohorting turn these metrics from a status report into a diagnosis.
Activity and productivity metrics
Sales analytics connects activity to outcomes, so the team can tell which behaviors actually produce pipeline and revenue. Five metrics carry most of the load in this group:
- Quota attainment
- Activities per rep
- Pipeline generated per rep
- Average deal size
- Ramp time for new reps
Raw activity volume is a poor signal of productivity on its own, and a rep who logs 200 calls in a week isn’t necessarily outperforming a rep who logs 80. The relationship between activity and productivity matters more than ever, given that sales reps spend much of their time on non-selling tasks.
Plotting that relationship is based on the ratios. Activity-to-opportunity rates, opportunity-to-pipeline-dollar conversion, and ramp curves by cohort let managers coach the behaviors that move the number, so managers coach for effective behavior rather than sheer volume. Sales analytics makes those ratios visible at the rep level in a current view of the data, while there’s still time to adjust the coaching call.
Forecast and revenue metrics
The forecast and revenue metrics reflect the numbers leadership commits to and the board holds them accountable for. Five metrics anchor the conversation:
- Forecast accuracy
- Revenue growth rate
- Net revenue retention (NRR)
- Customer lifetime value (CLV)
- Customer acquisition cost (CAC)
Sales analytics improves the confidence behind every number here because the forecast is only as good as the data feeding it and the discipline of the process around it. Your CRM already tracks these numbers, and sales analytics helps you to spot the gap between commit and actual so you can make necessary adjustments.
How sales analytics works
Sales analytics takes in raw sales activity data at one end and produces a revenue decision at the other.
Raw activity lands from multiple data sources
CRMs log opportunity stages and activity touches. Billing and ERP record invoices, subscription events, and revenue recognition. Product systems emit usage telemetry. Marketing platforms capture campaign attribution and lead source. None of these systems was designed to interoperate with the others. They update on different cadences, use different schemas, and define the same underlying event in incompatible ways.
Fragmented data flows into a reconciliation layer
Once that fragmented data lands in a central location, the next problem surfaces: the same customer, deal, or revenue event appears differently depending on which system you trust. A CRM records a closed-won deal at contract signature. Billing records revenue upon invoice payment, often days or weeks apart and at different amounts.
Without explicit rules on which system governs each entity, cross-system joins produce conflicting totals, and the team ends up arguing over whose number is right instead of addressing the underlying pipeline issue.
Reconciled data takes shape as defined metrics
Clean, reconciled data isn’t a metric yet. Data teams translate it into the definitions the business actually reads: Monthly Recurring Revenue (MRR), churn, win rate, sales cycle, pipeline coverage. The team has to define each one consistently, or the same metric ends up calculated differently across different reports. Data quality checks, lineage tracking, and freshness monitoring belong at this layer as well, because every downstream report inherits the assumptions from this layer.
Metrics travel into the selling workflow
A win rate that lives only in a BI dashboard changes nothing if the rep who could act on it never opens that dashboard. Most reps and managers still work within CRMs, email, spreadsheets, and sales engagement tools, rather than dedicated analytics surfaces.
The metrics have to reach those workflows—into the rep’s CRM record, the manager’s coaching note, the RevOps planning sheet—or the insight goes unused.
Decisions feed back into the data layer
The final handoff is the one many sales analytics programs skip. When a manager re-forecasts a deal, when RevOps adjusts a quota assumption, when a rep updates a stage, that decision is itself new data, and it needs to land somewhere so the next analysis can read it. Otherwise, the forecast in the dashboard and the rep’s working view of the deal drift apart within a day, and every forecast cycle starts from a stale baseline.
How Sigma supports live sales analytics workflows
Sigma is the runtime layer for building and scaling analytics, apps, and agents on live cloud data warehouse data. For sales teams, Sigma delivers a single surface with a suite of features that enable business users to analyze live warehouse data, write back decisions, and build agentic workflows without ever pulling the data out.
Sigma runs natively on Databricks, Snowflake, BigQuery, and Amazon Redshift, with a familiar spreadsheet interface that compiles every formula, filter, and pivot into SQL that the warehouse executes. There are no extracts, no proprietary modeling language, and no row-count ceiling beyond what the warehouse itself can handle.
That architecture maps directly to the five handoffs of a sales analytics program. Once the data lands in the warehouse from the CRM, billing, ERP, and product systems, Sigma handles reconciliation, modeling, and delivery, feeding it back into a single governed dataset.
Reconcile and model on a single governed dataset
Sigma’s spreadsheet interface lets RevOps and sales leaders slice billions of rows of pipeline data by rep, segment, deal size, or source without writing SQL or waiting on the data team. Metric definitions such as win rate, MRR, and forecast accuracy are defined once, in the way your business actually uses them, and shared across every workbook, dashboard and AI app through dbt Semantic Layer integration, Snowflake Semantic Views, or Sigma’s predefined metrics. That’s a different proposition than the canned metrics that ship with point solutions built around a generic sales process. When your win rate calculation reflects your actual sales motion (how you count multi-product deals, how you handle late-stage withdrawals, where you draw the line on a “closed” opportunity) the number is defensible. The “whose number is right” debate stops at the metric layer.
Deliver insight to the workflows where reps actually sell
A win rate that lives only in a BI dashboard changes nothing. Sigma’s AI Apps are low-code applications that combine analytics with sequenced actions, modals/pop-ups, and notifications, so pipeline reviews, deal desk approvals, and quota planning happen on the same surface the team uses to run the deal. The dashboard stops being the destination. The work itself becomes the surface on which decisions are made.
Feed decisions back into the data layer
The moment a forecast changes, that change should be in the data—not tomorrow, not after someone updates a spreadsheet and emails it to the analyst who refreshes the dashboard on Friday morning. Now.
Forecast adjustments, quota assumptions, and deal stage changes write back to the warehouse through Sigma Tables the moment a rep or manager makes them, with a full audit trail covering the original record, the new record, who changed it, and when. No middle layer. No reconciliation step. No version confusion. The next analysis—whether that’s a manager’s pipeline review ten minutes later or an agent flagging at-risk deals overnight—runs against the updated state of the business, not a snapshot of what it looked like yesterday.
For a sales org, that gap between decision and data isn’t just an inconvenience. It’s where bad calls compound. Sigma closes it.
Ask questions and trigger actions with Sigma Assistant and Sigma Agents
Sigma Assistant is the AI surface inside Sigma, and it works in two distinct modes.
A sales manager using Analyze with Sigma Assistant can ask, in plain language, why the mid-market win rate slipped last week and verify the answer down to the underlying table. A RevOps lead using Build with Sigma Assistant can describe the inputs they want for a new pipeline review workbook for Friday’s call and get a working draft on the canvas.
Sigma Agents extend that pattern into autonomous work. A builder configures a scoped agent with plain-English instructions, defined data access, and a specific set of Sigma actions. The agent can flag at-risk deals, generate scenario models, trigger Slack notifications, or write back to an Input Table. Everything runs inside the permissions of the user who called it.
Governance that the IT team already trusts
Because Sigma runs on the warehouse, row-level security and column masking carry through automatically. No reconfiguration, no exceptions, no shadow copies of sensitive data floating somewhere outside of your control.
Sigma’s AI capabilities run on the cloud-hosted LLMs your organization already uses and trusts (Snowflake Cortex, Databricks model serving, and others). Your data stays in your environment, governed by the same policies your security team put in place. The risk of external exposure is dramatically reduced, and in many configurations, eliminated entirely.
IT keeps the guardrails. Business teams get the speed. And nobody has to file a security review to ask a question about a pipeline.
Get started with sales analytics on Sigma
Sales analytics shows its value when a rep, manager, or RevOps lead makes a different decision because of the data.
Sigma makes that moment routine. A manager spotting a stalled deal in their Friday pipeline review can adjust the forecast on the same surface, write the change back to the warehouse, and trigger a Slack notification to the rep, all before the call ends.
Try Sigma free or get a demo to see sales analytics running on your warehouse data.