How a manufacturing finance team turns a margin variance into a corrected forecast on Sigma


Every quarter, a manufacturing finance team has to explain what happened to the margin. The P&L shows product revenue, manufacturing variance, and gross profit quarter by quarter, and when a number moves the wrong way, such as a manufacturing variance spike in Q3, finance owns the explanation for why it happened and what the company is going to do about it.
The problem is that finance can see the miss but cannot fix it. The cause usually sits in operations, in a few SKUs missing their yield targets, and the corrective action belongs to engineering, supply chain, and operations. That work has traditionally lived in spreadsheets, email threads, and one analyst's head, disconnected from the P&L, so the number that flags the problem and the action that resolves it never meet. Building custom software to connect them was never worth a full engineering project, and a static dashboard only reports the quarter after it has already closed.
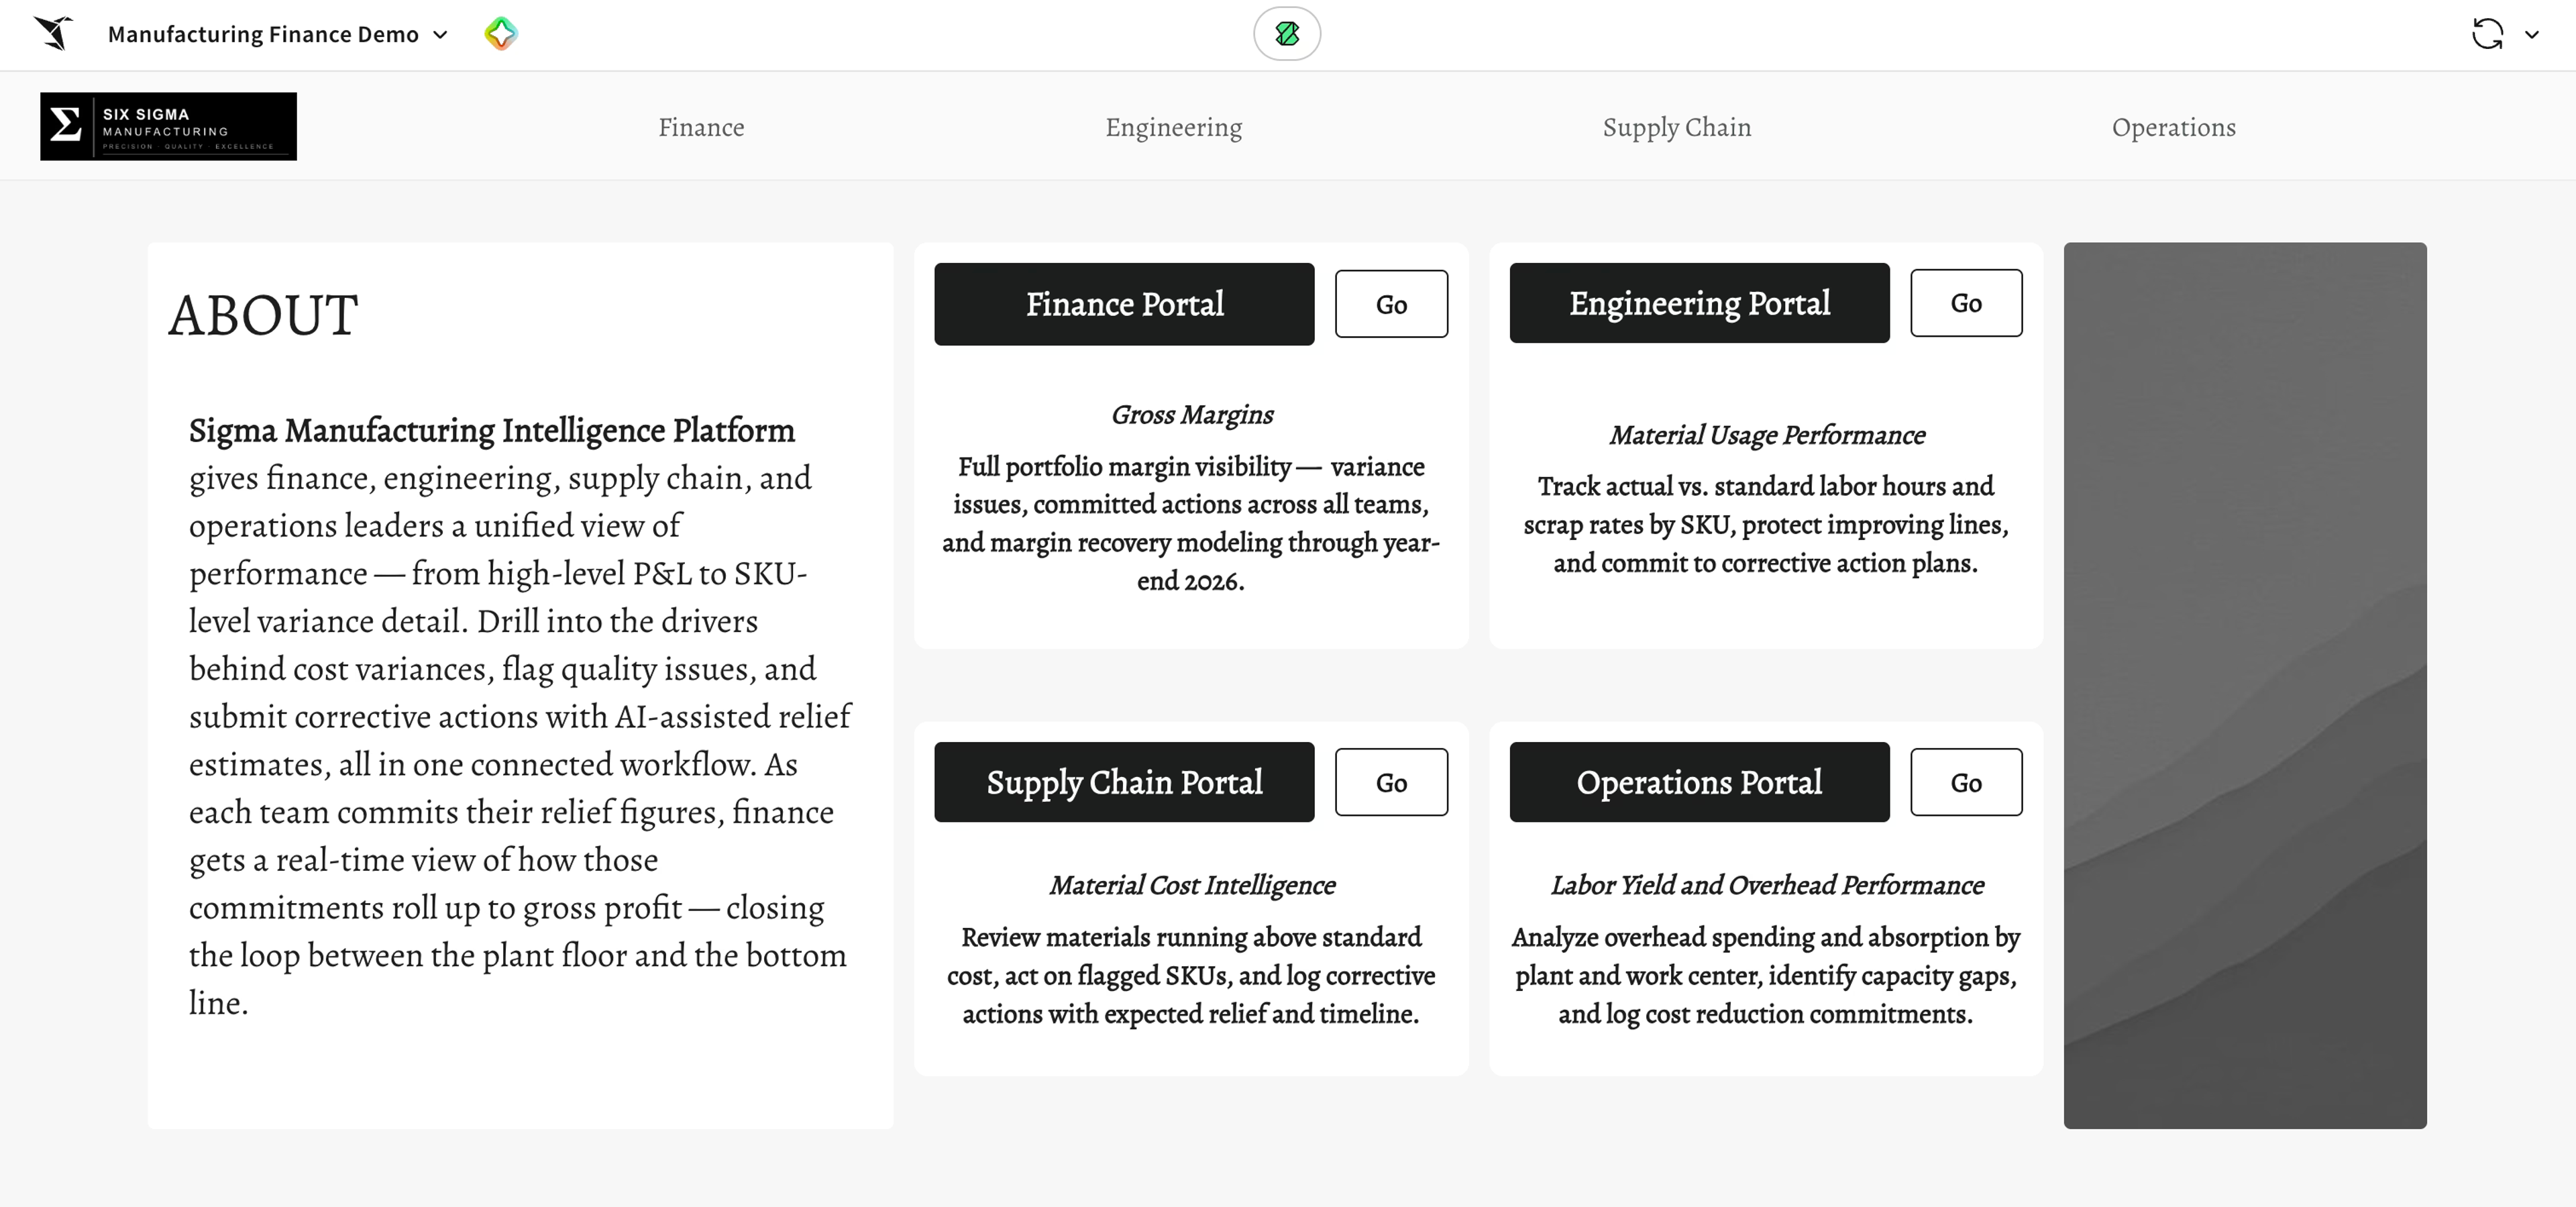
Sigma closes that gap. In an example app a manufacturing finance team could build on Sigma, finance and its business partners read from live warehouse data and write back to it, so the screen that surfaces the variance is the same screen where they investigate it, log the fix, and watch the forecast update.
Much of the work runs on Sigma Agents, now in public beta: AI agents that live inside the workbook, read the same view the analyst is looking at, and take governed action once a person approves it. Because the app inherits row-level security from the warehouse, (through Databricks Unity Catalog in this example), everyone reaches only the data and the agents they are cleared for.
7 steps to run manufacturing FP&A on a Sigma AI App with agents
Here's an example of how a finance team and its business partners could run margin variance and corrective action in one Sigma app, following a single variance from the P&L to a corrected 2027 forecast. Every step reads from the same governed warehouse data and writes each action back, so the number and the fix that changes it never live apart.
1. Read the P&L and find the variance
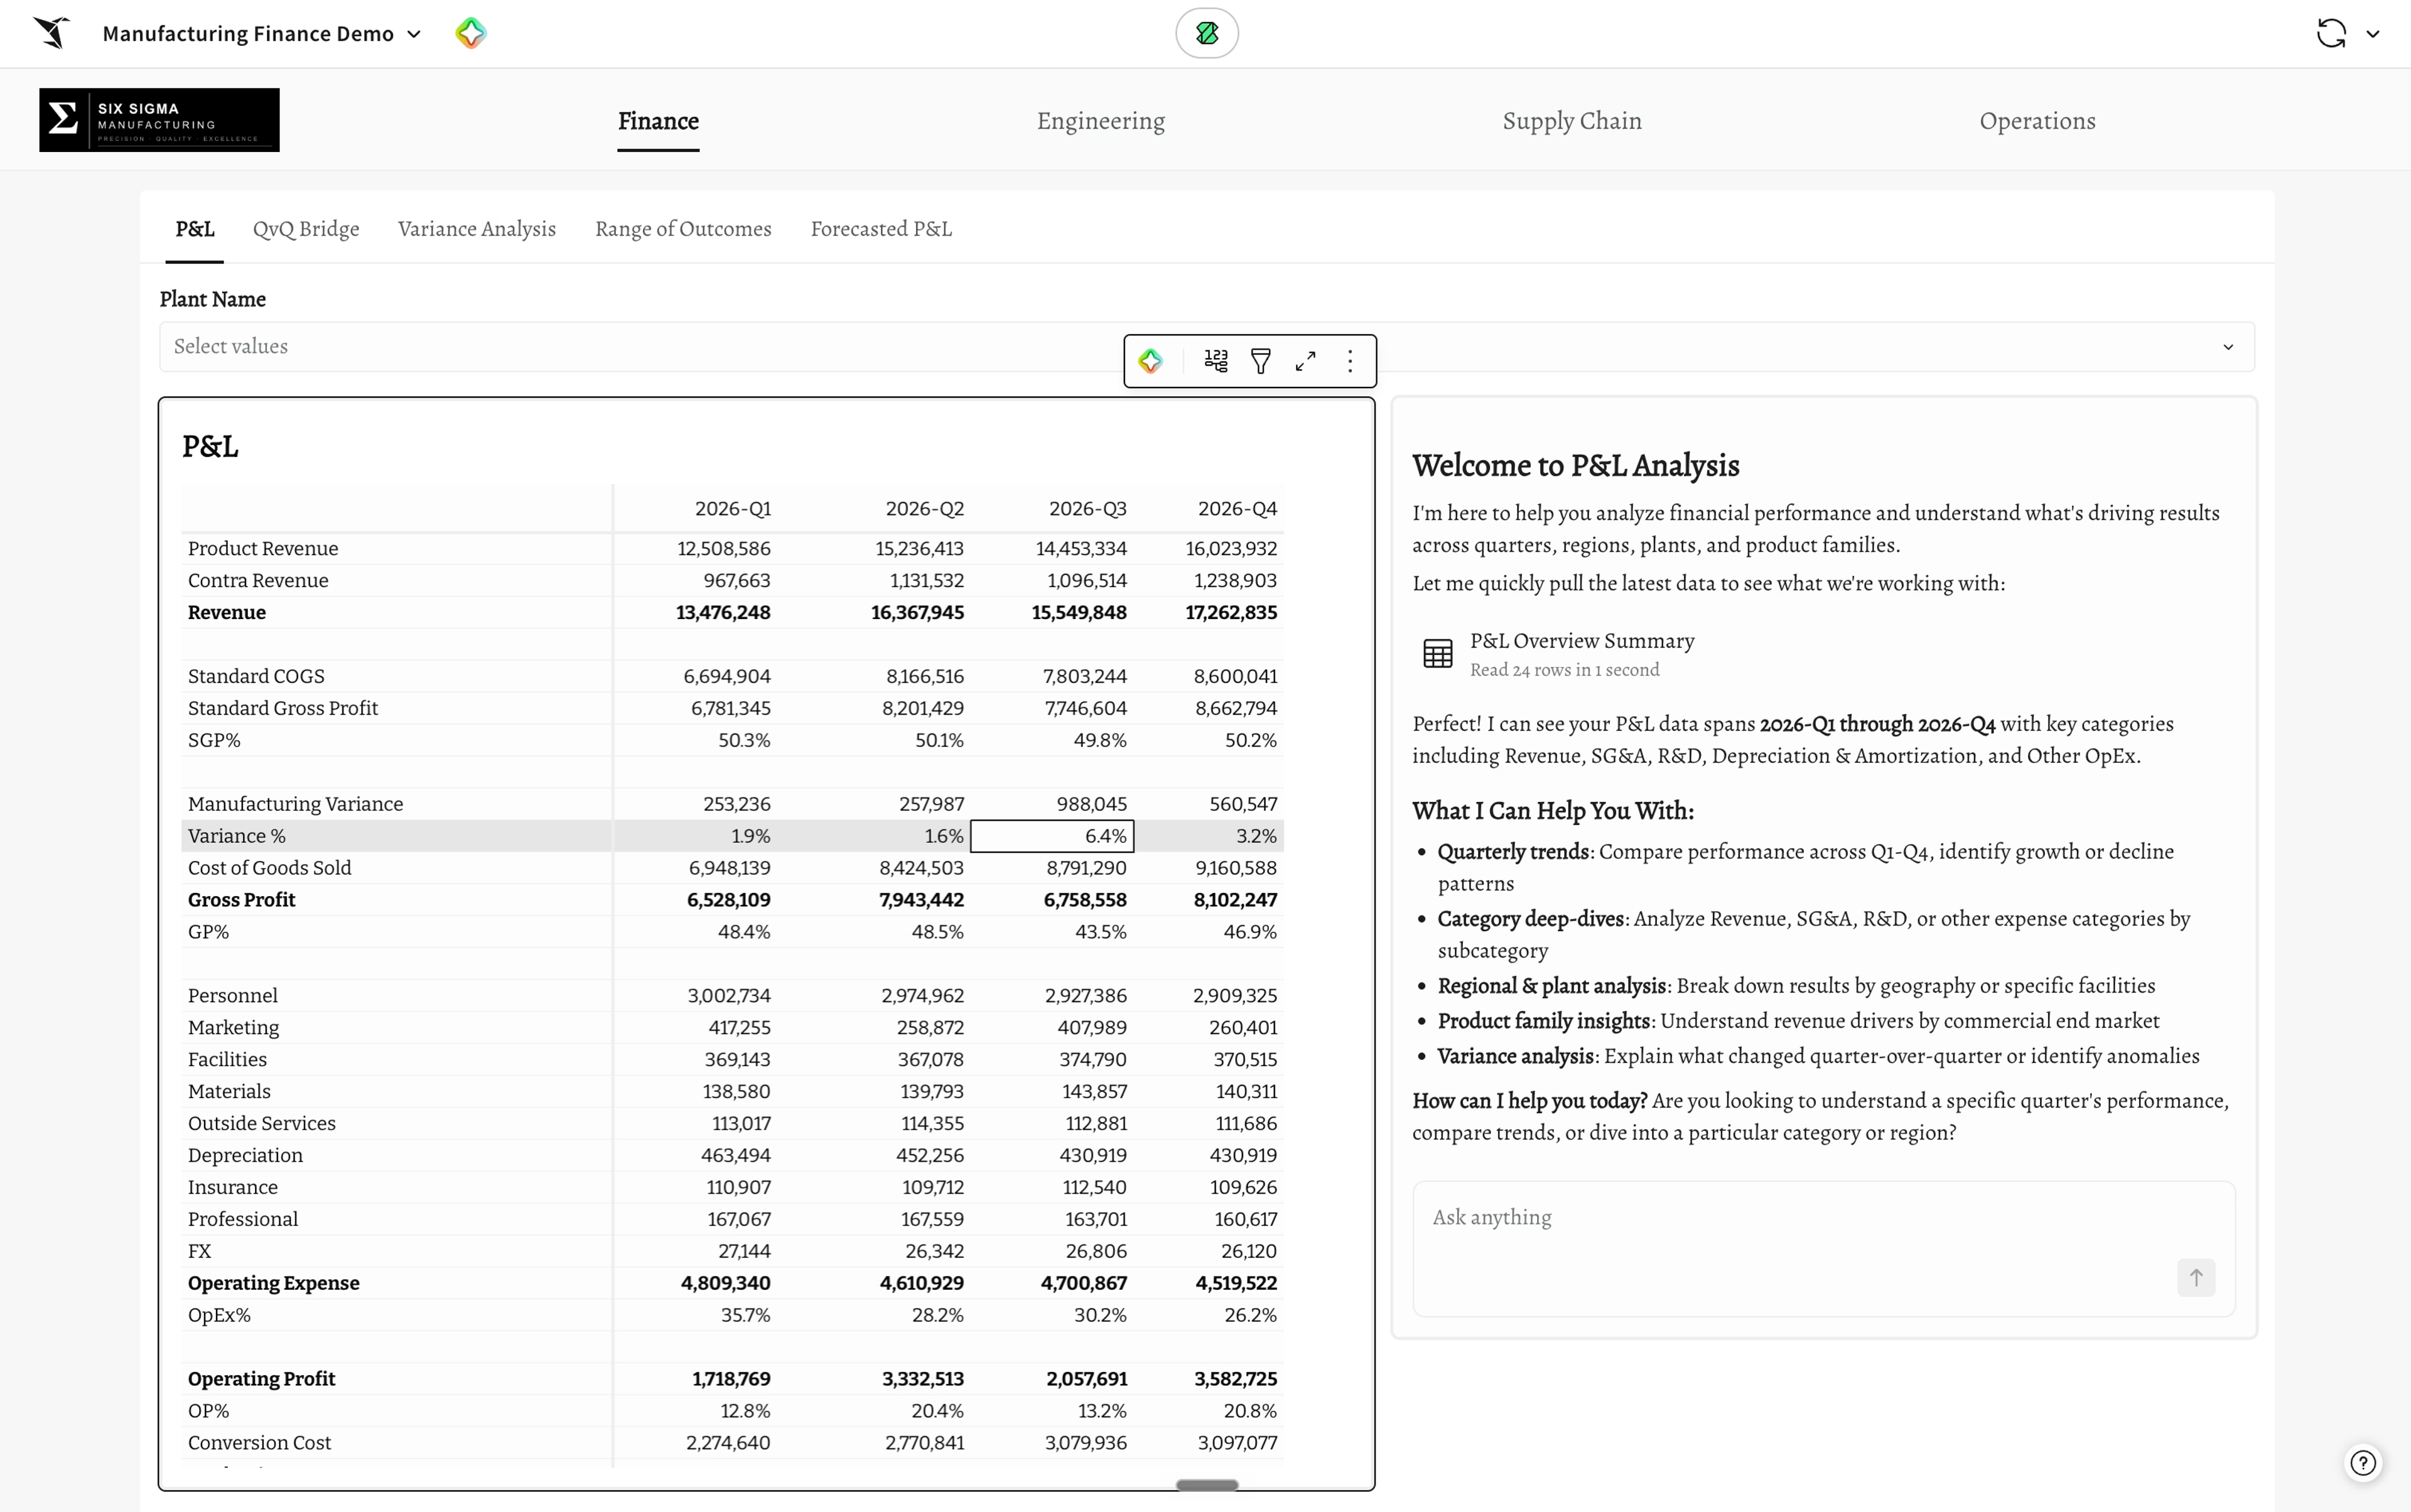
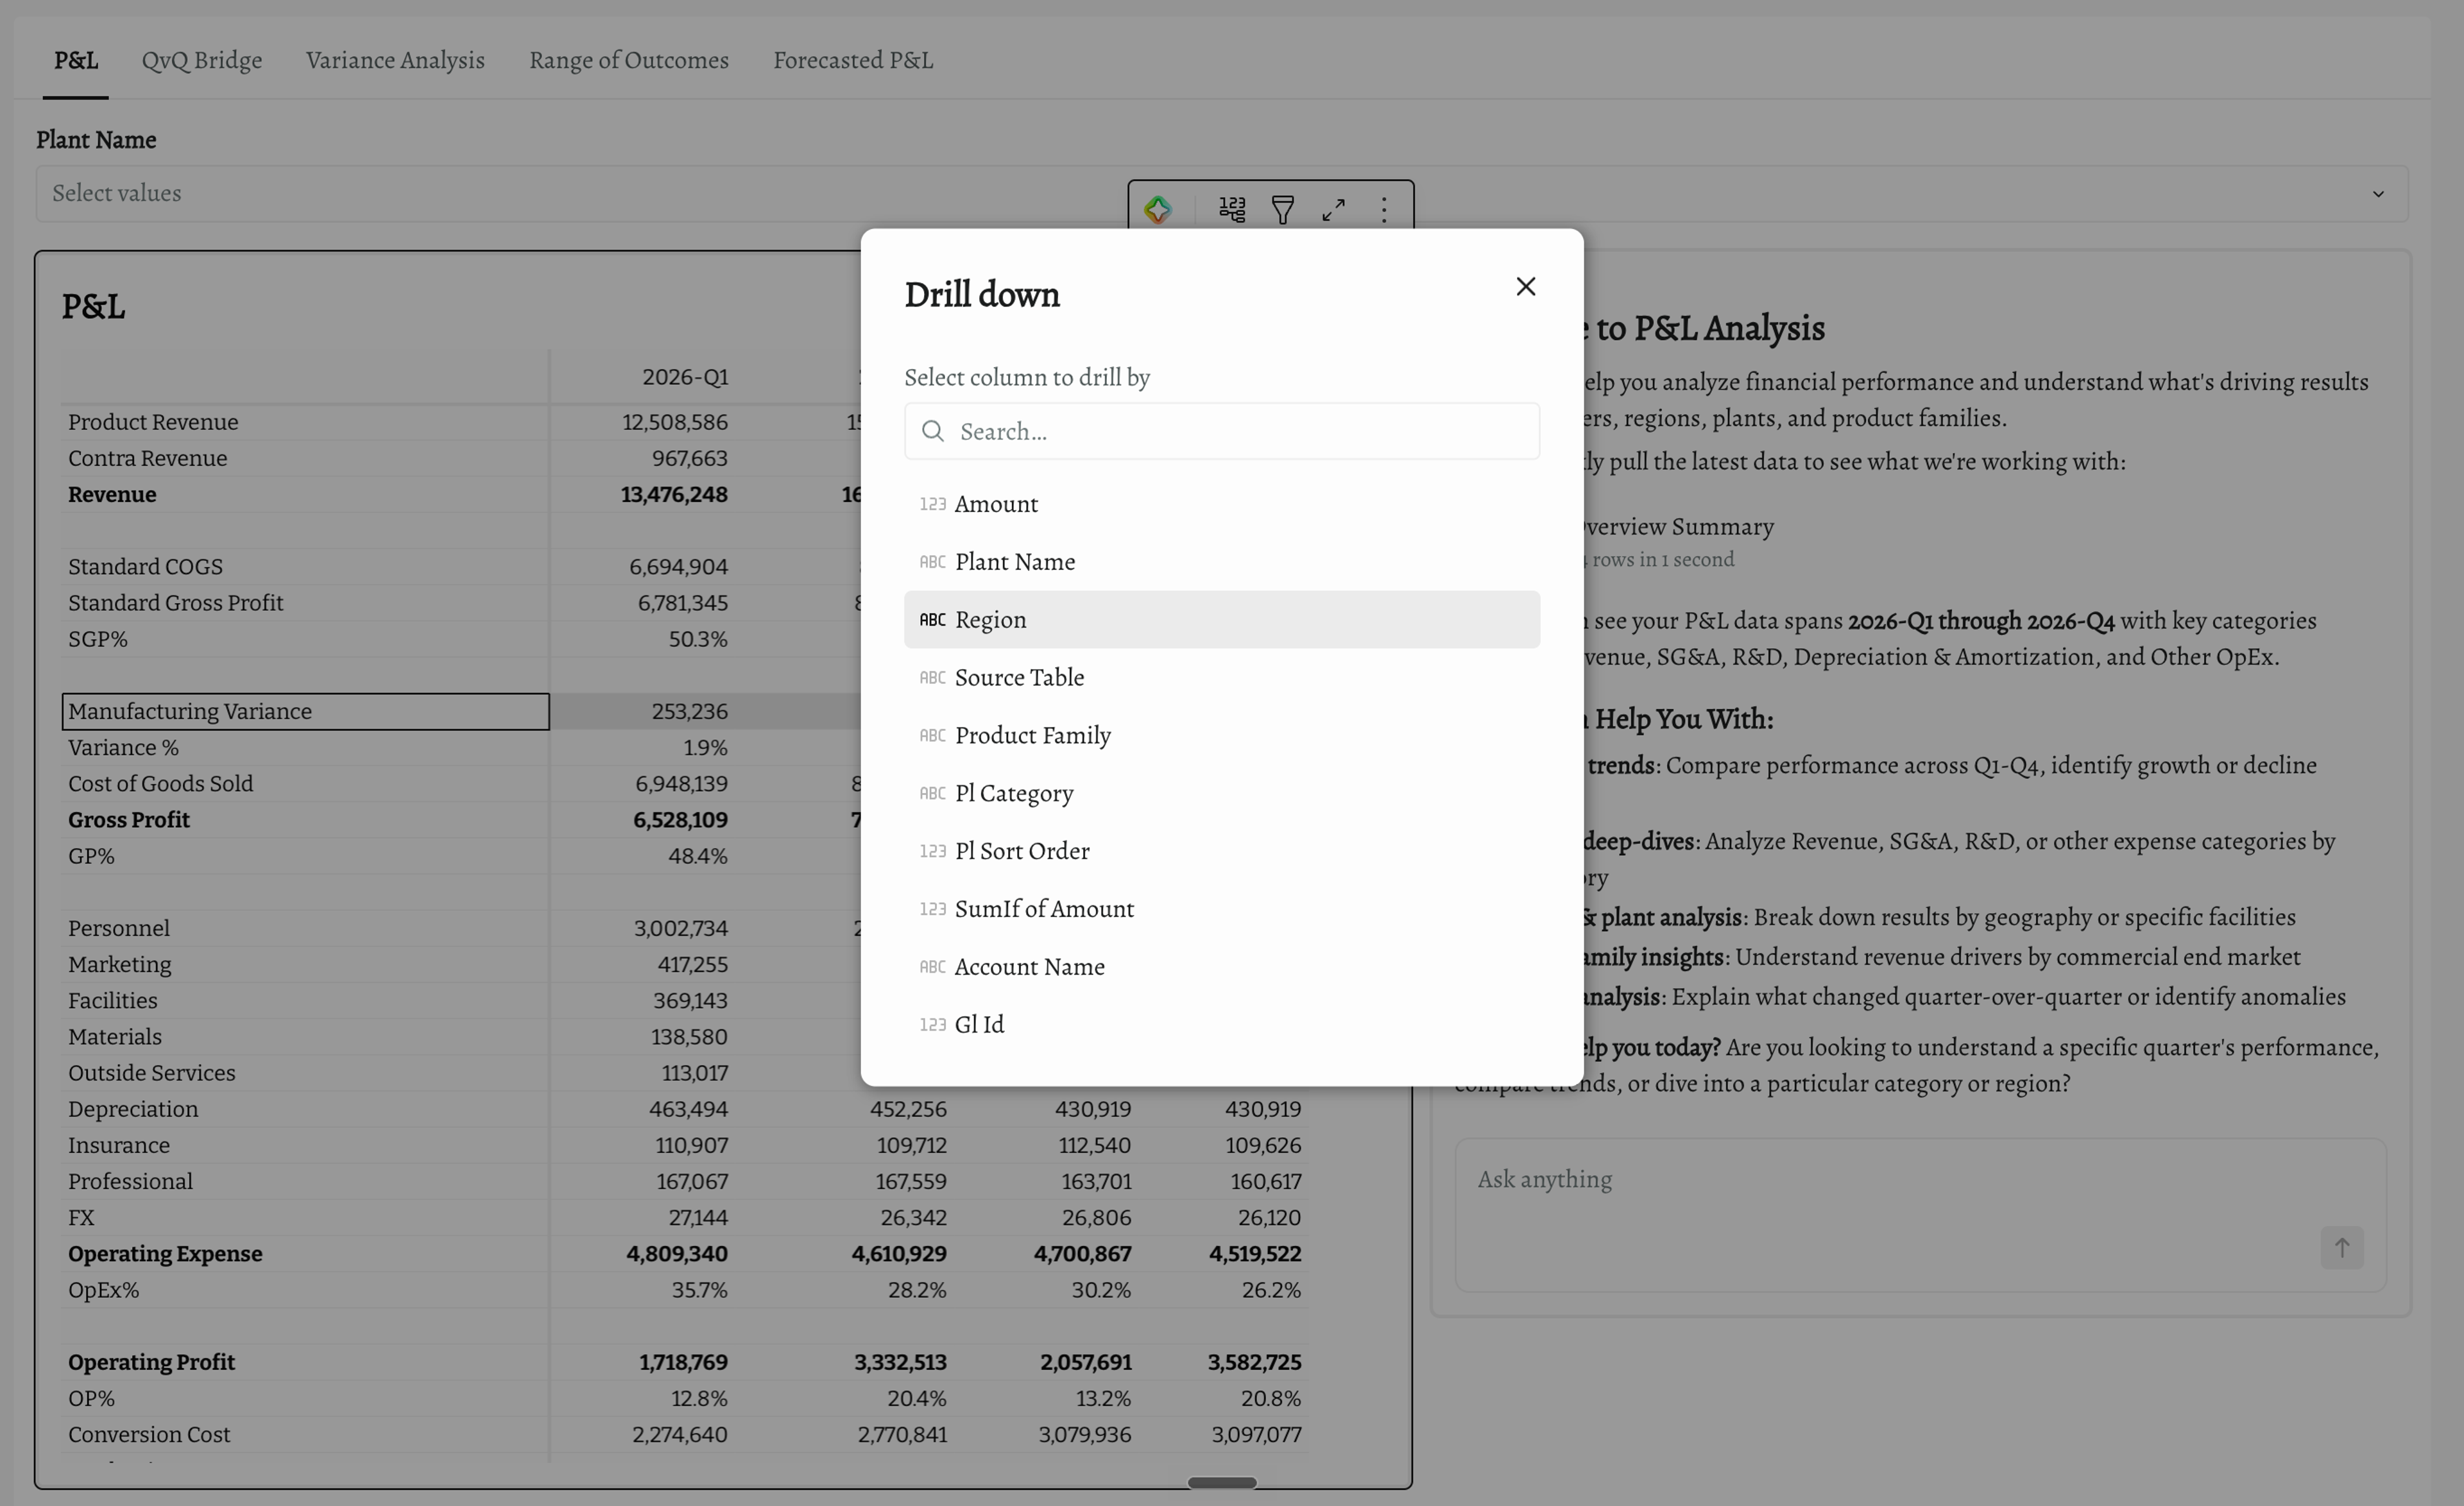
The app opens on a live P&L, quarter by quarter, so the analyst starts from the numbers the whole company trusts. From Q1 to Q4 they can read product revenue, manufacturing variance, and gross profit, and the Q3 variance spike is visible at a glance. From any figure they drill down along region, plant, or account, moving from the headline number toward the place the variance actually came from.
2. Ask a warehouse agent what's driving the miss
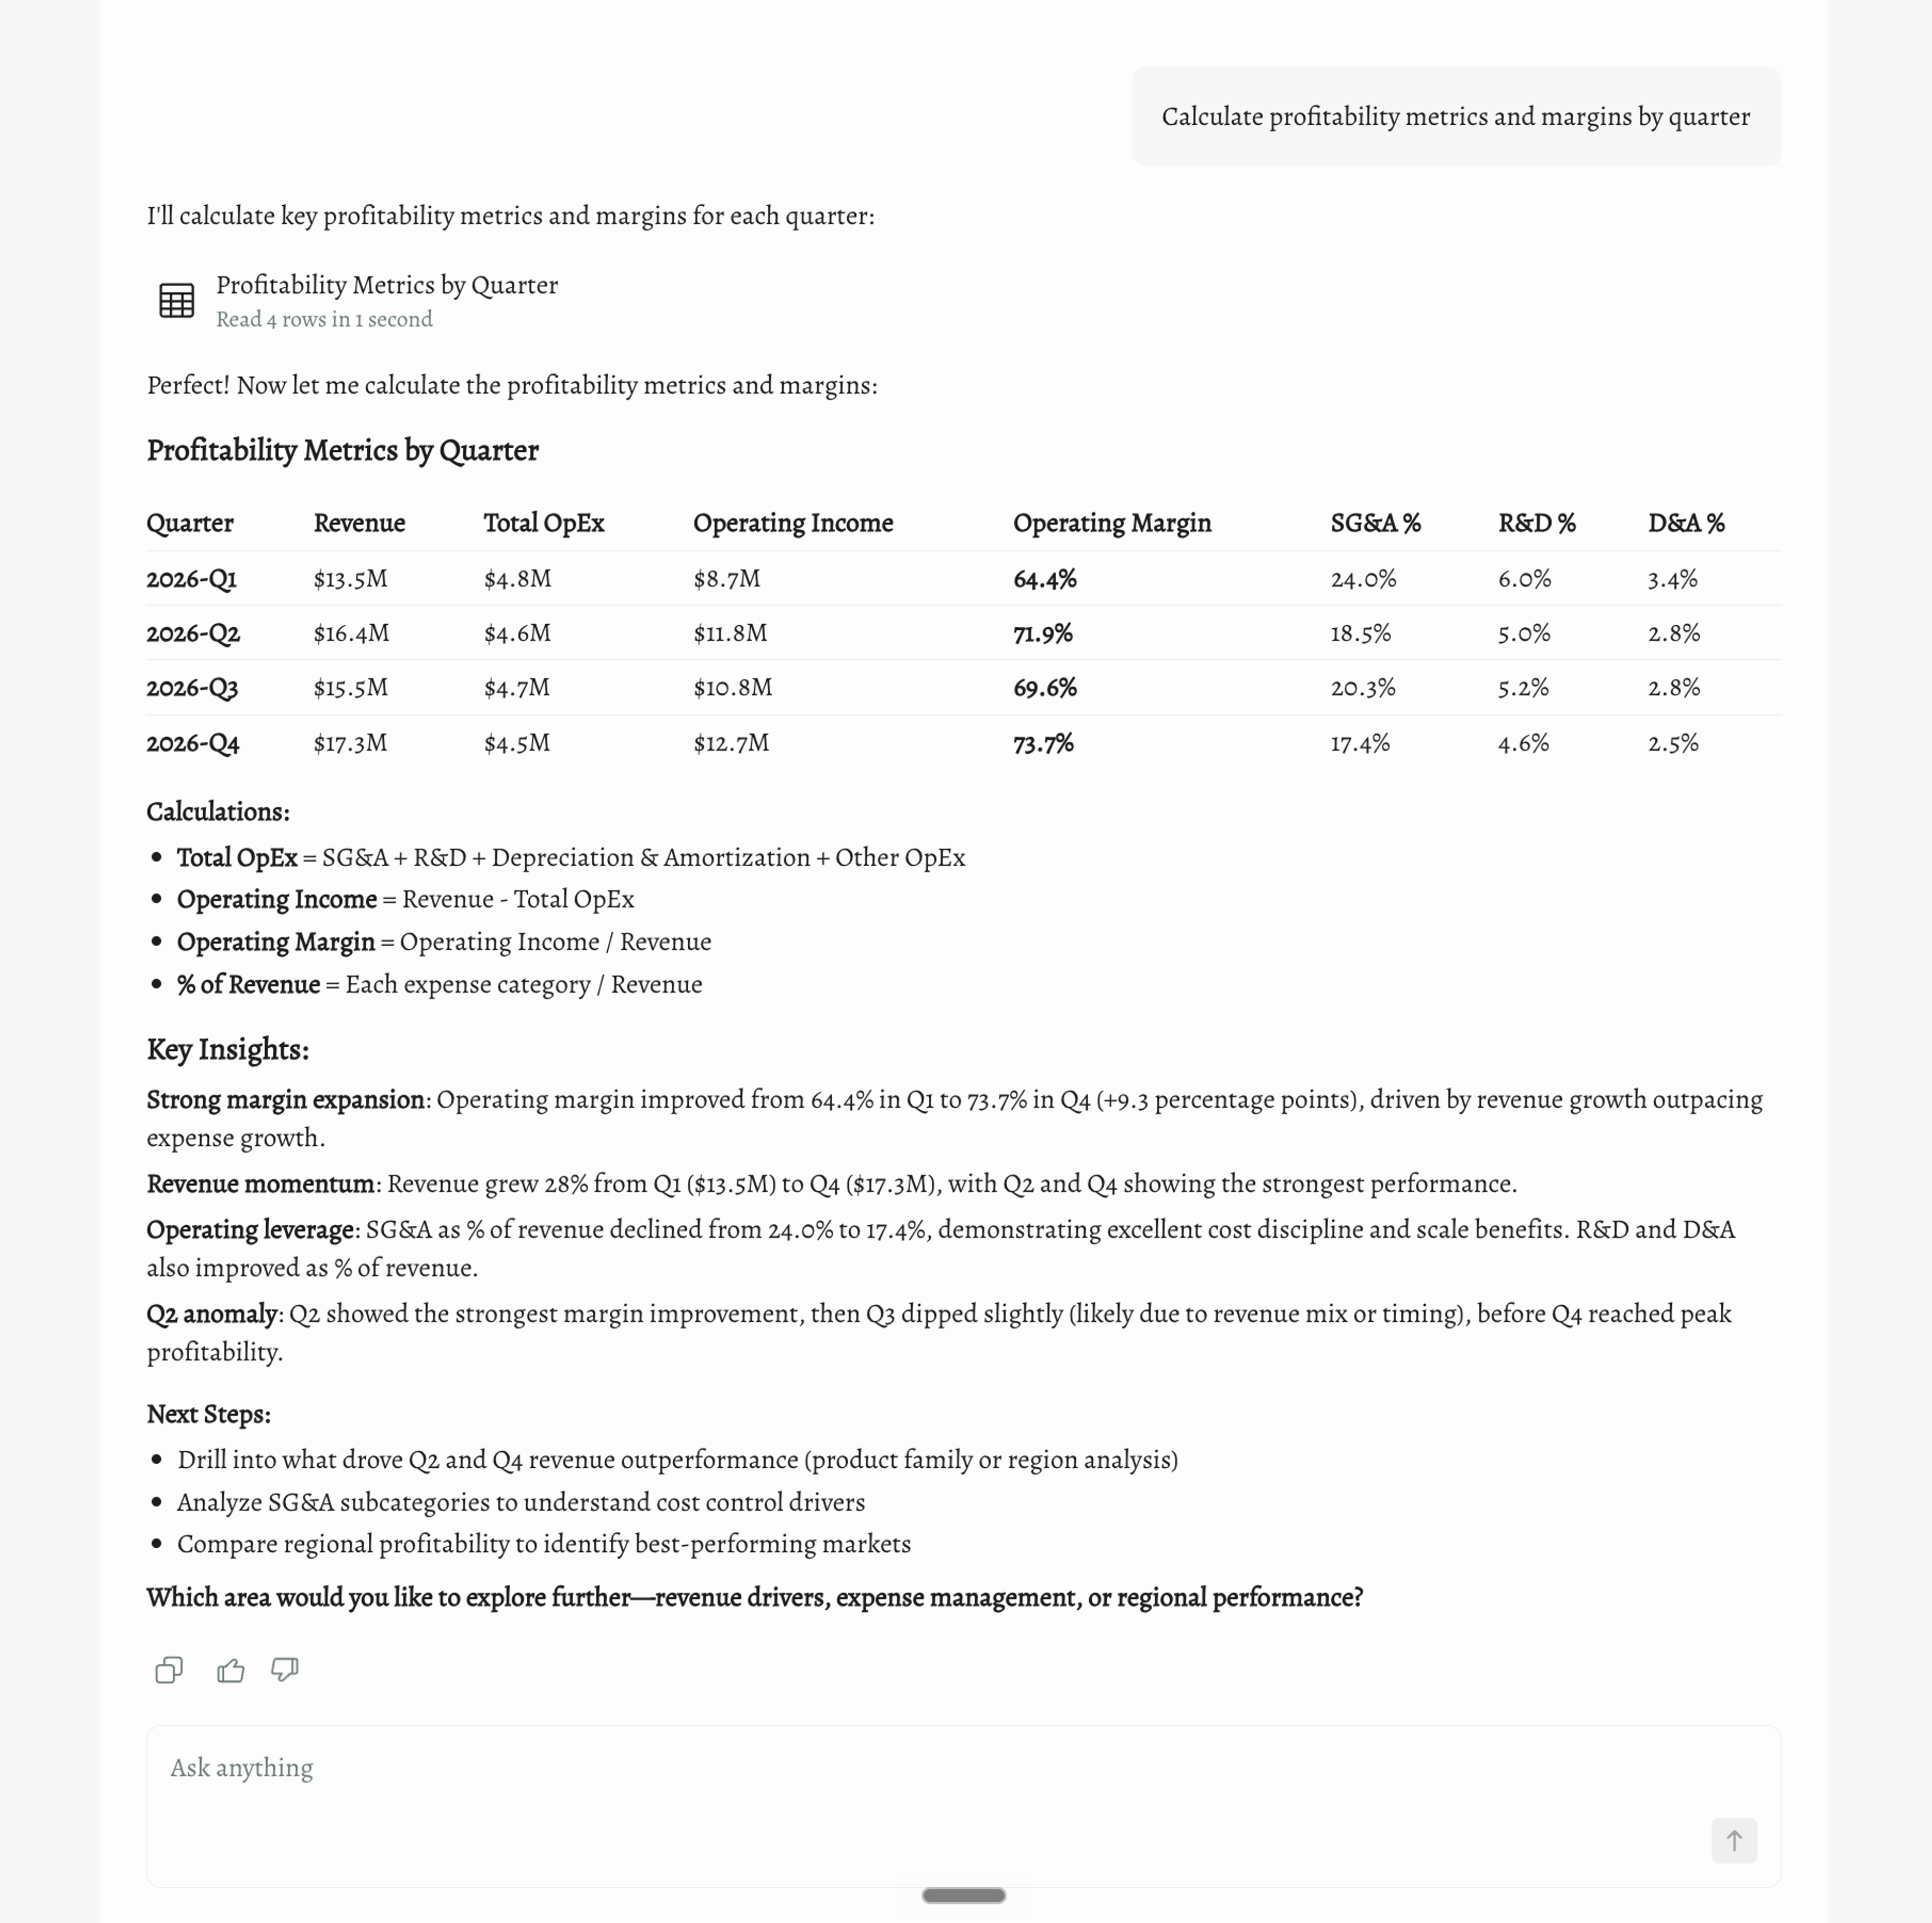
Drilling shows where the variance sits; a warehouse agent explains why. The analyst tags in a warehouse agent, a Databricks Genie space, and asks it to read the quarter. It returns a set of key insights and recommended next steps in plain language, calling out the full-year margin expansion, the revenue momentum behind it, and the Q3 dip that breaks the trend, then pointing to where the analyst should drill next. Because the agent reaches only the Genie spaces and data the analyst is cleared for through Unity Catalog, the answer stays inside the same governance as the P&L.
3. Quantify the Q2-to-Q3 move with a quarter-over-quarter bridge
The P&L shows Q3 operating profit came in below Q2, and the QvQ Bridge tab quantifies why. The analyst sets the comparison quarter to Q2 and the current quarter to Q3, and Sigma builds an Operating Profit Bridge: a waterfall that walks operating profit from 3,332,513 in Q2 to 2,057,691 in Q3, attributing the drop across revenue change, unit economics, change in manufacturing, and SG&A.
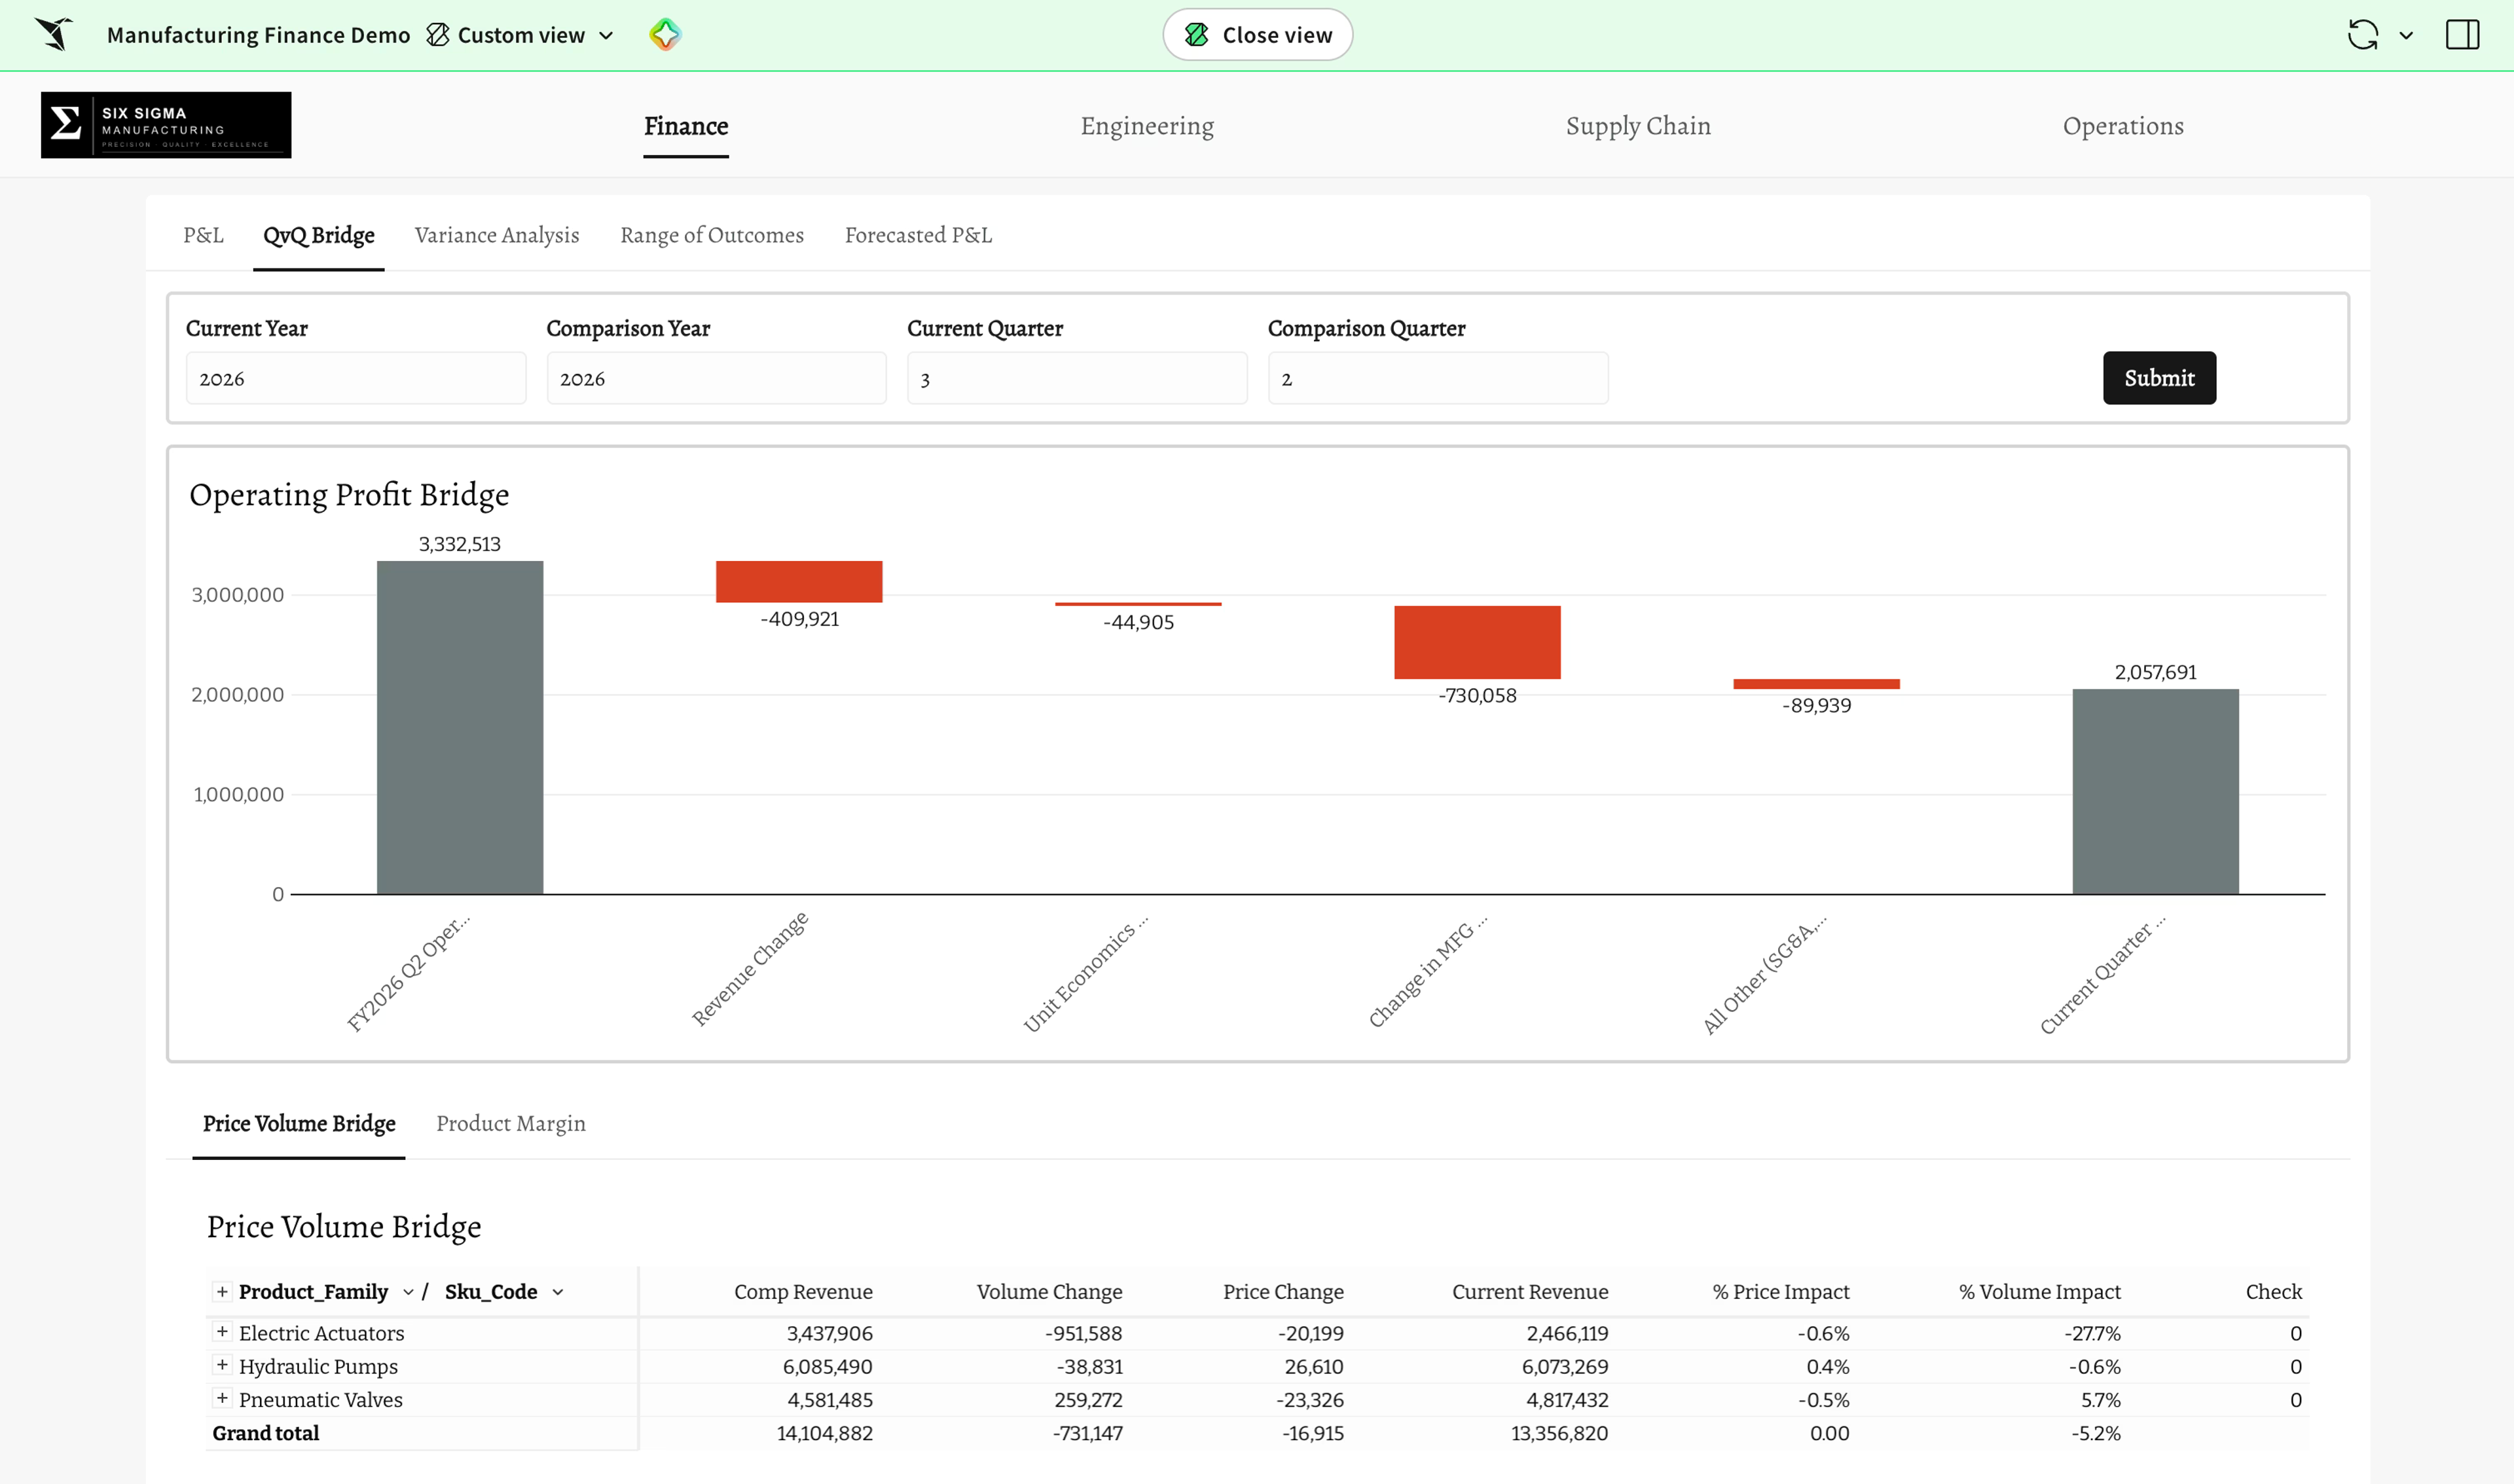
A Price Volume Bridge underneath splits the revenue change into price and volume effects by product family and SKU. The bridge shows how much of the shortfall came from manufacturing rather than revenue, giving the analyst a specific question for variance analysis: which SKUs are behind it.
4. Trace the variance to the SKUs that own it
The variance analysis attributes the grand total to the partners who own it: engineering, operations, and supply chain. Open engineering and the app shows material usage and cost by SKU, with the average yield for each, so a yield problem on a specific part becomes visible instead of staying buried in an aggregate.
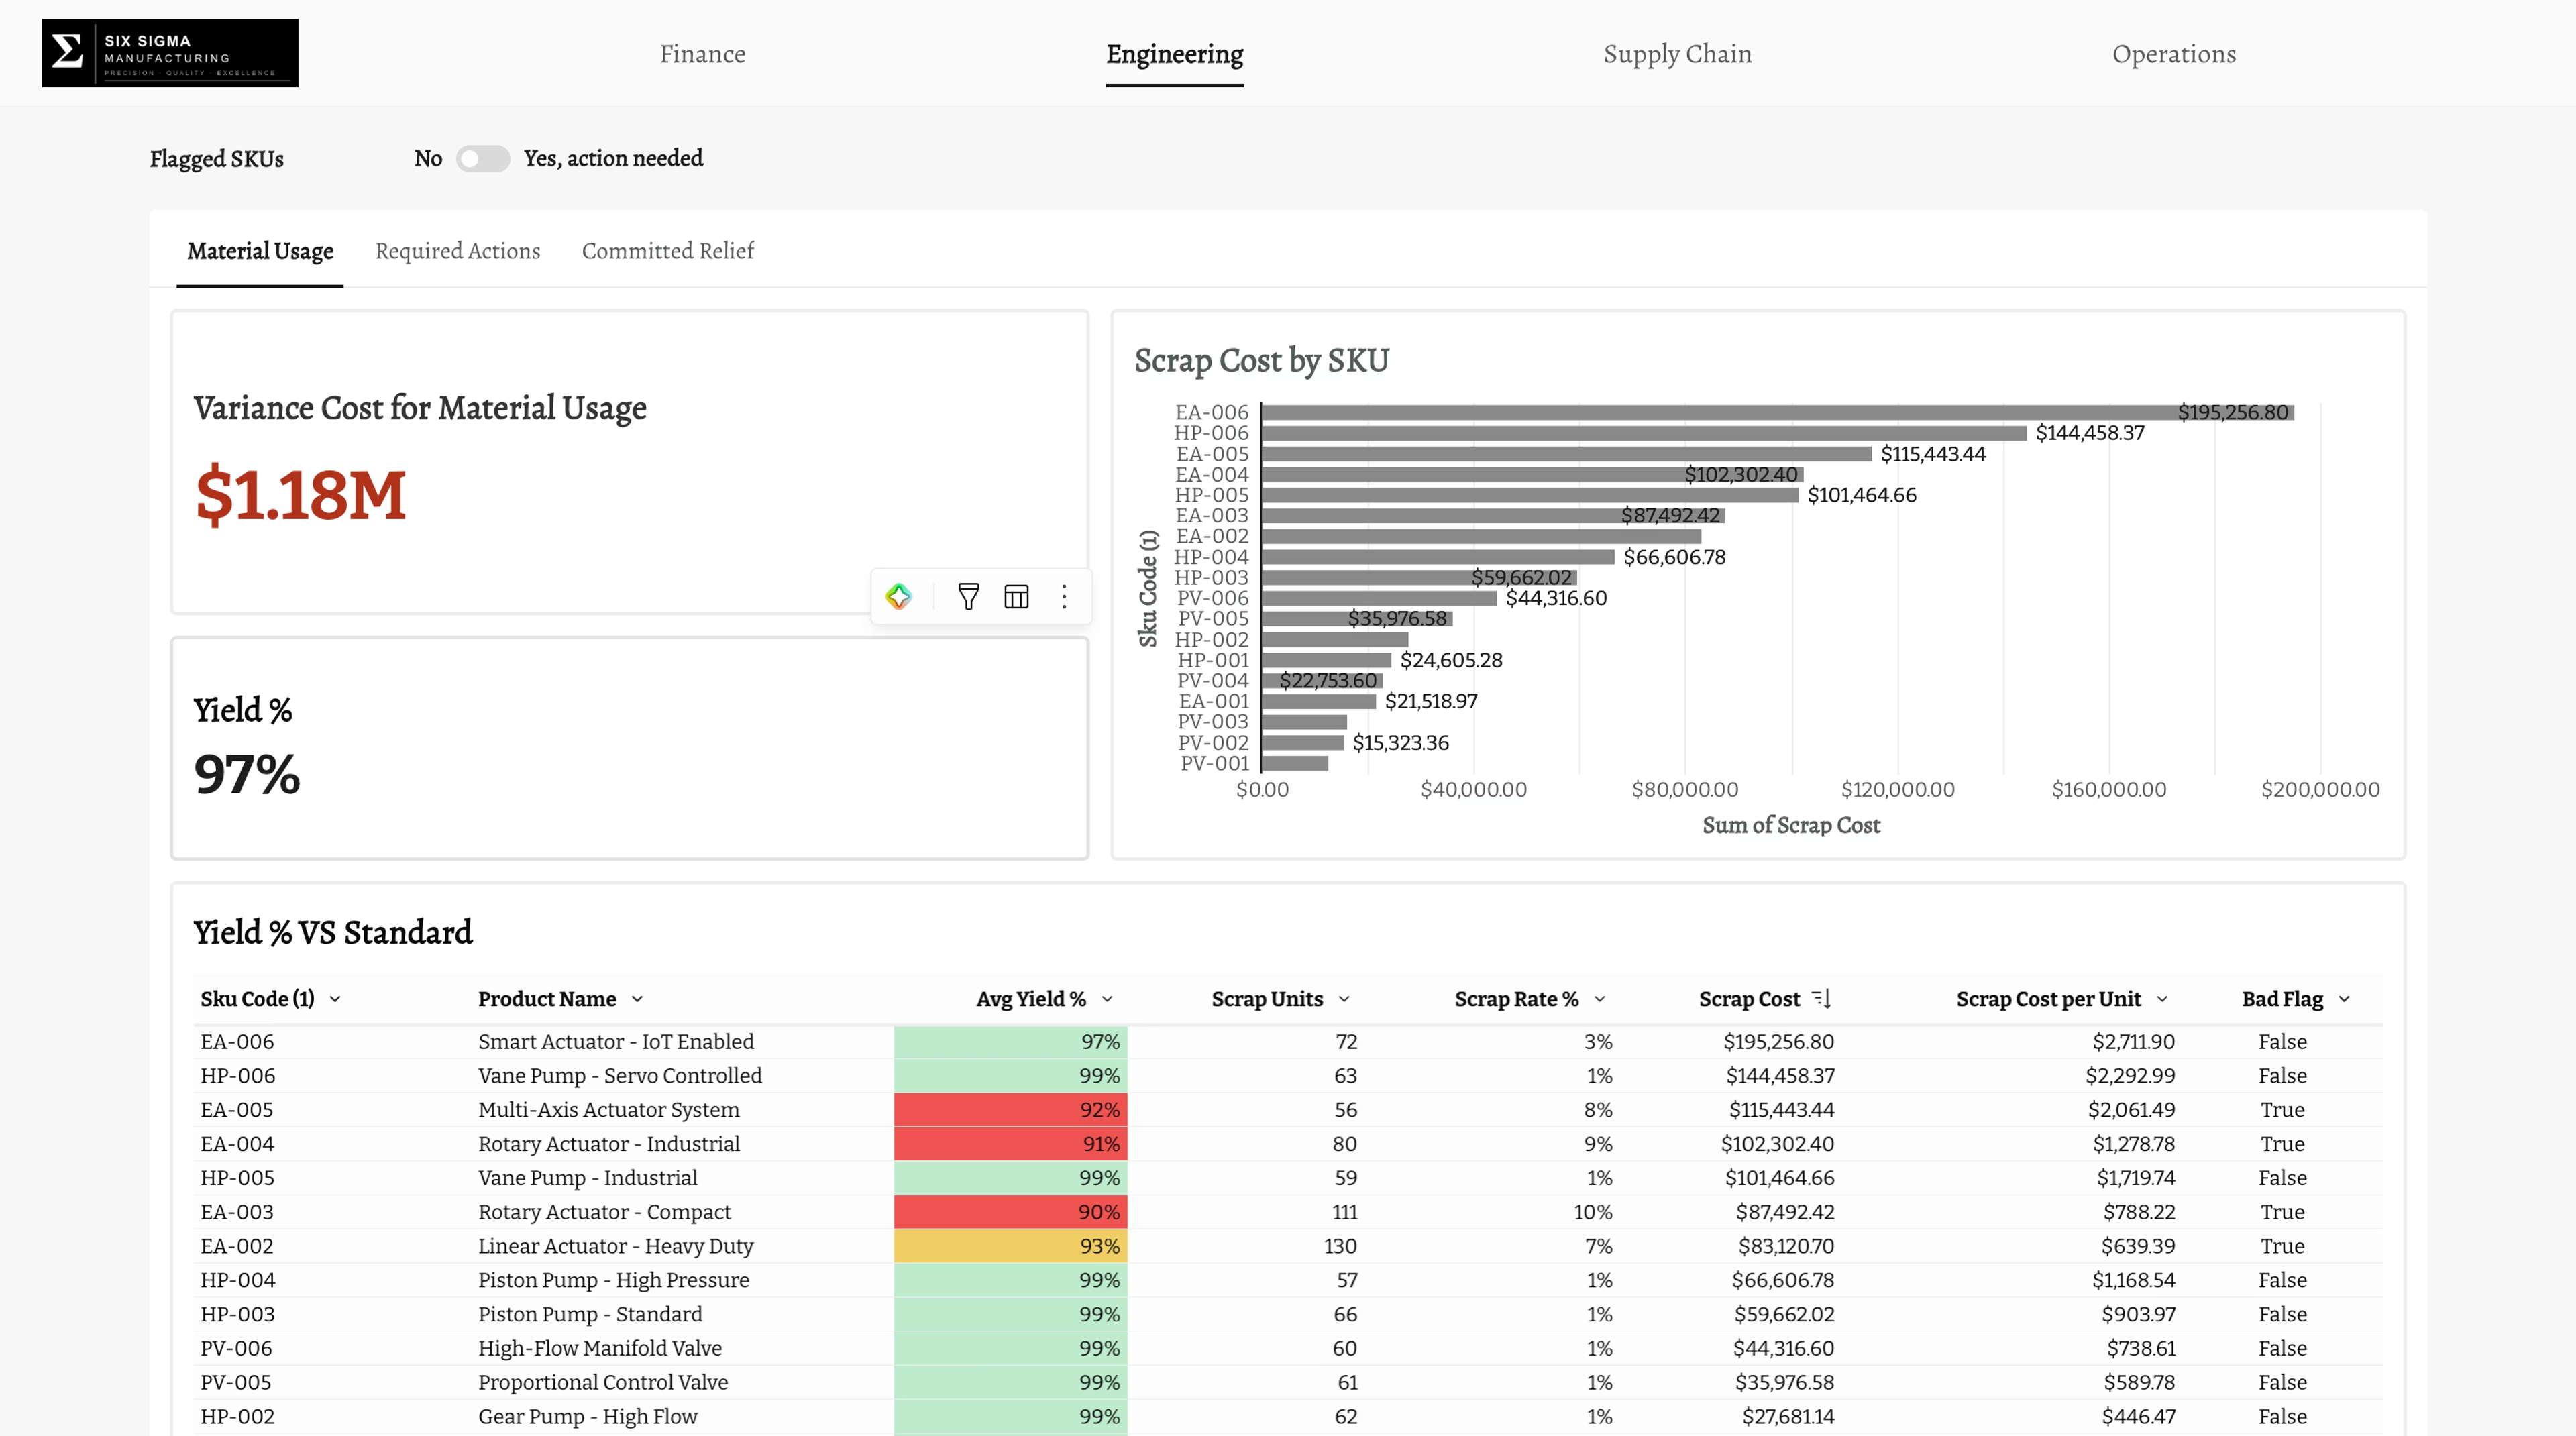
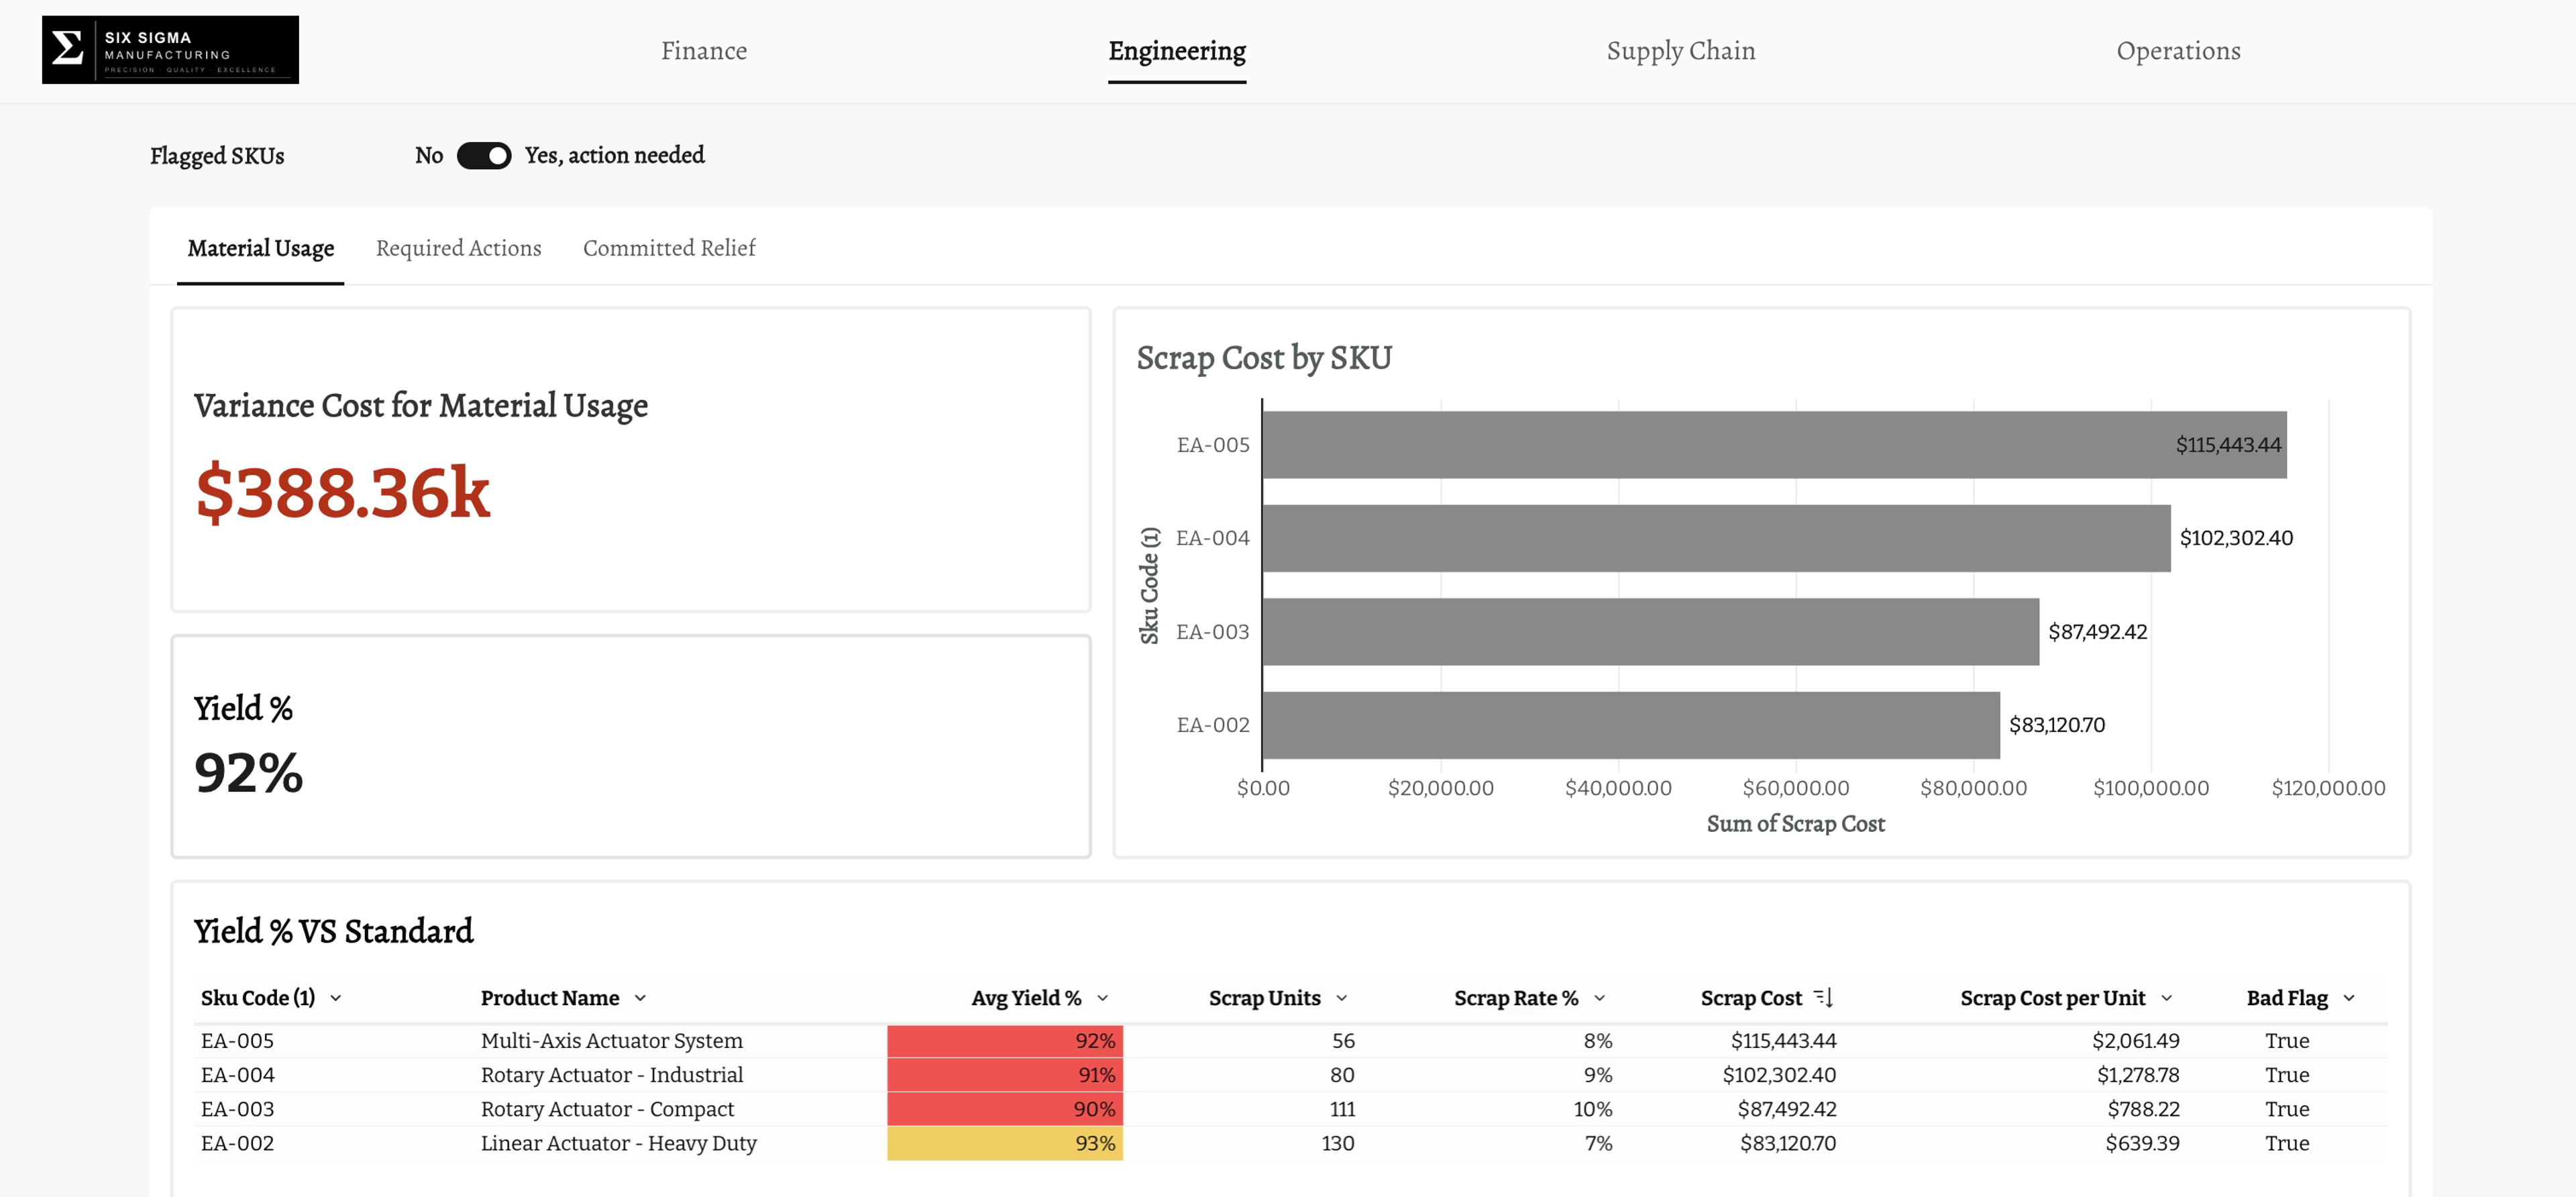
A single toggle narrows the view to the flagged SKUs, so the team works the exceptions rather than the whole catalog.
5. Log the corrective action where the cost lives
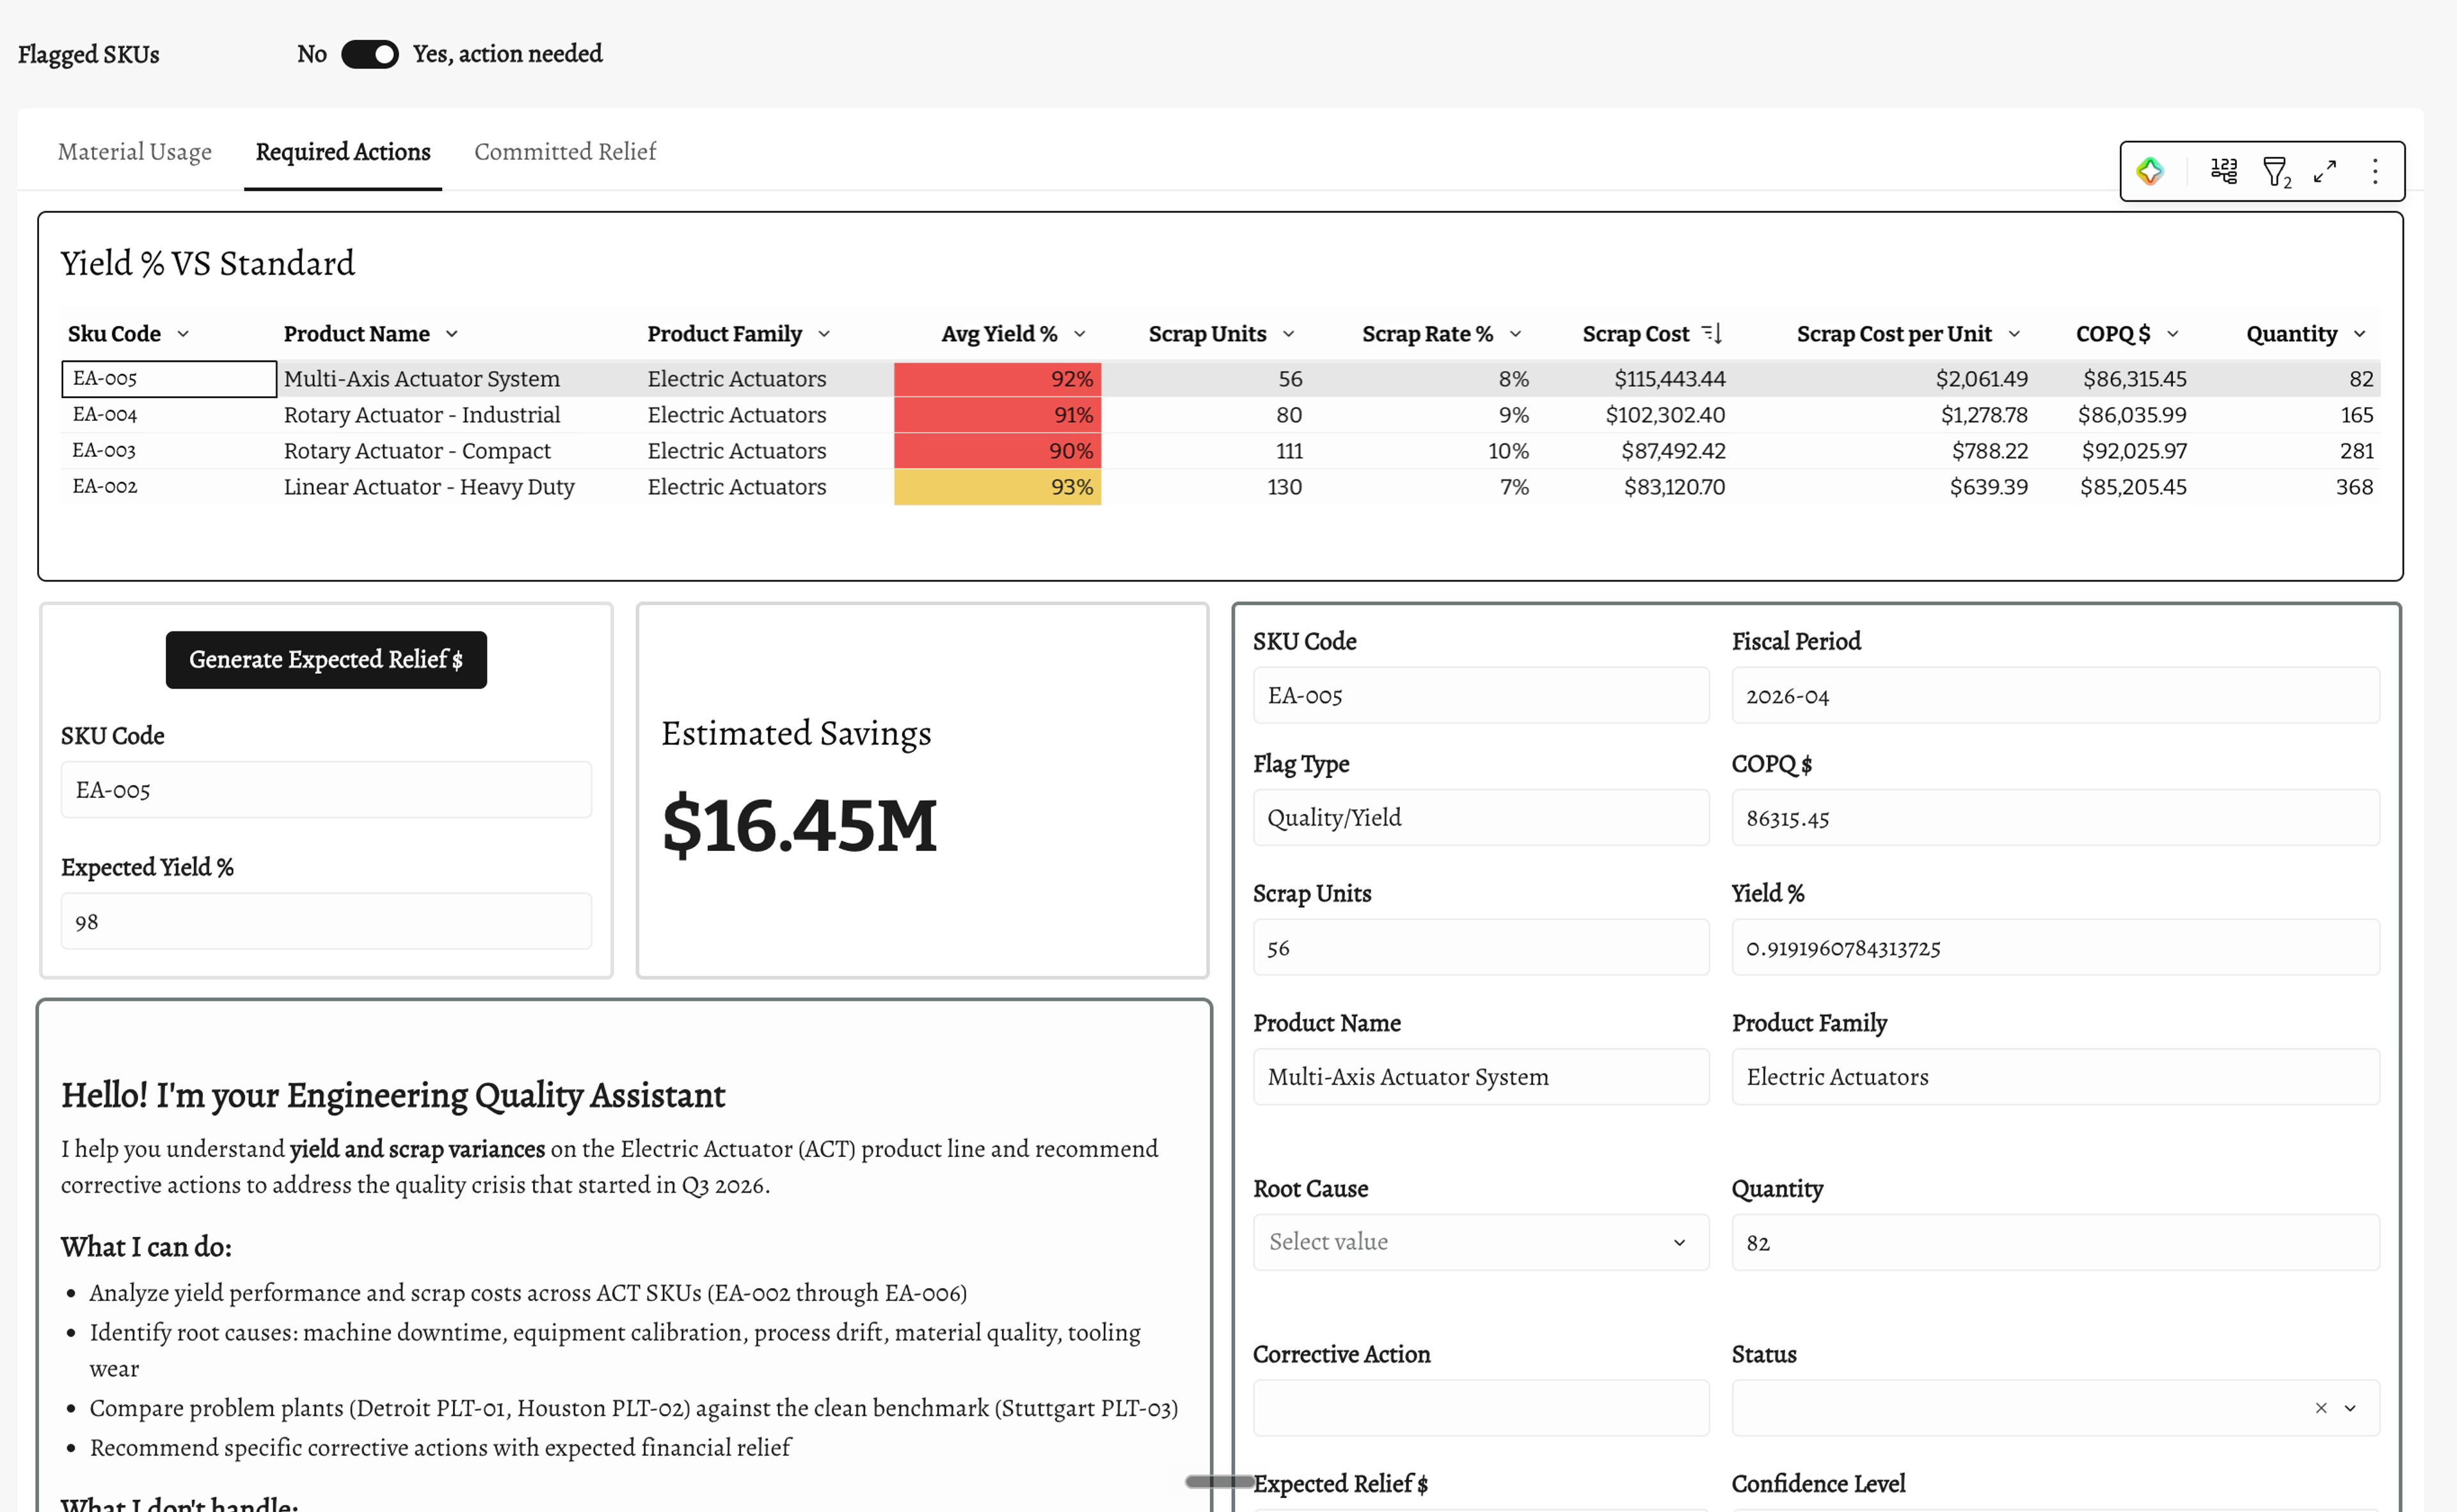
The corrective action belongs to the business partner who owns the cost, so they log it in the same app rather than in a side spreadsheet. In required actions, selecting a flagged SKU such as EA005 auto-populates the form with its details. The owner sets a target, for example a 98% expected yield, and a built-in relief calculator estimates the resulting relief. The person closest to the problem records the fix directly against the record it affects.
6. Let an agent draft the fix and write it back
From the same form, the owner can hand the work to an agent. Ask what the expected relief and target date should be for a SKU, and the agent reasons over the record and returns a concrete answer, for example $34,000 of relief with an August 31 target date, then writes those values into the form once approved. A human-in-the-loop step keeps it governed: the owner adds a confidence level and an owner email, clicks approve, and only then does the agent's answer populate the form. Submitting notifies the owner by email with the full details.
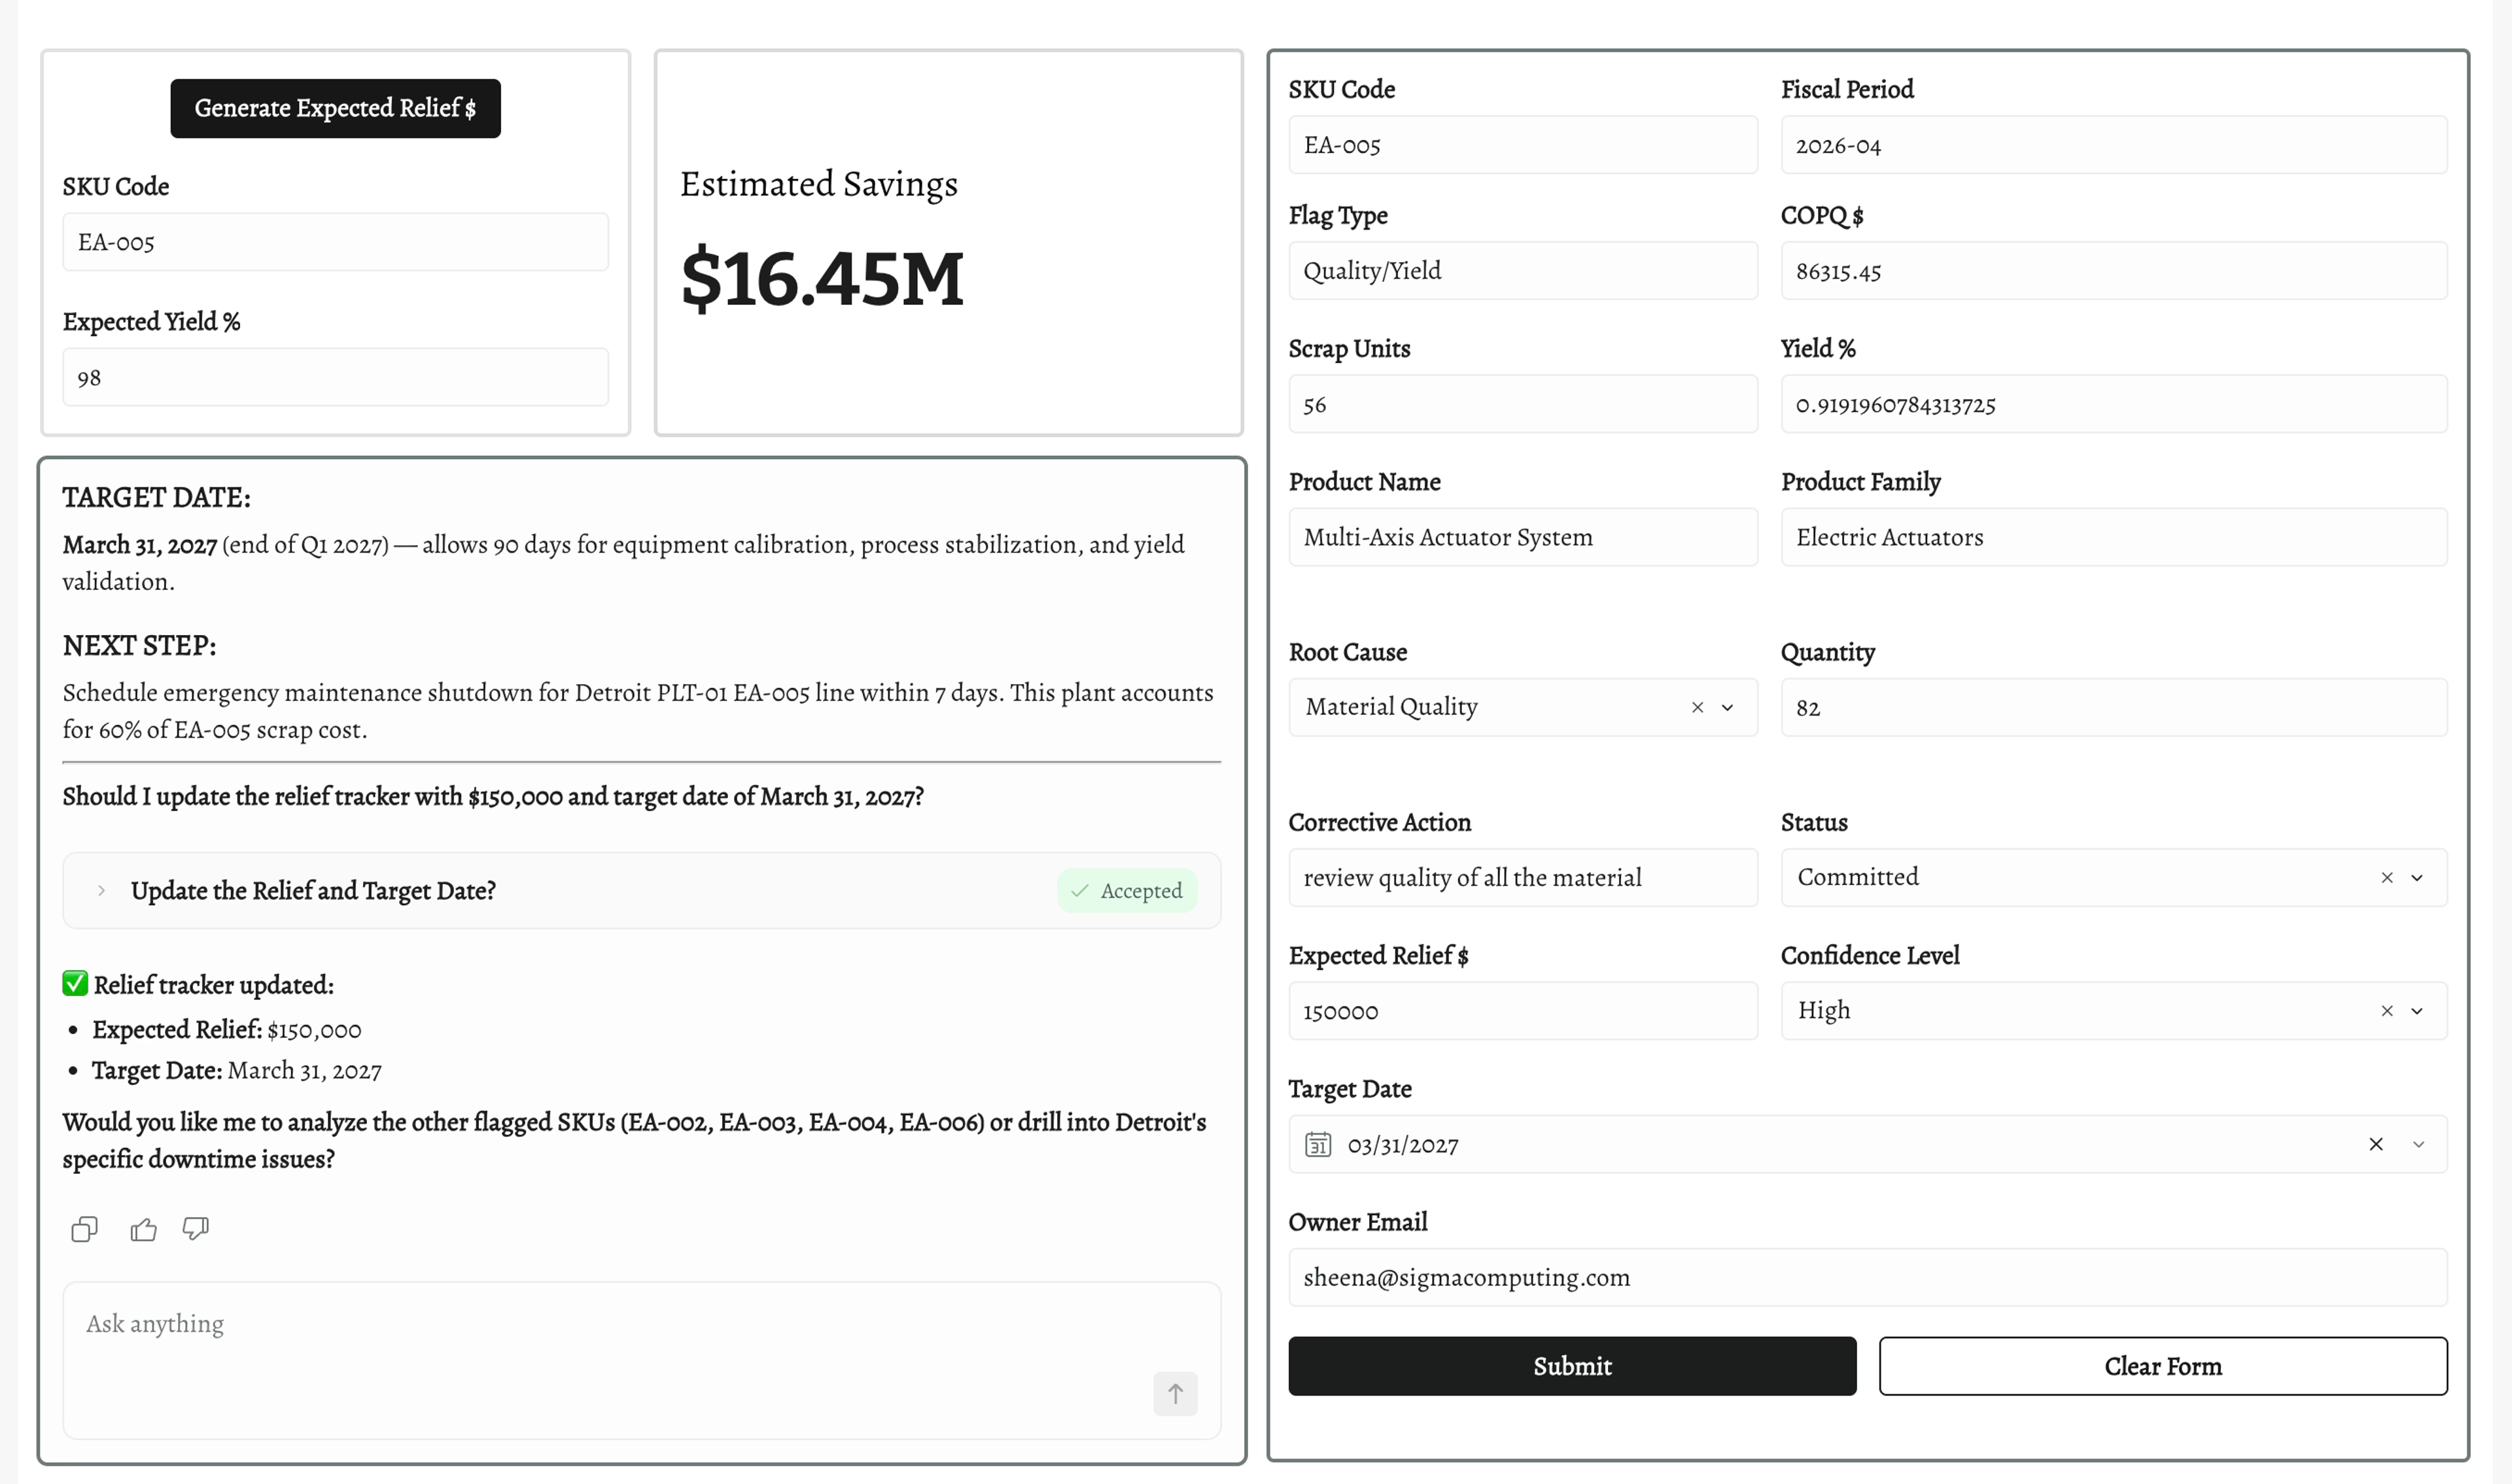
Teams build these agents themselves, with point and click rather than code. You add instructions, pull in data elements, define the actions the agent can take, and tag in the warehouse agents it is allowed to use. Build an agent for supply chain, another for operations, and the same loop repeats for every partner on the P&L.
7. Watch the P&L and 2027 forecast update
Because every action wrote back to the same governed source, finance sees the result without stitching anything together. On the finance view, the range of outcomes reflects the corrective actions just logged: variance falls as the effective relief lands, and the P&L shows how much gross profit recovered.
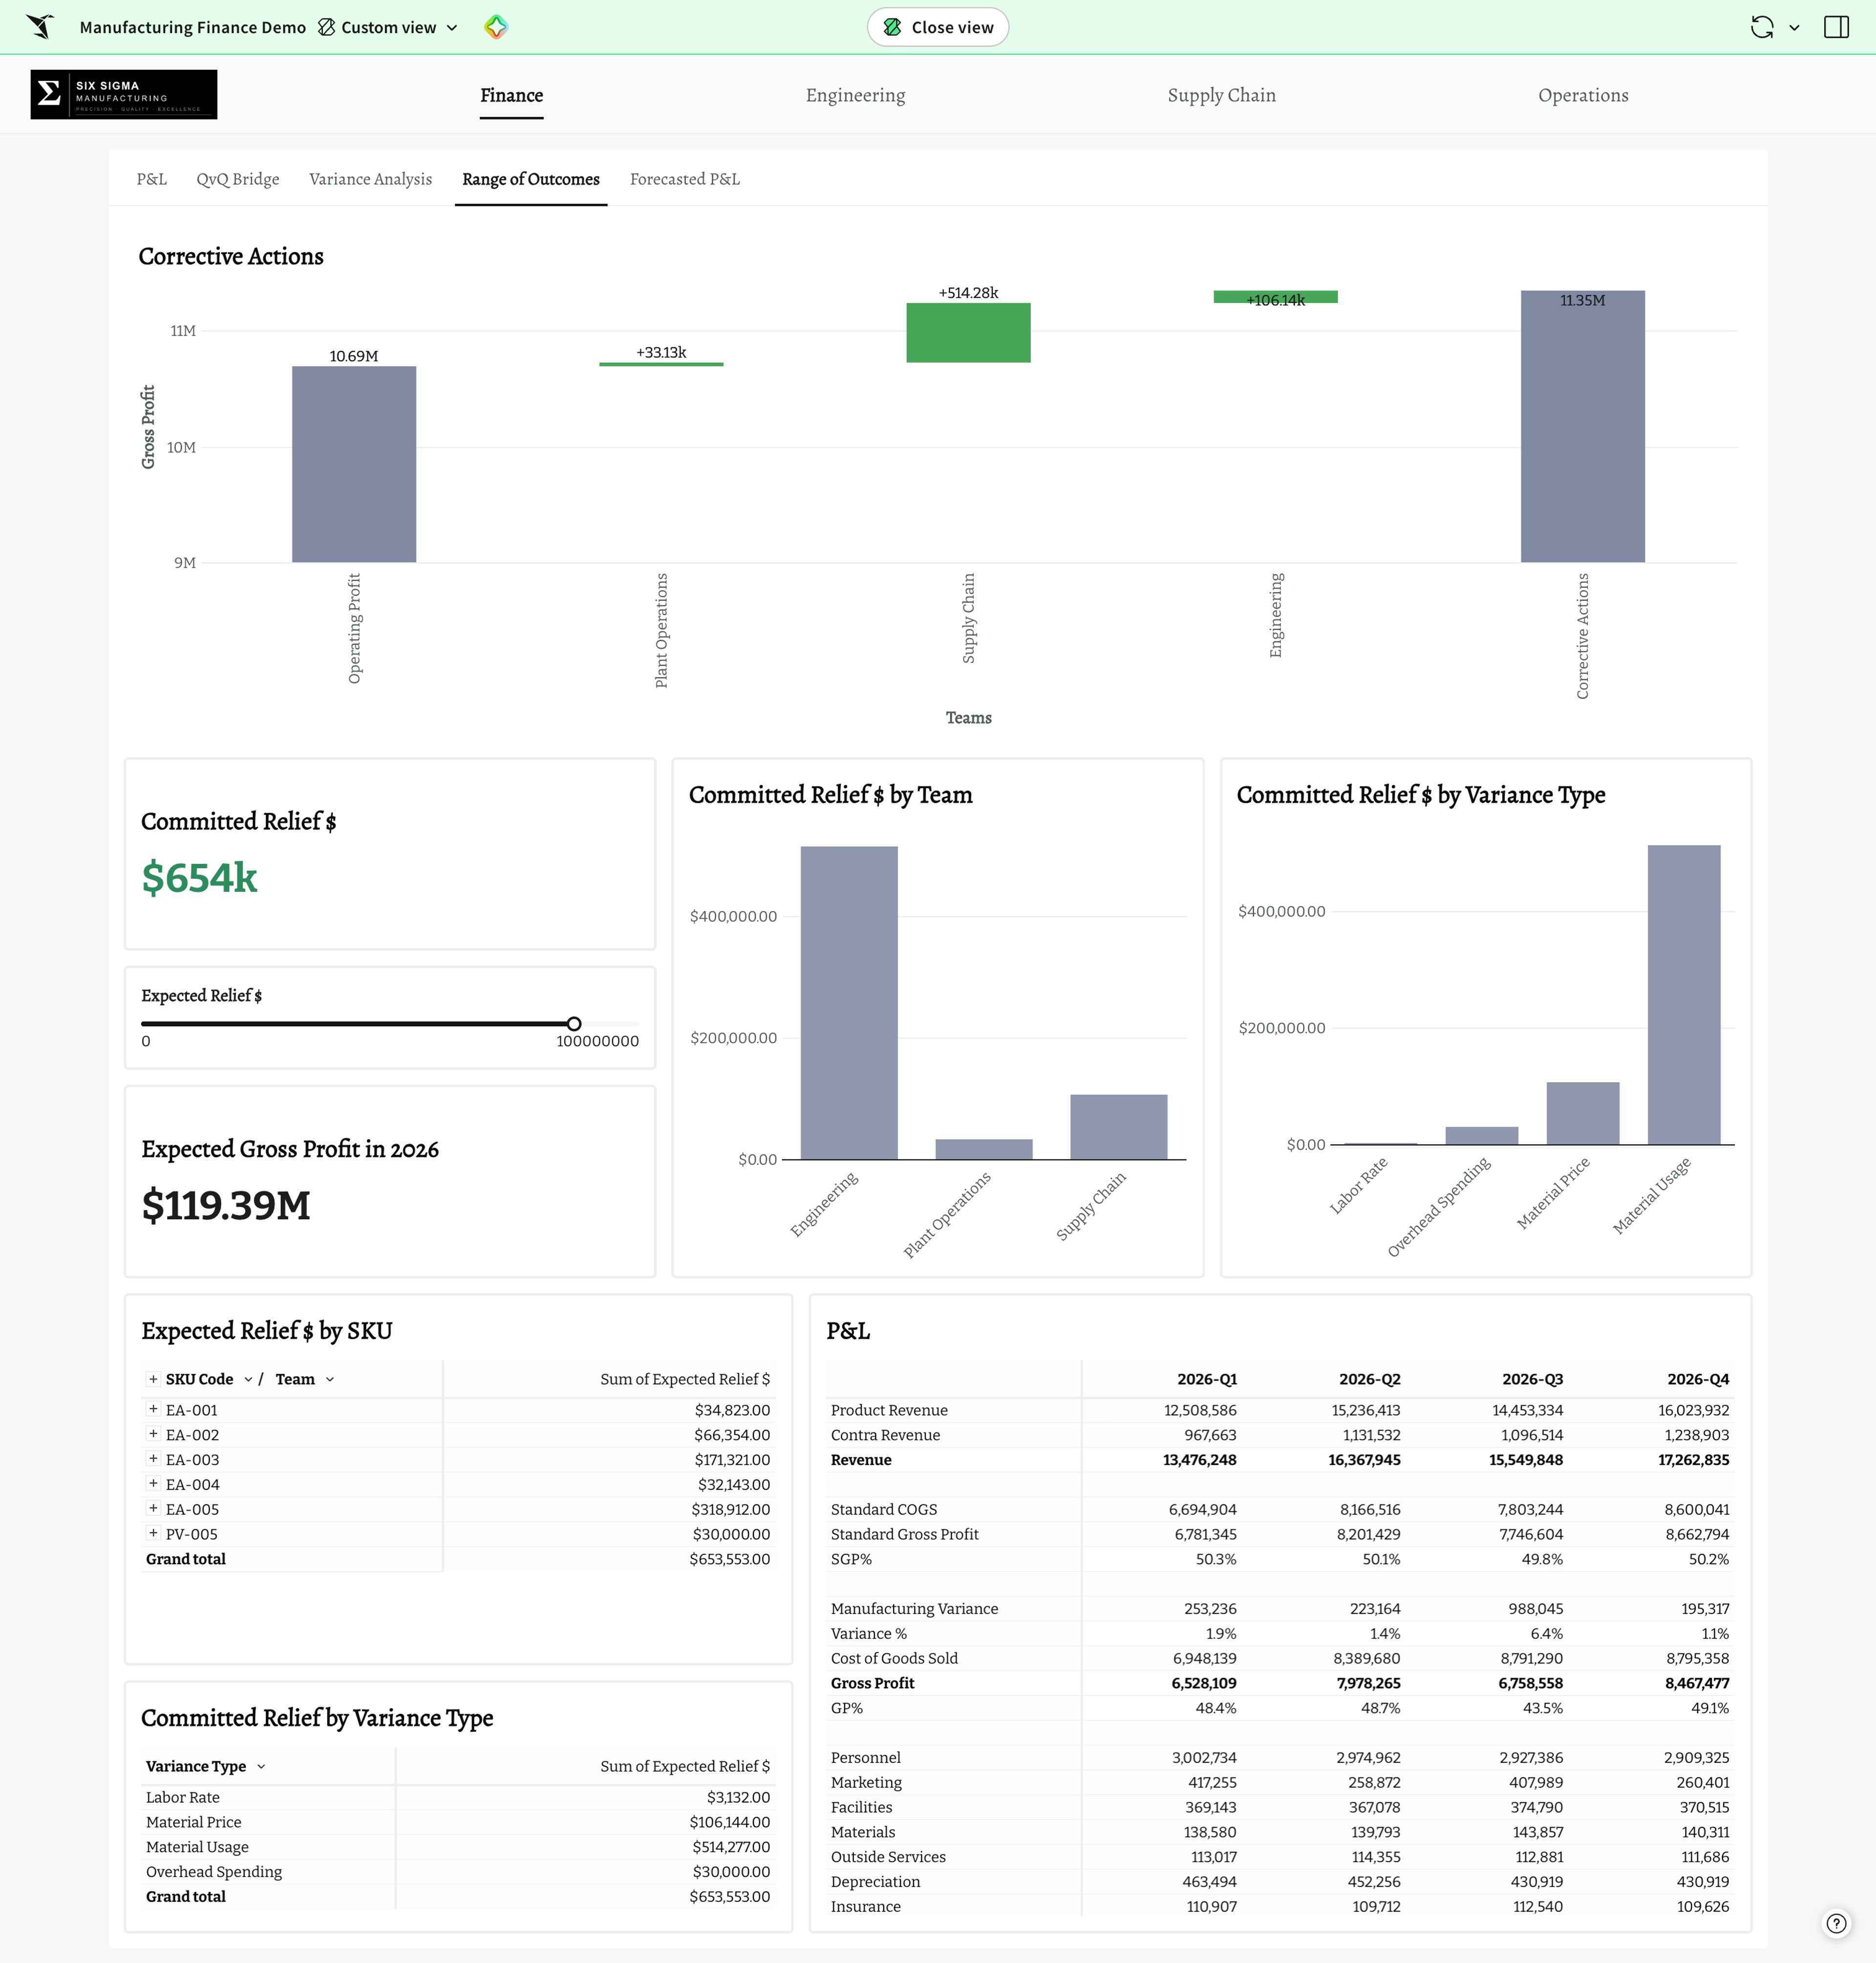
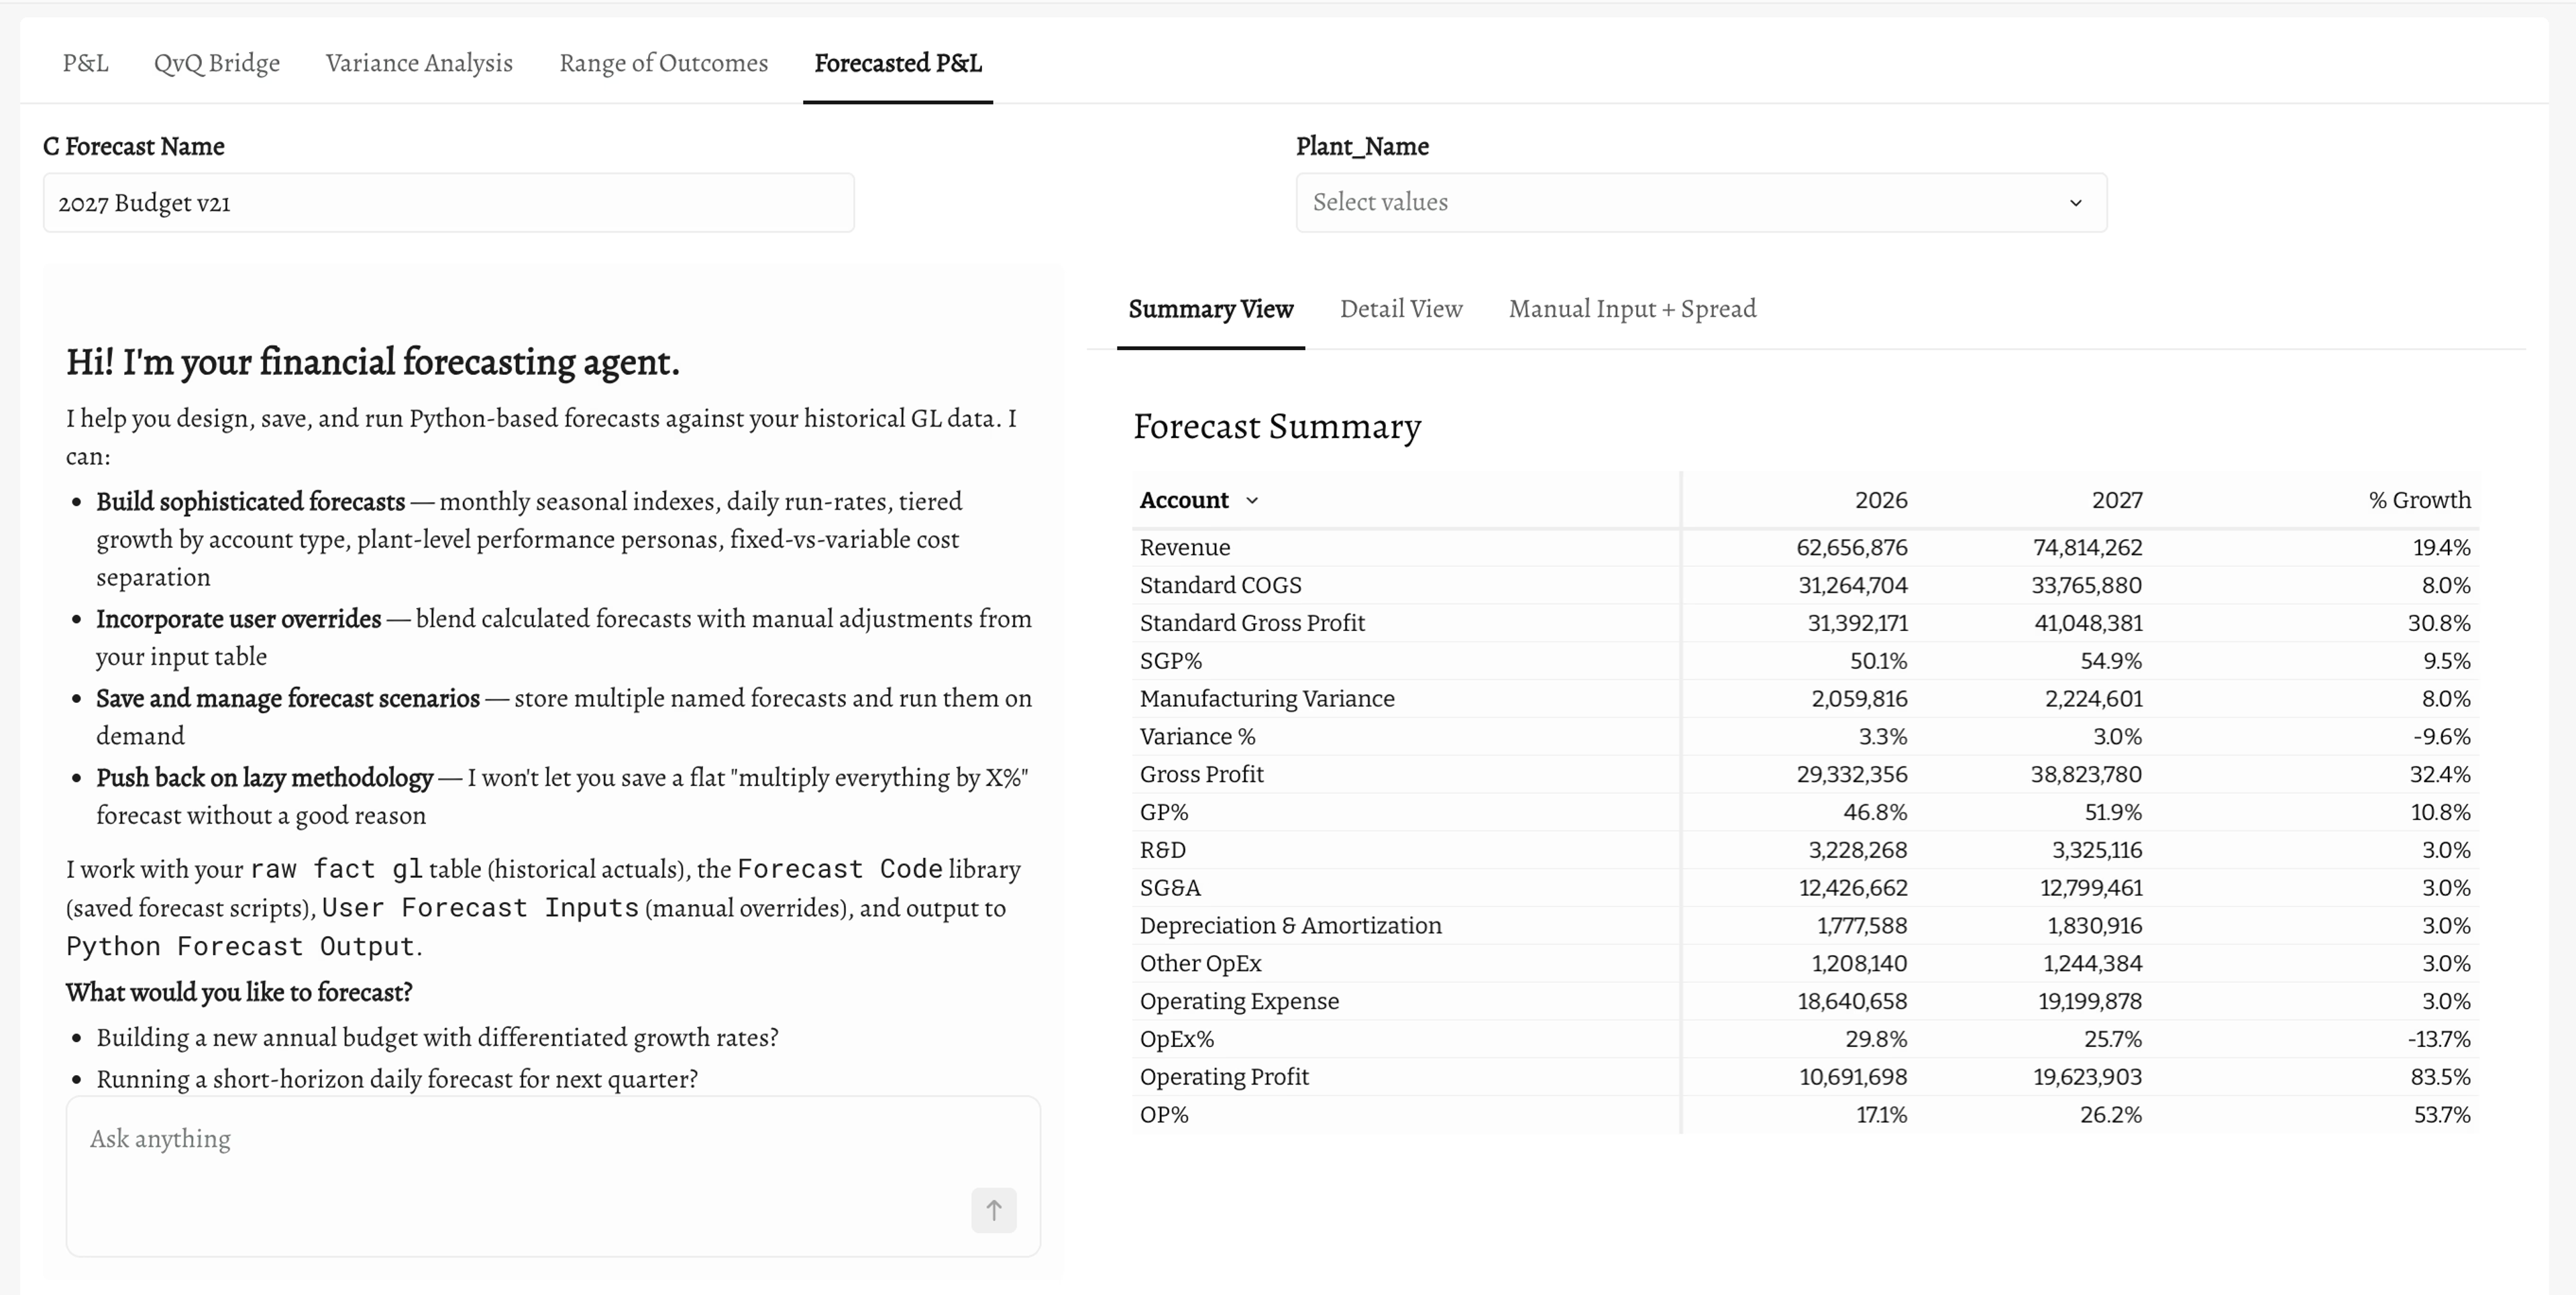
From there, an agent projects the forecasted P&L for 2027 and beyond, so the team moves from a closed-quarter miss to a forward view built on the fixes their partners committed to.
Built by the finance team, no code
An app like this gets built by the finance team and its partners, no code, reading live from the warehouse and writing back to a governed source. AI helps build the app, not only work inside it: an executive rollup or a forecasted-P&L view can come from a single prompt that describes what you want and points it at the data. A team like this runs on two kinds of AI, the agents that investigate and act, and an assistant that builds the views, both on the same governed data.
Close the gap between the variance and the fix
Most manufacturing finance teams already produce a variance report that points straight at the Q3 miss, so spotting it was rarely the problem. The trouble comes after, in the distance between the number and the operational action that changes it, where a fix sits in a spreadsheet while the next quarter plans off a stale P&L. When the screen that surfaces the variance is also where the relief gets logged, approved, written back, and rolled into the forecast, run by the engineers and planners who own the cost rather than a backlog of tickets, the variance becomes a corrected forecast before the quarter closes.
See it on your own P&L
Request a Sigma demo to see how your finance team can move from a Q3 variance to a logged, approved, and written-back correction in one place, on your own warehouse, and build an app like this one yourself. You can also explore apps other teams have built and start building for free on Sigma Public. Sigma Agents are in public beta and available by default to Sigma customers with an active AI provider enabled.