FP&A Reporting: How to Automate It and Best Practices

Financial planning and analysis (FP&A) teams spend 46% of their time on data collection and validation alone. That leaves far less time for the analysis executives actually need.
In many finance teams, the monthly reporting cycle still runs on exported spreadsheets analysts stitch together by hand. They pull data from the ERP, copy it into Excel, reconcile across systems, rebuild the same report they built last month, and email it out.
This guide covers what FP&A reporting is, why it matters, how the process works today, what it takes to automate it, and the practices that keep numbers accurate once you do.
Key takeaways
- Build the FP&A reporting cycle once on a warehouse foundation. Centralize source data in a cloud warehouse, model it for finance, build live templates on top of it, and automate distribution.
- Reports, dashboards, and forecasts should read directly from a governed cloud data warehouse, so finance and leadership work from the same, up-to-date numbers between closes, without exports or reconciliation.
- Design reports backward from the decision. A board pack, a regional sales review, and an operating dashboard each require different cuts, cadences, and levels of detail.
- After automating the FP&A reporting cycle, reinvest the time saved into driver-based variance explanations, scenario modeling, and AI-assisted commentary rather than producing the same report faster.
What is FP&A reporting?
FP&A reporting is the discipline of producing the financial and operational reports, dashboards, and analyses that finance teams use to track business performance and guide decisions. The goal is to deliver the right information to the right person, at the right time, in the right format.
Most FP&A teams organize their reporting around three connected report types that move from describing the past to projecting the future:
- Budget vs. actuals reports compare planned financial outcomes for a period against actual results and surface variances across revenue and expense line items.
- Variance analysis moves from identification to explanation. A favorable variance means revenue exceeded plan or costs came in below it. An unfavorable variance means the opposite.
- Forecasts estimate future financial performance based on historical data, current trends, and updated assumptions. Rolling forecasts maintain a fixed forward-looking horizon that advances with each update cycle rather than anchoring to a fiscal year-end.
Together these reports form a closed loop: actuals reveal where results diverged from plan, variance analysis explains why, and forecasts incorporate the lessons into the forward view.
Benefits of FP&A reporting
When FP&A reporting is done well, finance stops being a scorekeeper that explains last month and becomes a partner that shapes next quarter. The benefits show up across five areas:
- Faster decisions on current data. When reports refresh from the warehouse on every open, leaders can act on the numbers as they move, rather than waiting until the next close to confirm what they already suspected.
- Driver-based context. Tying results to operational levers (customer acquisition cost, churn, average deal size, headcount utilization) explains the why behind every change.
- Forward visibility. Rolling forecasts give leaders room to adjust strategy rather than scramble after results land.
- A single source of truth across teams. When finance, leadership, and business units all read from the same governed numbers, performance conversations focus on what to do next rather than on whose spreadsheet is right.
- More analyst time on analysis. Automating the cycle build frees FP&A from data assembly, allowing the team to focus on variance explanation, scenario work, and recommendations.
These payoffs compound. A team that produces current numbers, explains them through drivers, and projects them forward will typically outperform one that does any of the three in isolation.
How the FP&A reporting process works
FP&A reporting follows the same recurring cycle each period, and every handoff is a point where manual effort accumulates.
Pulling and reconciling data from source systems
Once accounting closes the books, FP&A analysts pull data from ERP systems, operational platforms, and spreadsheets.
In most organizations, multiple associates extract data independently, each performing their own manual transformation and reconciliation, creating duplicative work across the team. ERP systems supply transactional accounting data without the business context FP&A needs, so analysts rebuild customer, vendor, and product dimensions by hand.
Reconciliation then consumes a disproportionate share of the cycle. By the time analysts finish, the data may already be stale relative to current business conditions, which compresses every downstream step into an even tighter window.
Comparing actuals to budget and forecast
Analysts build variance views, isolate where results diverged from plan, and write commentary explaining them. By the time the cycle reaches this stage, most of the period's hours have already been spent on data pulls and reconciliation. The analysis itself, which is the part executives actually rely on, gets squeezed into the narrowest window of the close.
Variances get flagged but rarely traced back to the operational driver behind them, and commentary defaults to describing what happened instead of recommending what to do.
Distributing reports to stakeholders
FP&A sends the final reporting package to the CFO, the board, the CEO, and business unit leaders for performance discussions. Pre-automation, these packages relied heavily on Excel, required manual assembly, and offered limited insight into why results moved. Most packages are also pre-aggregated summaries of the underlying financial statements, fixed at whatever level of detail the analyst chose when building the report.
That creates a specific problem in the room. An executive spots a data point in the reporting package and asks why it moved. Answering means tracing the number back to the raw transactional data behind it, and that can take an analyst days or weeks. By the time the team finds the root cause, the meeting is long over and the window to act on the answer has closed.
Only 2% of organizations consider their FP&A teams fully optimized, and manual processes and inconsistent data still constrain more than 60% of organizations.
Key requirements for automating FP&A reporting
Every automated FP&A stack rests on five building blocks:
- A consolidated data foundation keeps finance data queryable in one place. A cloud data warehouse (e.g., Databricks, Snowflake, BigQuery, Amazon Redshift) stores actuals, budgets, forecasts, and operational data, enabling reports to be generated from a single source.
- Governed access controls follow the data wherever it is consumed. Row-level security, masking, and role-based permissions remain attached as data moves from the warehouse to the report.
- A defined refresh cadence keeps the data current. Refresh pipelines load and validate data on a schedule the business can rely on, with clear ownership when something fails.
- A reporting layer reads live data on every open. Templates and dashboards pull from the warehouse each time they load, rather than relying on static exports that go stale.
- Self-service access frees the FP&A queue. Non-finance stakeholders can answer their own questions from governed dashboards without filing a ticket with the FP&A team.
Missing any one of these turns automation into a workaround. A missing refresh cadence means stale reports, weak governance pushes work back to manual review, and no self-service layer keeps every business question routed through FP&A.
How to automate FP&A reporting
Automating FP&A reporting is a six-step build that moves from warehouse foundation to live reporting to ongoing AI-assisted intelligence.
1. Centralize data in a cloud data warehouse
Automated reporting starts with one place the reports can read from. Centralize financial data from your ERP, general ledger, CRM, billing, HR, and operational systems into a cloud data warehouse such as Databricks, Snowflake, BigQuery, or Amazon Redshift. Only 17% of businesses have a single source of planning data today, and getting there is the prerequisite for everything else.
Scope the foundation to include every system FP&A currently pulls from (including the spreadsheets analysts keep on the side) and a landing zone for budget and forecast data so plans live next to actuals. You should also include governance you define at the warehouse layer so it propagates downstream, and a naming convention so analysts know which table to trust.
2. Build automated pipelines with validation
Replace manual exports with scheduled data pulls that run on a defined cadence. Automated pipelines move data from source systems into the warehouse, check it in transit, and flag anomalies before it reaches a report.
A well-built pipeline should handle scheduled extraction on a cadence that matches reporting needs; schema and data quality checks that catch missing columns and duplicates; standardization of currencies and account codes across entities; and alerts to a clear owner when a load fails.
3. Model the data for finance
Raw warehouse tables aren't yet a finance dataset. A modeling layer sits between the pipelines and the reports, translating transactional data into the structure FP&A actually uses. That structure includes a clean chart of accounts mapped across every source system and reusable metric definitions (gross margin, customer acquisition cost, net revenue retention) you define once and pull into every report.
Most finance teams build this logic in the wrong place. Metric definitions end up buried in DAX measures inside a BI tool, or scattered across formulas in an analyst's spreadsheet, disconnected from the warehouse and invisible to anyone outside that one tool. When the model lives in the warehouse instead, using a semantic layer such as Snowflake Semantic Views or Databricks Unity Catalog, the definitions are governed once and every tool that reads from the warehouse, including Sigma, works from the same logic.
The model also handles time intelligence such as period-over-period, year-to-date, and rolling 12-month, so analysts don't rebuild it report by report. When the model is solid, the reports built on it agree by default rather than by reconciliation.
4. Build live, reusable report templates
Build your budget vs. actuals, variance, and forecast reports as templates that connect to live warehouse data, so the structure stays consistent while the underlying data refreshes each period.
Each template should include drill-downs from summary numbers to line-item detail, automate recurring calculations such as currency conversion and intercompany eliminations, and support comments so the variance commentary lives next to the variance. Built once, these templates carry forward every reporting cycle without a rebuild.
5. Automate distribution and enable self-service
Automate the last mile. Schedule report delivery on a fixed cadence for executive summaries and close packs, and give business unit leaders self-service access to live dashboards for everything else.
A workable distribution model usually includes:
- Scheduled PDF or email packs deliver recurring summaries to board, CFO, and CEO audiences who want a fixed cadence.
- Live dashboards give operational stakeholders room to explore, allowing them to filter and drill into the same governed data.
- Alert subscriptions notify a stakeholder when a metric crosses a defined threshold, so action follows movement rather than a meeting.
- Embedded views surface finance data inside the tools business users already work in, so the numbers show up where decisions are made.
Together, scheduled distribution and on-demand access end the email-and-wait loop that slows decisions.
6. Add AI for explanation, forecasting, and scenario work
AI assistants can let analysts ask plain-language questions about variances, forecast accuracy, and driver behavior, and return draft answers grounded in governed warehouse data, subject to analyst review. This layer moves automation from “the report builds itself” toward “the report helps explain itself.”
The same models can help surface anomalies on actuals before close, support side-by-side tests of pricing, headcount, and pipeline assumptions, and draft commentary for board packs that an analyst then edits rather than writes from scratch.
This matters most in organizations with a reporting hierarchy. A plant enters its own variance commentary, a district manager needs a summary of every plant underneath it, a region needs a summary of its districts, and the pattern repeats up the chain. Building that roll-up by hand is a slow, manual process at each level, and a leader several layers up often has no way to trace a summary back to the specific plant comment behind it. An AI assistant grounded in the warehouse can reason across both the numbers and the commentary at every level, so a regional leader can ask a plain-language question about a variance and get an answer that draws on the underlying explanations, not just the aggregated figures.
Output quality still depends on the underlying data model and on analyst oversight, so AI augments the cycle rather than replacing review. The time saved upstream then funds higher-value analysis instead of more reporting.
How Sigma automates FP&A reporting on live warehouse data
Setting up a warehouse, building pipelines, modeling for finance, designing templates, and distributing them is already a multi-quarter program. Layering AI on top adds another phase. Most teams pull in IT and data engineering to get there, then hand finance a legacy business intelligence platform to learn from scratch.
Once the warehouse foundation is in place, Sigma handles much of the reporting, writeback, distribution, and AI layers on top of it. Sigma is the runtime layer to build and scale analytics, apps, and agents on live cloud data warehouse data. It sits between your warehouse and the AI tools generating against it, turning their output into governed, auditable software IT can trust.
A live spreadsheet interface on warehouse data
Sigma runs live queries directly against your cloud data warehouse. Every formula, filter, pivot, and sort compiles to SQL. It executes where the data lives, with no in-memory engine and no extracts, so reports reflect the current numbers the moment the warehouse updates.
The interface is the spreadsheet finance already knows. Sigma preserves that muscle memory with more than 200 calculation functions, pivot tables, and cell references, all of which operate on billions of rows of live warehouse data.
Input Tables for scenario modeling and writeback
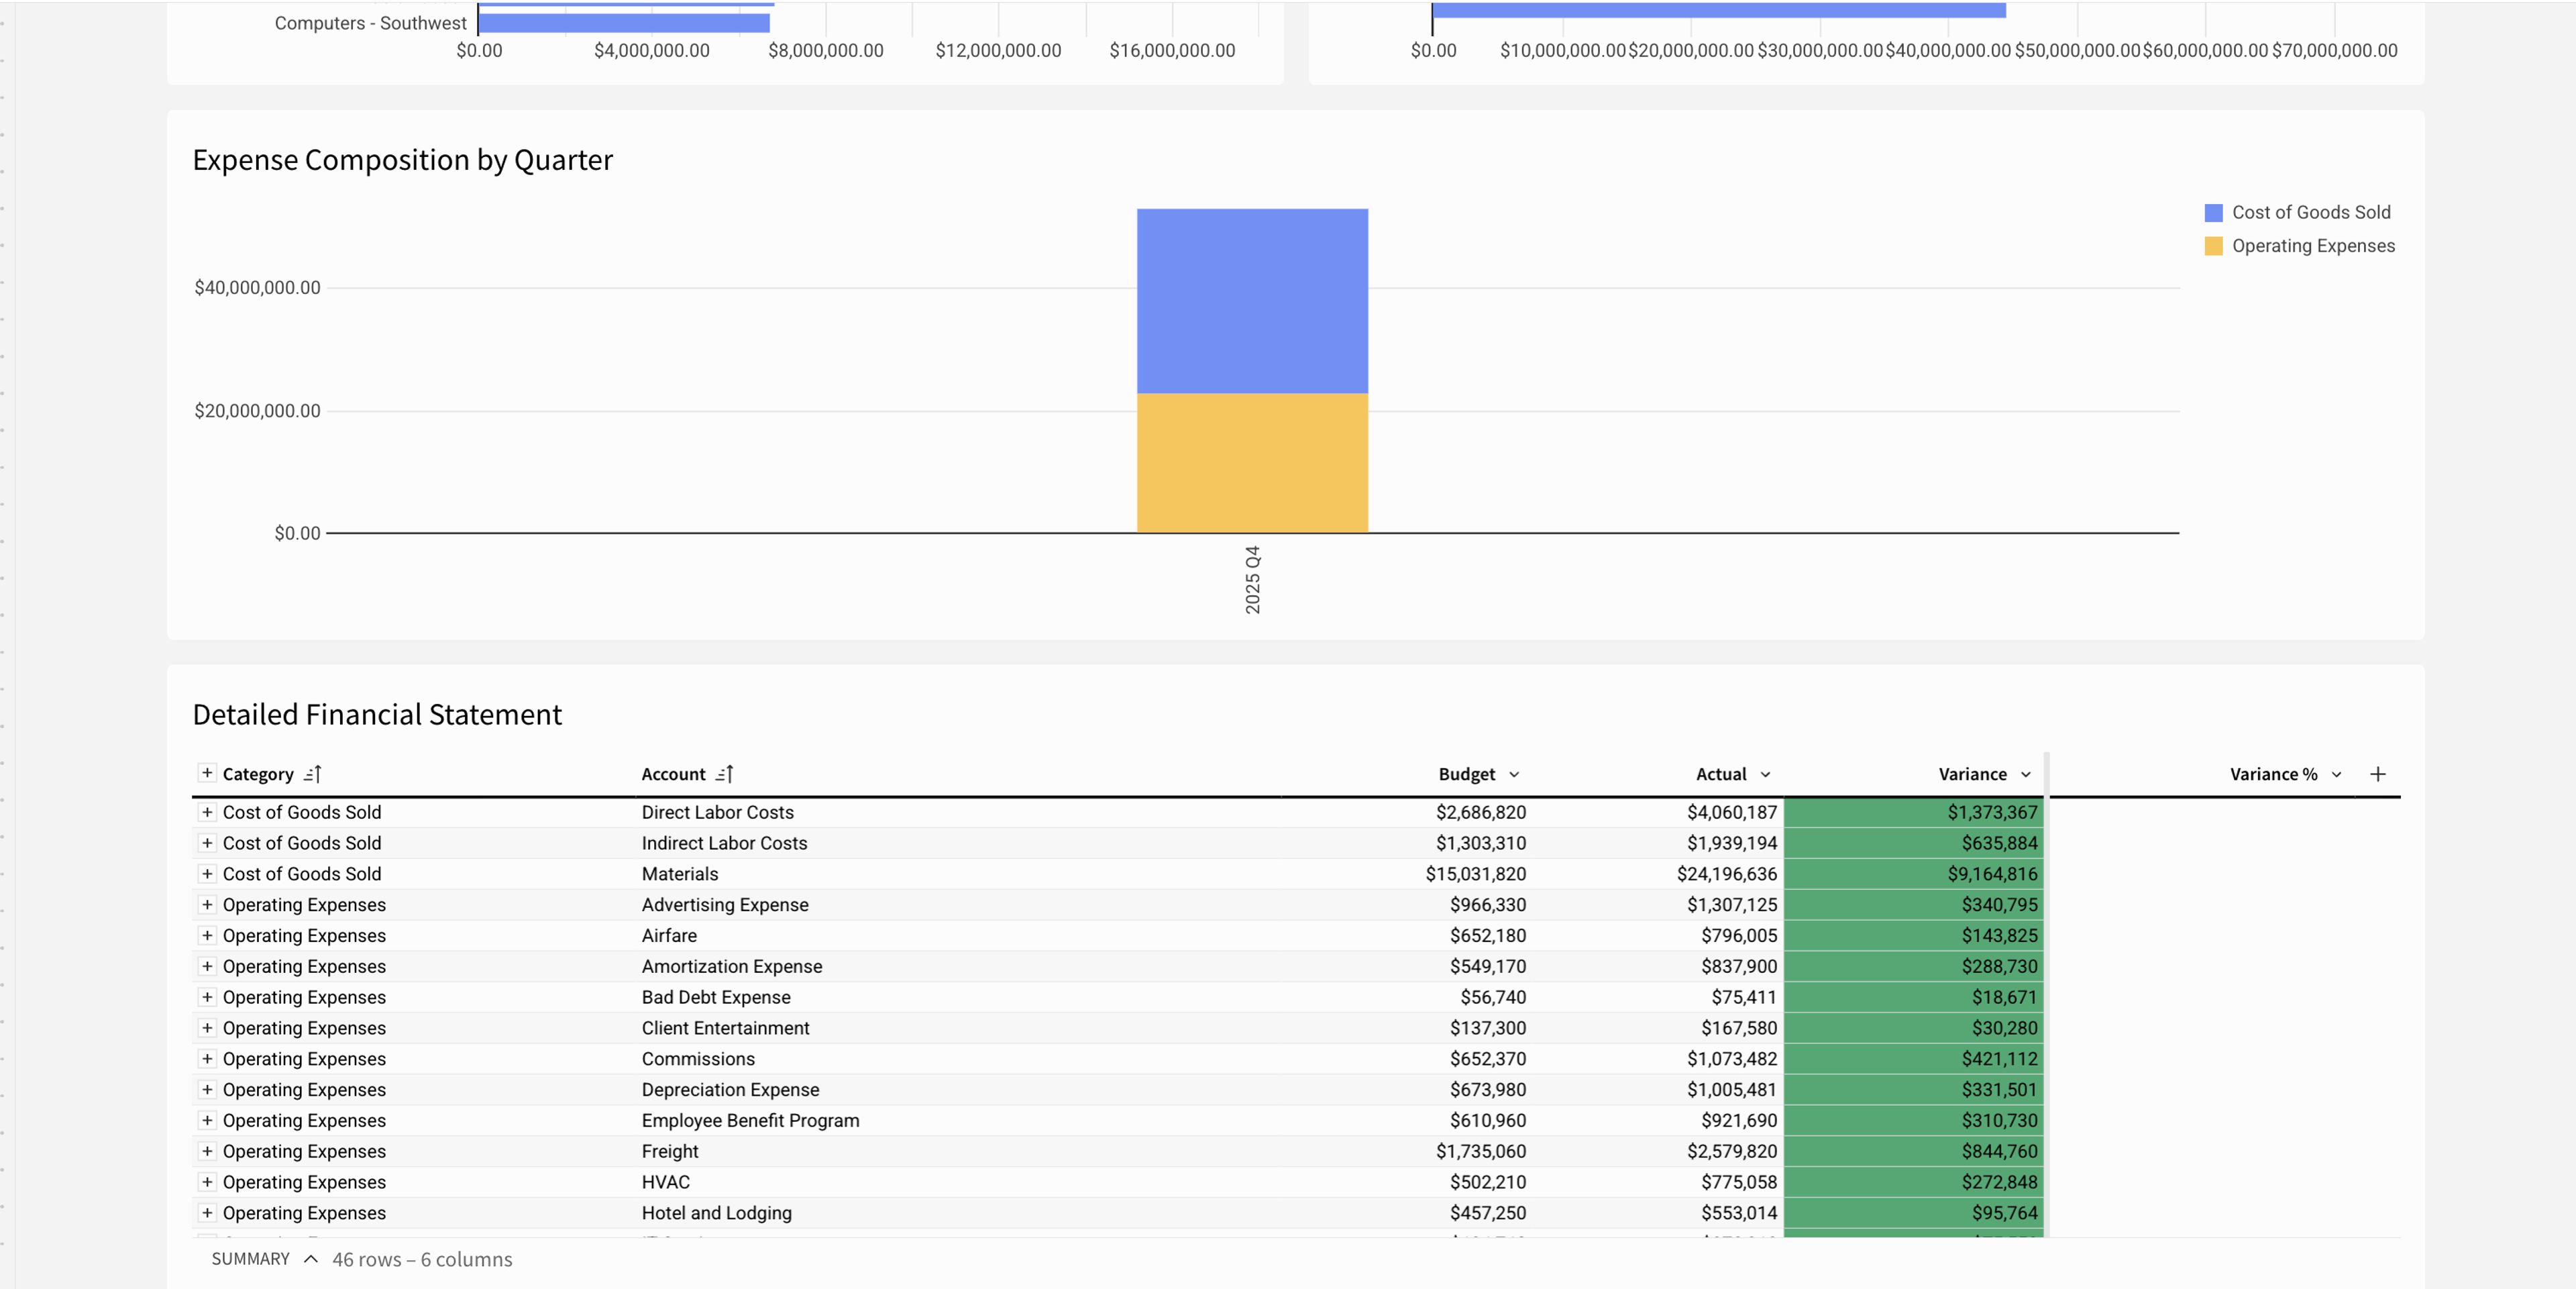
FP&A teams also write data back. Analysts update forecasts, adjust headcount assumptions, and model scenarios. Sigma's Input Tables let finance users edit data in the workbook UI and write it back to the warehouse through governed INSERT and UPDATE operations, with a record-level audit trail. Scenario plans, driver assumptions, and forecast adjustments live next to the actuals they affect, on the same governed dataset.
Sigma Assistant and Sigma Agents for governed AI
Sigma Assistant is a governed AI interface for analyzing data and building AI Apps in natural language. With Analyze with Sigma Assistant, analysts can ask why a metric moved and get an answer drawn from governed warehouse data, with the query visible for inspection. With Build with Sigma Assistant, builders can describe a budget-vs.-actuals dashboard and have Sigma Assistant assemble the components on the canvas.
For repeating workflows, such as the monthly forecast review or the weekly variance check, Sigma Agents run only after a builder configures the workflow inside a workbook with custom instructions, defined data access, and approval rules. Once those guardrails are in place, a scheduled agent can prepare a forecast review before the meeting. The agent delivers a summary of what changed at each level of the hierarchy and where the risks sit, for an analyst to validate.
Get started with FP&A reporting on Sigma
You can keep rebuilding FP&A reports by hand each period, or automate the process to keep them up to date with minimal manual input. Analysts should spend less time assembling spreadsheets and more time explaining what the numbers mean.
Sigma connects directly to your cloud data warehouse. Finance works in a spreadsheet interface on live data, and every report stays governed from a single source of truth. Start with your highest-volume reporting cycle, build the template once on live warehouse data, and let the next period run itself.