How to Build an Accounts Receivable Dashboard: Metrics, Setup and Best Practices

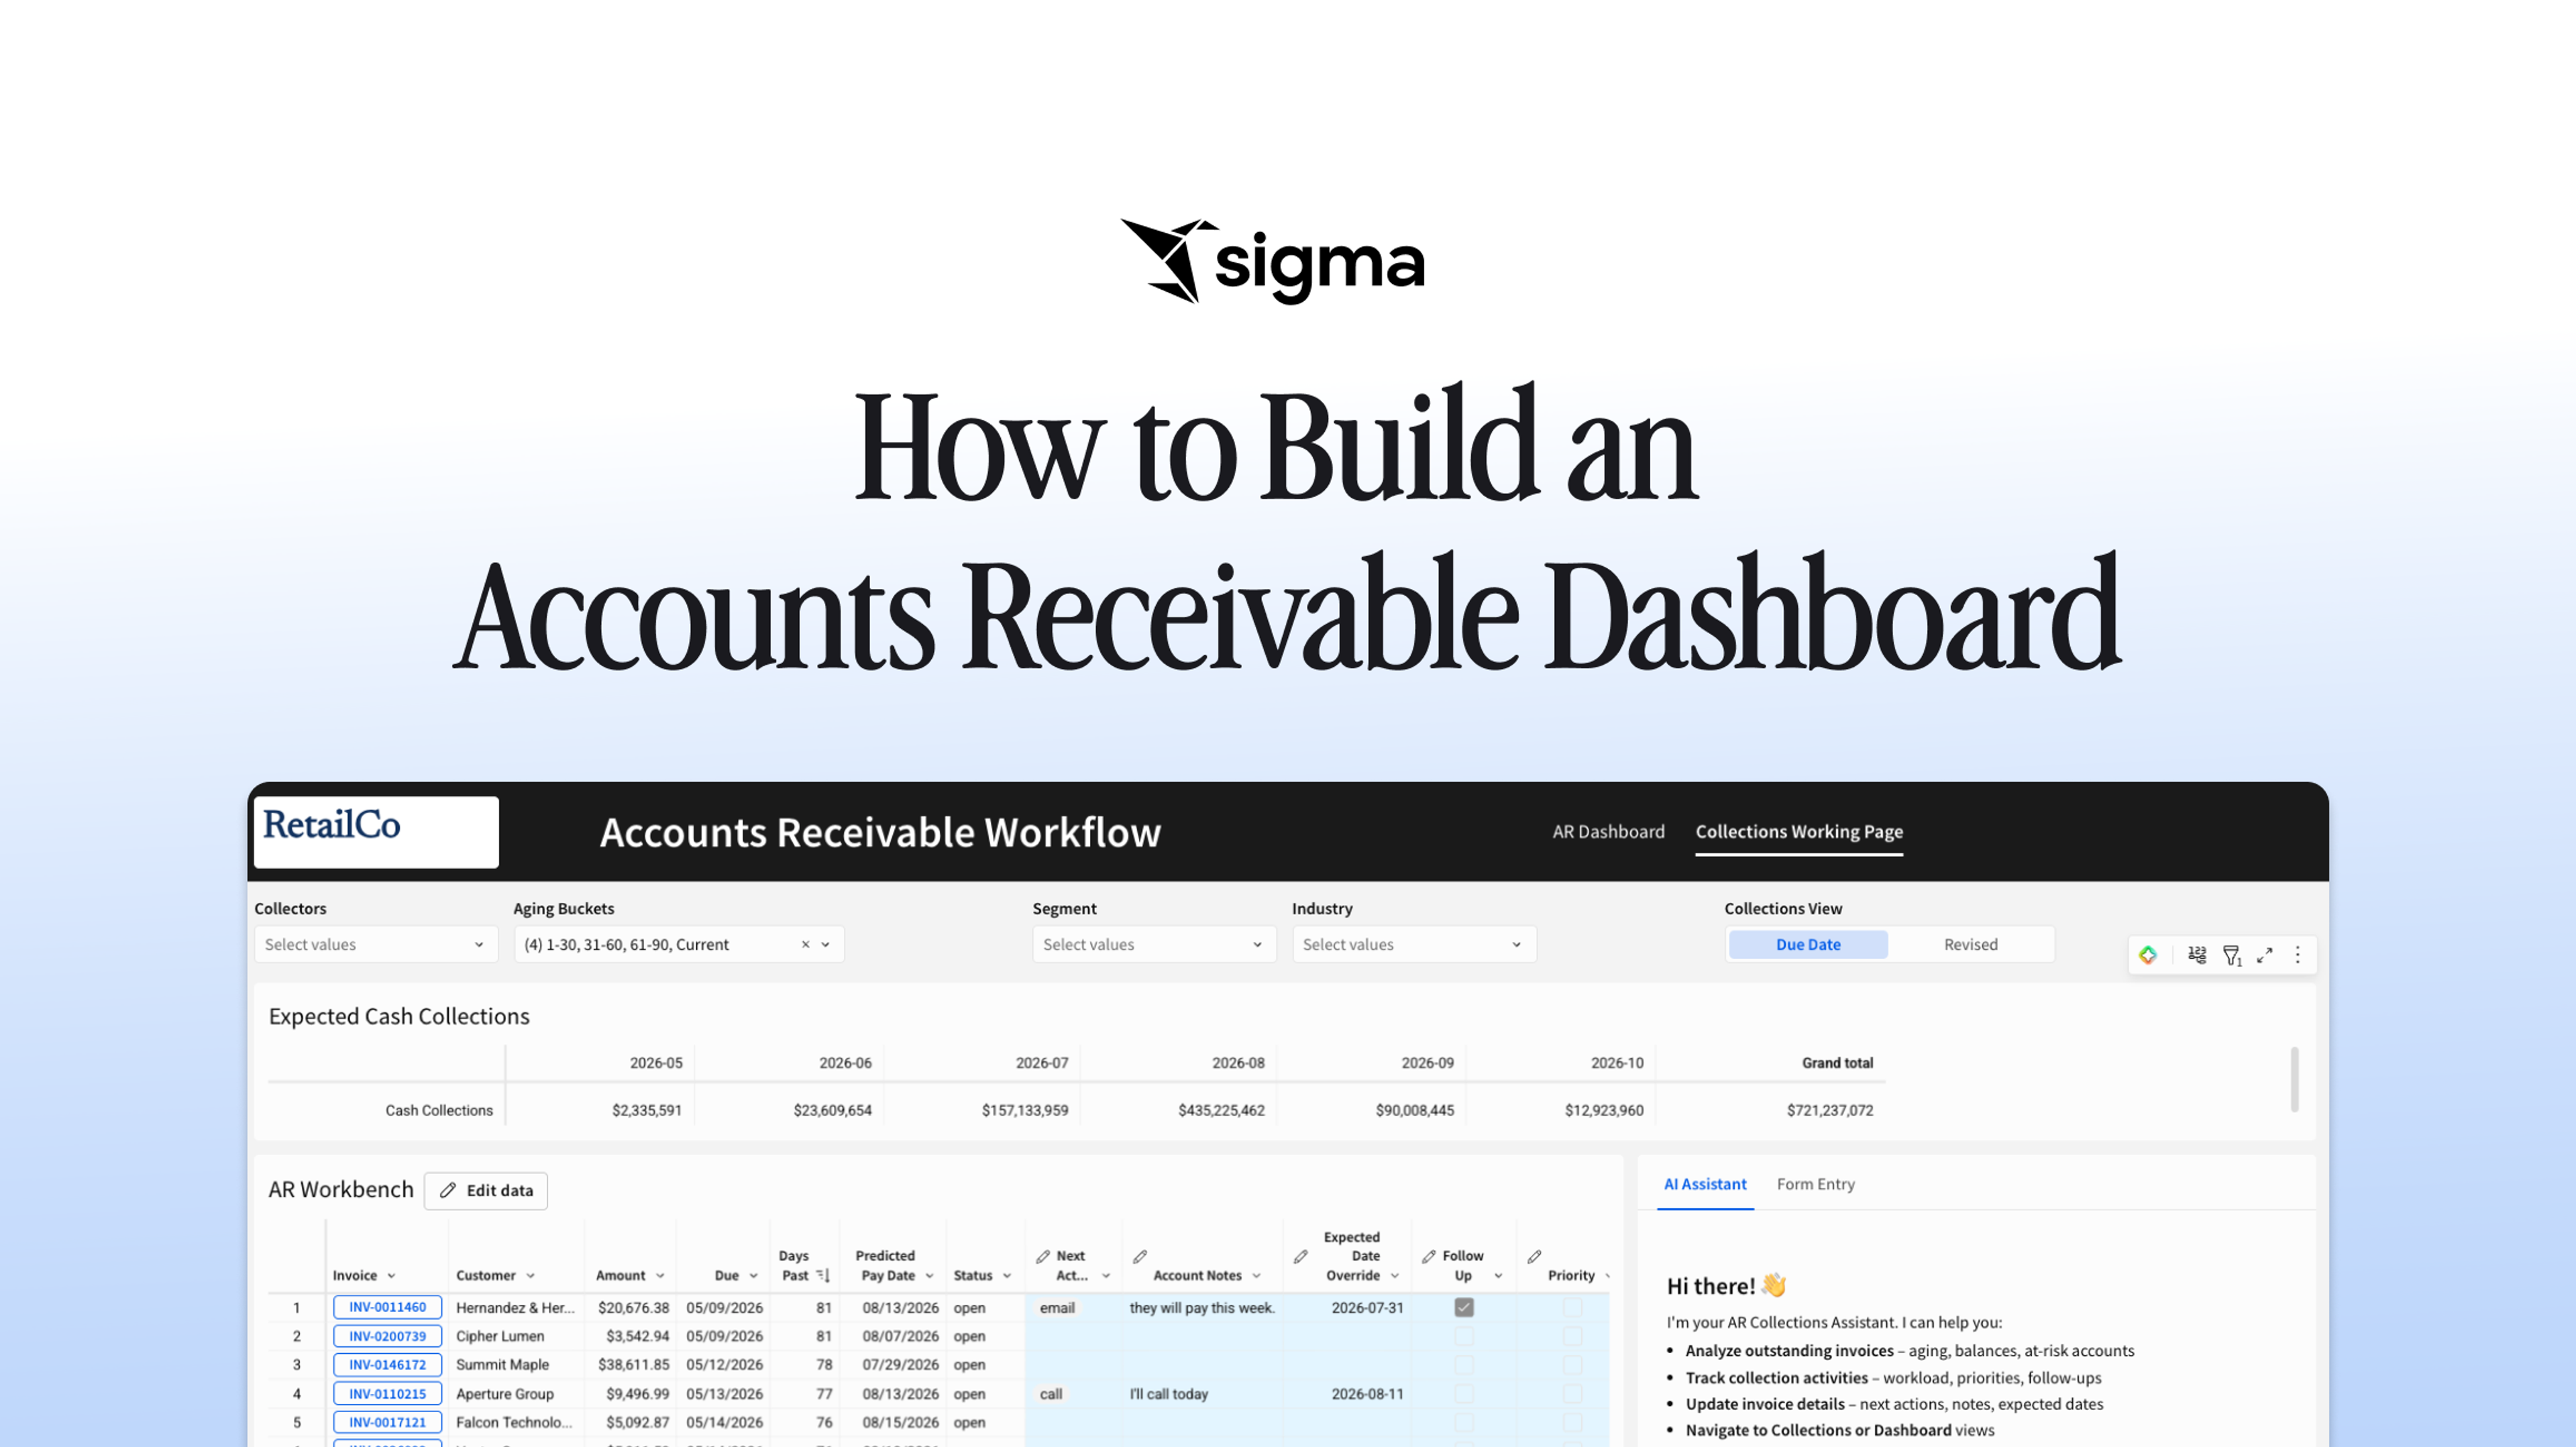
Your finance team already generates much of the data an accounts receivable dashboard needs: open invoices, due dates, customer balances, and payment history sit in the ERP. But the details that actually drive collections don't live there. When a customer promises a payment date, disputes a price, or needs a follow-up call, someone logs it in a spreadsheet, not the ERP. Those notes then scatter across dozens of files that never sync with the source system or with each other, and leadership loses any real view of expected pay timelines across the business — which makes an accurate cash forecast nearly impossible, because no one actually knows when the cash is coming in.
Even the data that is in the ERP goes stale fast without a dashboard: export it to a spreadsheet, and the moment someone hits save, the file is outdated. That same spreadsheet can circulate for weeks before anyone downloads a fresh one, so collectors end up calling customers about invoices they may have already paid. An AR dashboard eliminates both problems: it keeps the ERP data live, and it gives the team a governed place to capture the collection details that used to live only in spreadsheets.
This article covers what an AR dashboard is, what it should include, and how to build one. A good dashboard maps to the collection decisions the AR team makes every day, keeps easy-to-chart metrics in their proper place, and gives the team a way to log the details that never made it into the ERP.
Key takeaways
- The metrics that earn a place on an accounts receivable (AR) dashboard map to specific collection decisions: aging buckets, DSO, expected cash inflow, CEI, overdue and at-risk balances, customer concentration, bad-debt exposure, and dispute resolution time.
- Never read a metric on the accounts receivable dashboard in isolation. For example, pair DSO with CEI and bad-debt exposure to avoid mistaking a cleaner-looking metric for actual progress.
- Writeback is the differentiator: capturing promise-to-pay dates, dispute notes, and follow-up history inside the dashboard — instead of a side spreadsheet — is what makes an accurate cash forecast possible. Sigma's AI agents then act on that same governed data, so the team can ask questions in plain language instead of building a new view.
- Build the dashboard in seven steps: consolidate AR sources into one place, ground it on a live data source, choose metrics that map to collection decisions, add input tables so collection details live with the data, lay out role-specific views, make it easy for the team to get answers through filters, drill-downs, and AI agents, and set access rules so the team trusts the numbers.
What is an accounts receivable dashboard?
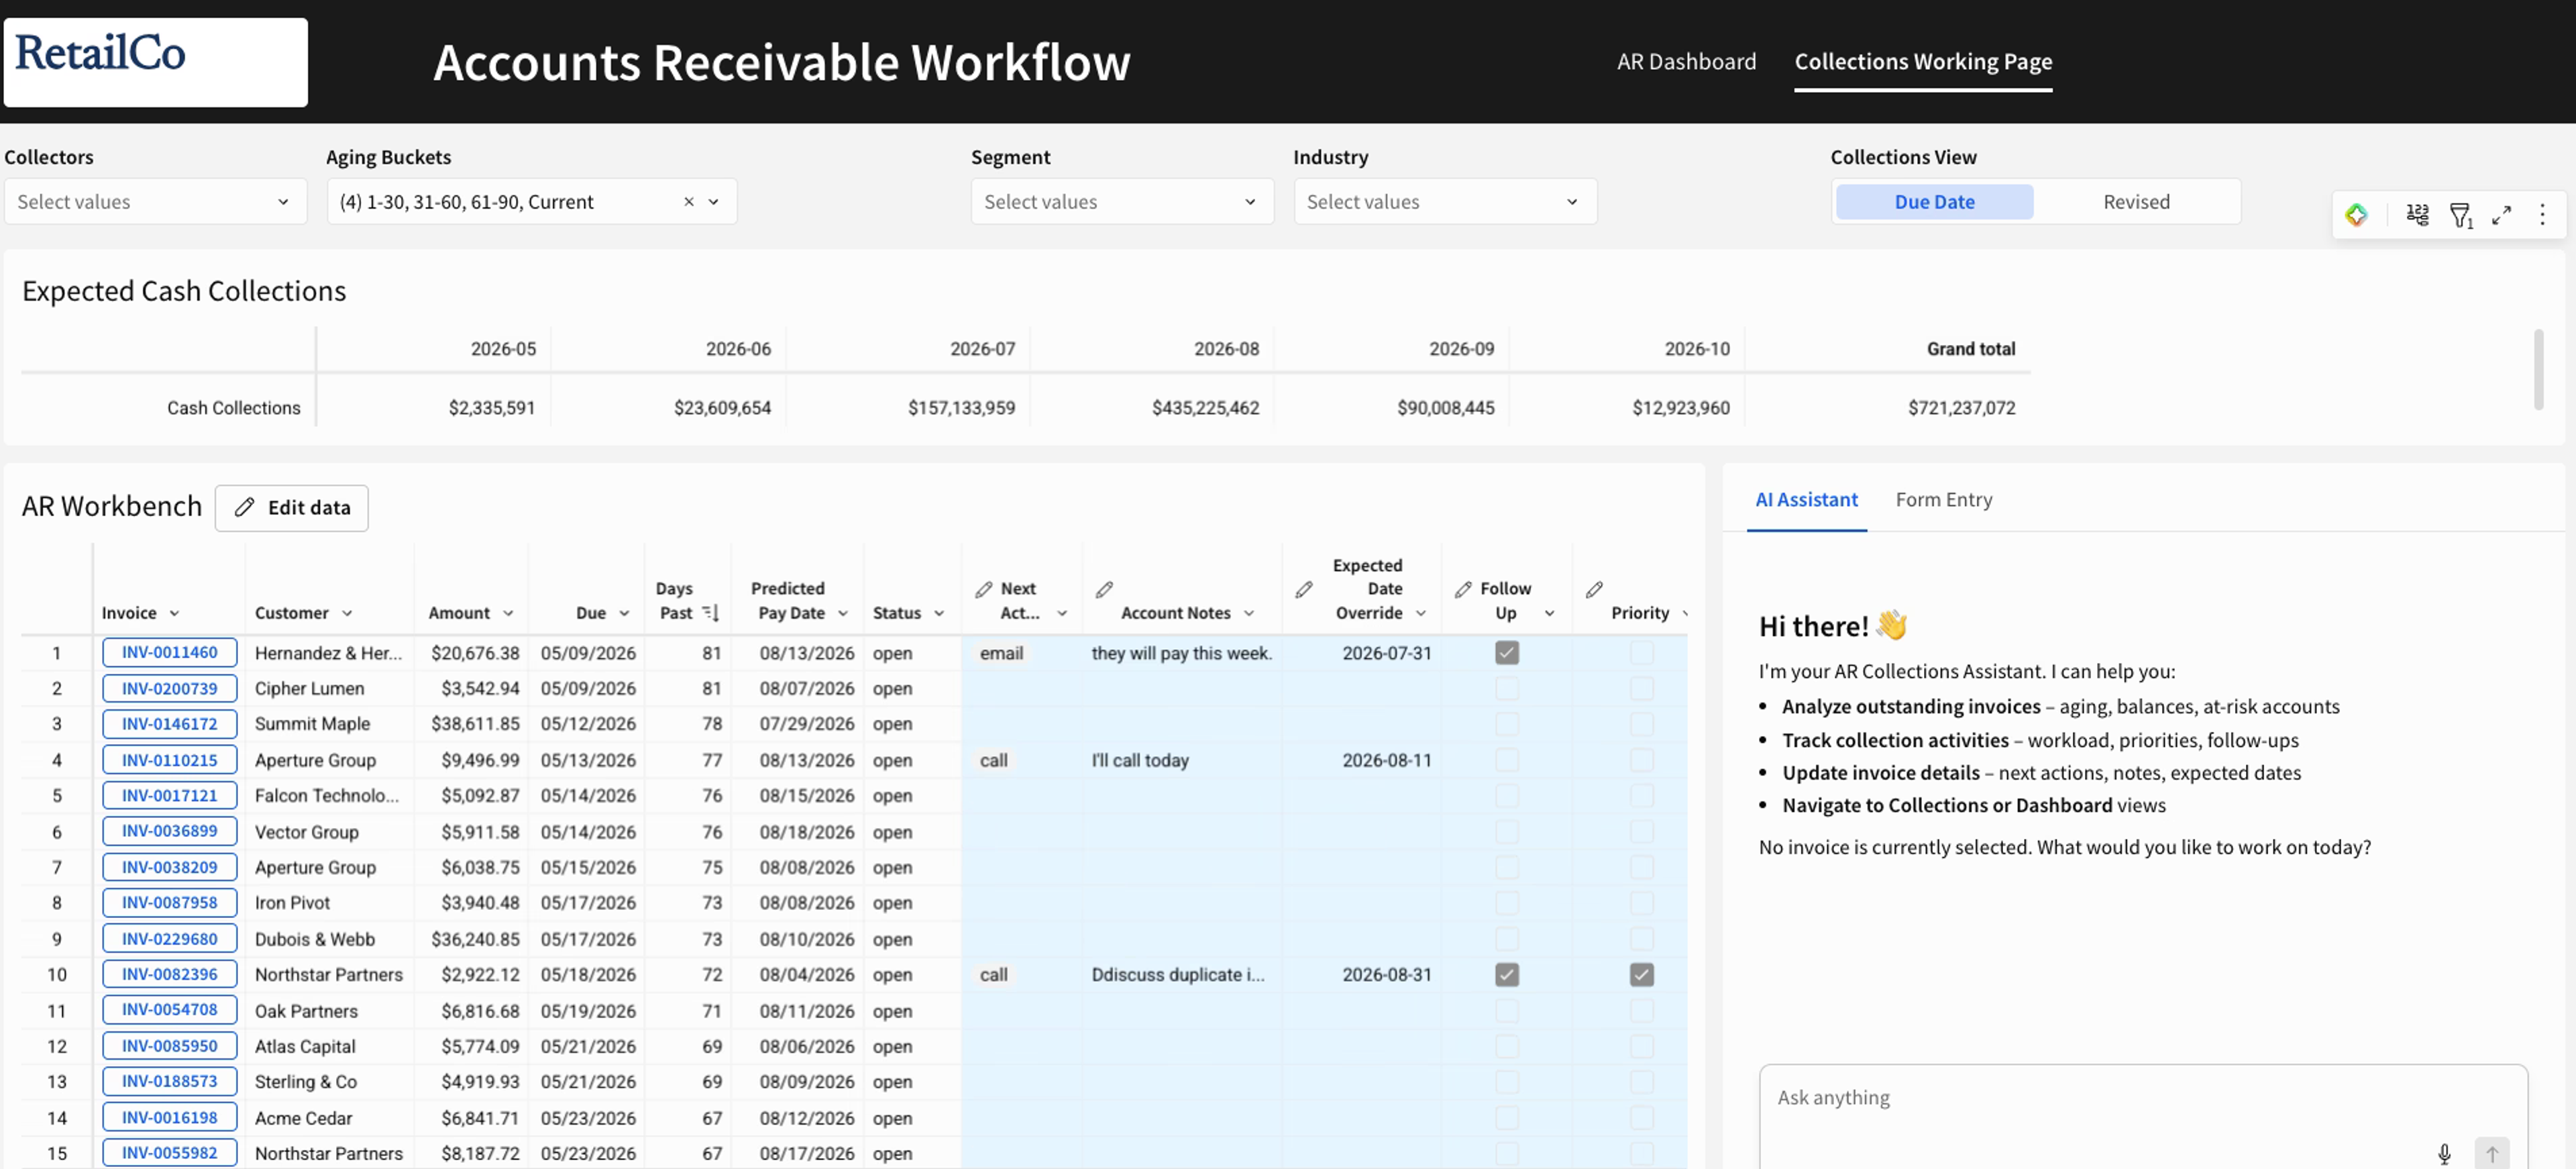
An accounts receivable dashboard is a single interactive view that pulls open invoices, due dates, customer balances, and payment statuses from your accounting systems and keeps them up to date. The AR team can see what is owed and what is overdue at any time, rather than waiting for a month-end report. It turns the AR ledger into a working surface the team uses to drive collections.
Accounts receivable dashboard vs. accounts receivable report
An AR report is a static, point-in-time snapshot built for the record and the period close. An AR dashboard is a live, interactive view built for daily collection decisions. The distinction matters because receivables are time-sensitive. A dashboard that reflects today's numbers lets the team act earlier, before an aging invoice becomes harder to resolve.
| AR report | AR dashboard | |
|---|---|---|
| Purpose | Documents outstanding invoices at a point in time | Supports continuous monitoring and daily action |
| Data freshness | Periodic: daily at best, often weekly or monthly | Continuously synchronized |
| Interactivity | Fixed output, no filtering after generation | Filterable, sortable, drillable by user |
| Primary audience | Auditors, management, periodic reviewers | Collectors, AR managers, CFOs |
| Workflow role | An artifact read after generation | A workspace used during the collection workflow |
AR reports still matter for the audit trail and the close. AR dashboards matter for the work the AR team does every morning. The team can read the status of receivables at a glance and move from analysis to follow-up without switching between a report and a separate action system.
What to include in an accounts receivable dashboard
The metrics that earn a place on an AR dashboard map to real collection decisions. Here is the working set, with the reason each one belongs:
- Aging buckets. Outstanding receivables grouped by days past due (current, 1-30, 31-60, 61-90, 90+). This is where problems first show up, making it a leading indicator rather than a lagging one.
- Days sales outstanding (DSO). How long it takes to turn a sale into cash. Track the trend over time and compare it with your payment terms, but don't treat it as a standalone health score.
- Expected cash inflow. What is due and when, so finance can forecast cash rather than guess at it.
- Collection effectiveness index (CEI). How much of what was due actually came in. The closer to 100%, the more effective the collection effort.
- Overdue and at-risk balances. The accounts that need a call today, ranked by dollar exposure and days past due.
- Customer concentration and credit exposure. Where too many receivables are held by too few customers.
- Bad-debt exposure. What is at risk of write-off. Elevated write-off levels are a warning sign in working-capital analysis.
- Dispute resolution time. Where collections stall on the customer side so that the team can separate payment reluctance from process issues.
One rule governs all of these: never read a metric in isolation. DSO can miss changes in payment terms because longer-term invoices remain current at first, creating terms creep that doesn't immediately show up in the metric. Bad debts can also distort ratios that rely on the accounts receivable balance. Pair DSO with CEI and bad-debt exposure, or you'll mistake a cleaner-looking metric for actual progress.
How to build an accounts receivable dashboard: a step-by-step process
Getting the data and the metrics right matters far more than visual polish. A beautiful dashboard built on inaccurate data is worse than no dashboard at all, because people act on it.
1. Consolidate every accounts receivable data source into one place
AR data is often spread across operational, customer, payment, and communication systems. Invoice data may sit in the ERP, customer records in the CRM, payment details in a banking portal, and collection notes in spreadsheets or email threads. A single consolidated source buys you one number everyone agrees on, which is the precondition for trusting anything the dashboard shows.
Before you build, run a data audit. Standardize customer information and payment terms across systems. Also, establish consistent customer identifiers, as inconsistent IDs can make cross-system reconciliation harder. Look for reconciliation issues that quietly break the numbers, such as unapplied cash that leaves paid invoices open and credit memos linked to the wrong invoice.
2. Ground the dashboard on a live data source
A one-time export goes stale the instant someone generates it. The collector working from a static Excel aging report downloaded once a week may act on information that no longer reflects today's payments or disputes. Connecting to a live source changes the daily decision: the team can see today's balances, payments, and aging, so they call the right accounts and skip those that have already been paid.
A live connection also removes the manual-refresh burden, which matters across multiple ERPs, where building and maintaining separate integrations for different environments can require real engineering work.
3. Choose the metrics that map to the collection decisions AR makes
Start with the decisions the team makes every day: which accounts to call today, which credit terms need review, where cash is going to land this month. Then pick the metrics that answer those questions.
Loading every available field onto the dashboard weakens it, because outcome metrics alone (DSO, aging) usually don't explain why performance is slipping. You need process metrics such as dispute rate and outstanding deductions. The number and dollar value of outstanding deductions are operational measures for the credit department.
A useful core set includes DSO trending downward quarter over quarter, CEI moving closer to 100% as a sign of effective collections, a high share of current AR, low dispute rates, and low write-offs. Add a top-accounts view ranked by both dollars owed and payment reliability, so collectors focus their effort where intervention yields the most cash.
4. Add input tables for the details that live in spreadsheets today
Even the best ERP integration won't capture everything the AR team tracks. Collectors log promise-to-pay dates, pricing dispute notes, who followed up with a customer and when, and escalation flags like stopping shipments or pausing account access. Today, that information lives in side-of-desk spreadsheets that never reconcile with the source data — which is exactly why most collections teams still run AR out of Excel, even with a BI tool in place.
Input tables put that writeback inside the same dashboard as the ERP data, in a governed warehouse table instead of a spreadsheet. A collector adds a note or a dispute flag next to the invoice it belongs to, and that entry becomes part of the same live dataset used everywhere else on the dashboard. Leadership finally gets one view of expected pay timelines across the business, which is what makes an accurate cash forecast possible in the first place.
5. Lay out the dashboard around the questions the team asks most
An AR dashboard with a single view that serves everyone won't really serve anyone. A CFO's monthly portfolio review and a collector's daily worklist are different artifacts. Build role-specific views: an executive view with rolling cash forecast and DSO trend, an AR manager view with collector performance and top overdue accounts, and a credit analyst view with payment history and dispute frequency.
The layout of the dashboard also guides attention. Put the highest-value signals at the top: DSO, aging distribution, and overdue alerts. Screen space is limited, and every element on screen must earn its place by driving an action.
6. Make it easy for the team to get the answers they need
An aggregate DSO figure is nearly unactionable on its own, and a controller may not be able to tell which region, collector, or segment is dragging it down. Give the dashboard a practical set of filters, such as customer name or segment, time period, salesperson, AR clerk, and location, plus drill-downs that let each aging bucket reveal the invoices inside it. Self-service filtering cuts the back-and-forth of one-off report requests, because the person with the question answers it themselves, and segmenting DSO and dispute rate by plant, product line, and customer tier helps the team catch recurring billing defects and prioritize early-pay opportunities.
Filters and drill-downs only get you as far as the views someone built in advance. Sigma's AI agents extend that further: a collector or manager can ask a question in plain language — which accounts are slipping past 60 days, why DSO moved last week — and get an answer grounded in the live warehouse data, without waiting on a new dashboard view.
7. Set access rules and governance so the team trusts the numbers
A dashboard is only as useful as the team trusts it, and trust depends on governance. AR teams handle high-value financial and customer data, so role-based access and row-level security matter. Each collector stays focused on the accounts they are responsible for, and confusion about processes drops.
Where possible, enforce scopes at the data layer rather than in front-end display logic that someone can circumvent. A practical role structure looks like this: collectors see assigned accounts, credit analysts see accounts under review, collections managers see the full team's portfolio, and executives see aggregated views.
Best practices for building an accounts receivable dashboard
An AR dashboard earns its place only when people use it to decide, and the practices that matter most are the ones that make every surface-level number trigger the next action.
- Start from the decision the collector needs to make. Design each view to drive a specific action. If a number doesn't trigger a specific next step, it belongs in a scheduled report, not on an operational dashboard.
- Keep the data live so the view reflects today. Collector-facing views need frequent, operationally appropriate sync intervals rather than weekly refreshes, and the refresh timestamp should sit visibly on the surface so the team knows exactly how current the data is.
- Make every metric point to a next action. Document a decision rule for each metric as you add it. If DSO crosses a threshold, the manager reviews credit terms for top-exposure accounts.
- Govern access so the right people see the right customers and balances. Row-level security supports both performance and control. Each collector works a clean, scoped view, and Sigma logs every export with user identity and timestamp.
Treated together, these practices shift the dashboard from a reporting artifact to an operating tool.
How Sigma delivers accounts receivable dashboards
Sigma is the runtime layer to build and scale analytics, apps, and agents on live cloud data warehouse data. It sits between the cloud data warehouse and the AI tools generating against that data. The artifacts those tools produce (workbooks, dashboards, AI Apps, and agents) become production-ready software that inherits the company's existing governance.
For a finance team, the build doesn't require a separate BI skill set. Sigma runs on the warehouse through a spreadsheet interface, so if you can write a SUM formula, you can query billions of rows of live AR data.
Here is how Sigma supports you in creating an AR dashboard:
- Live warehouse data through a pushdown architecture. Formulas, filters, pivot tables, and sorting on the dashboard compile into SQL that executes inside the connected warehouse. There is no in-memory engine, no extract, no snapshot, and no row-count ceiling beyond what the warehouse itself can handle.
- Writeback through Input Tables. Collectors record notes, promise-to-pay dates, and dispute flags in governed warehouse tables from inside the dashboard. Sigma captures every change in an audit trail covering the original record, the new record, who changed it, and when.
- Sequenced actions for approvals and external systems. Submit, approve, route, and email workflows chain directly off the dashboard. A write-off above a threshold can route to the controller for approval before it posts. An approved credit memo can trigger an API call into the billing system. Actions reach external systems without Sigma ever storing payment data.
- Governance inherited from the warehouse. Row-level security and column masking persist at query time, so each collector sees only their assigned accounts, while the manager sees the full portfolio. Sigma doesn't store, extract, or cache customer data: only the rendered result returns to the browser.
- AI Column for in-grid LLM commentary. A builder can add a column that runs an LLM prompt against each row, governed by warehouse row-level security. It can generate a one-line variance explanation per overdue account, summarize recent customer notes, or categorize a dispute reason, all inside the dashboard grid alongside the other AR columns.
- Sigma Assistant for plain-language AR analysis. The team can ask why DSO moved last week or which accounts slipped past 60 days and get answers grounded in the warehouse, with the query visible and the result traceable to a workbook. Sigma Assistant runs on the customer's choice of model, so Sigma routes AI through the company's own stack for control and lineage.
If collectors don't trust the numbers on the AR dashboard, they'll revert to manual spreadsheets and side-of-desk logs. Sigma delivers live, governed data, writeback inside the dashboard, and actions that fire on the same surface, giving the finance team the confidence to trust the AR dashboard.
Build your accounts receivable dashboard with Sigma
Building an AR dashboard the right way is a real project. You need to consolidate ERP, CRM, and payment data into one source. The view has to stay live. Metrics should map to collection decisions, and layouts need to fit each role. On top of that, you'll add filters and drill-downs, then govern who sees which accounts.
In legacy BI, all the steps required to build an accounts receivable dashboard span data engineering tickets and dashboard tools that work with extracts. Collection notes end up in separate writeback apps, with a permissions model layered on top. The dashboard ships, and then it slowly drifts. The data goes stale, and the access rules become outdated.
Sigma ensures that your AR dashboard lives on as a single, governed, live workspace that the finance team owns. The AR team builds and maintains the dashboard themselves. They record collection activity in the same workbook via Input Tables. Approvals and external system calls route through sequenced actions. Row-level security is inherited from the warehouse, so each collector sees only their accounts.
Get a demo or try Sigma free to build your accounts receivable dashboard on live, governed data.