Introducing Table Styles with Sigma
Tables are the lifeblood of how organizations consume data—yet most BI platforms completely ignore their styling. Whether the goal is to reinforce brand recognition, highlight critical metrics, or to fiercely grab attention, having the options to adjust the look and feel of elements like tables are a necessity. With our latest release, Sigma is introducing Table Styles that elevate how tables are consumed by organizations, giving them the first-class formatting they deserve.
This quarter, Sigma is introducing a comprehensive Table Styles feature for tables, pivot tables, and also input tables. Let’s explore why it’s so important to design data tables in BI dashboards, and dive into how Sigma empowers users to style tables in the most efficient and intentional way.
Why Should I Style Tables and Spreadsheets?
Data tables have always provided a structured and organized view of data that can be deeply explored and precisely validated in a way that other visualizations do not. Due to this advantage, tables and spreadsheets are the most commonly used representations of data in various industries, and are frequently shared, presented, and displayed for a wide range of audiences.
But when sharing, presenting, and displaying any content, it’s important that it looks good as well as personal. That means breaking out of the enduring no-frills method for presenting numerical and textual information, and adding more aesthetic appeal.
“Things look great right out of the box, without the need for advanced design skills.”
Designing a table or a spreadsheet can also go beyond aesthetics. Personal styling is essential for branding, association, and directing focus. It influences the user experience, readability, as well as the overall effectiveness of data analysis. A well-designed table also helps users quickly grasp the information presented, facilitating better decision making. Additionally, consistent styling across multiple tables and dashboards ensures a cohesive visual identity, facilitating easy comparison and creating a seamless experience for users.
Even better, these styling features reduce the design skill level needed for a technical analyst to curate a beautifully-designed dashboard. That means things look great right out of the box, without the need for advanced design skills.
Coming This Quarter: Sigma Table Styles
At Sigma, tables and spreadsheets are our bread and butter. Many of us believe that tables and spreadsheets are the ultimate data visualization, on top of Sigma already being widely familiar, easy-to-use, and extremely flexible.
Any and every Sigma user can create or explore a table within the platform. It’s highly encouraged for every individual to expand any chart to a table view and dig into the data without relying on other teams for answers. Table styling is the newest iteration of this, in order to make these tables even more impactful and effective.
“Personal styling is essential for branding, association, and directing focus.”
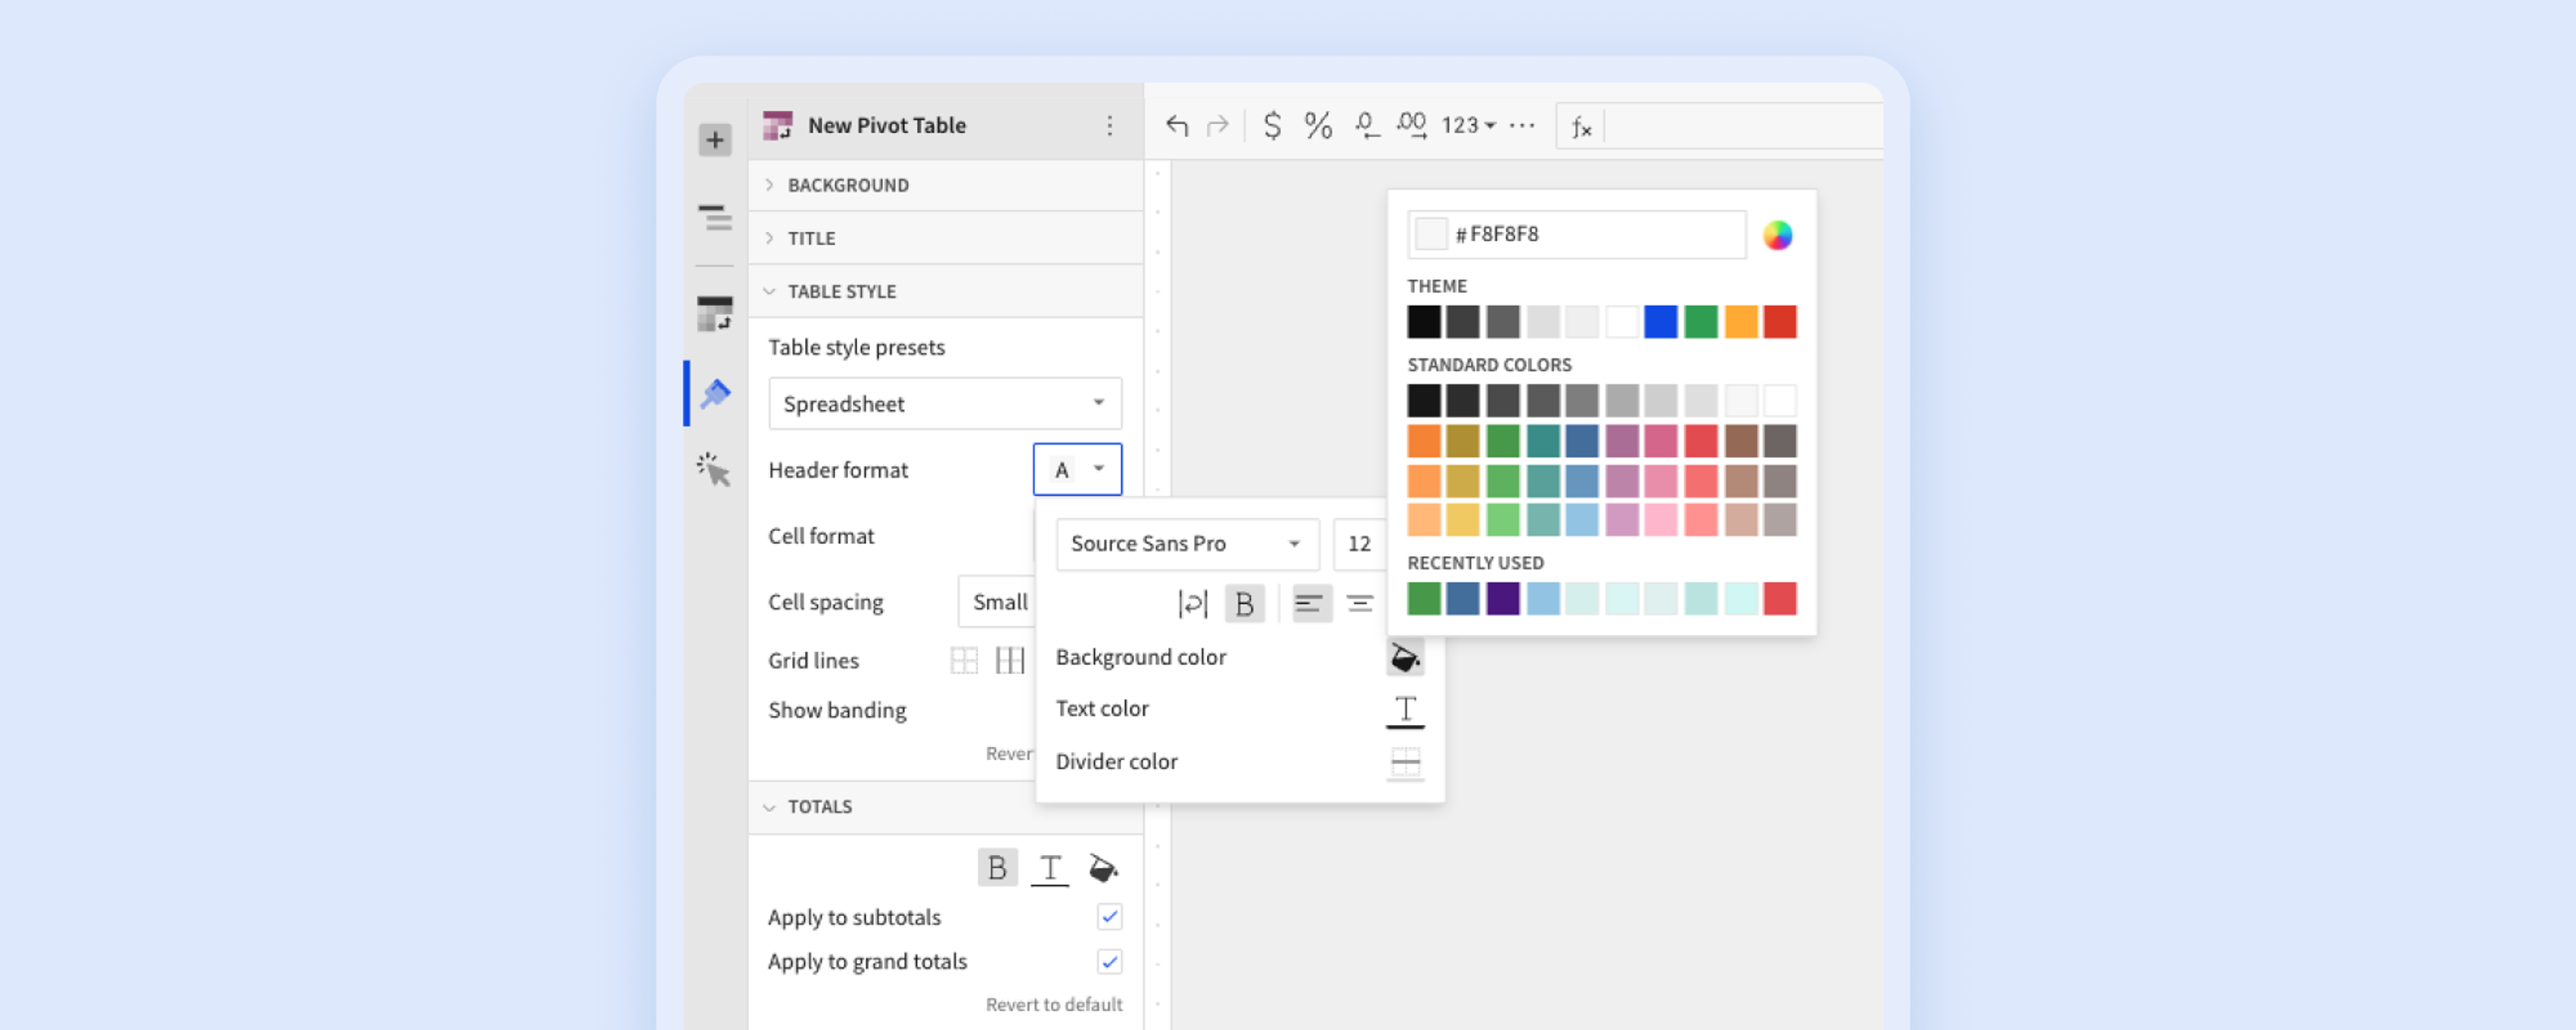
Our Table Styles feature is made up of several smaller design features that can now be applied to any tables, pivot tables, or input tables to enhance their look and readability. Customizations include header styles, header colors, gridline options, font options, cell spacing, and more. And if a certain combination of styling options feels perfect, it can be saved as part of your Workbook Theme, allowing the style to be reused and shared by an entire organization.
Note: Public Beta of the feature will be in December 2023. The addition of Table Styles to Workbook Themes will not be included in the Public Beta, but will be included later in the quarter with the General Availability (GA) release.
Tip: Users can use the “Copy/Paste Format” by right clicking on a table or with the keyboard shortcut (ctrl+alt+c) to copy styles from one table to another as a shortcut in the meantime.
The Advantages of Sigma’s Table Styling
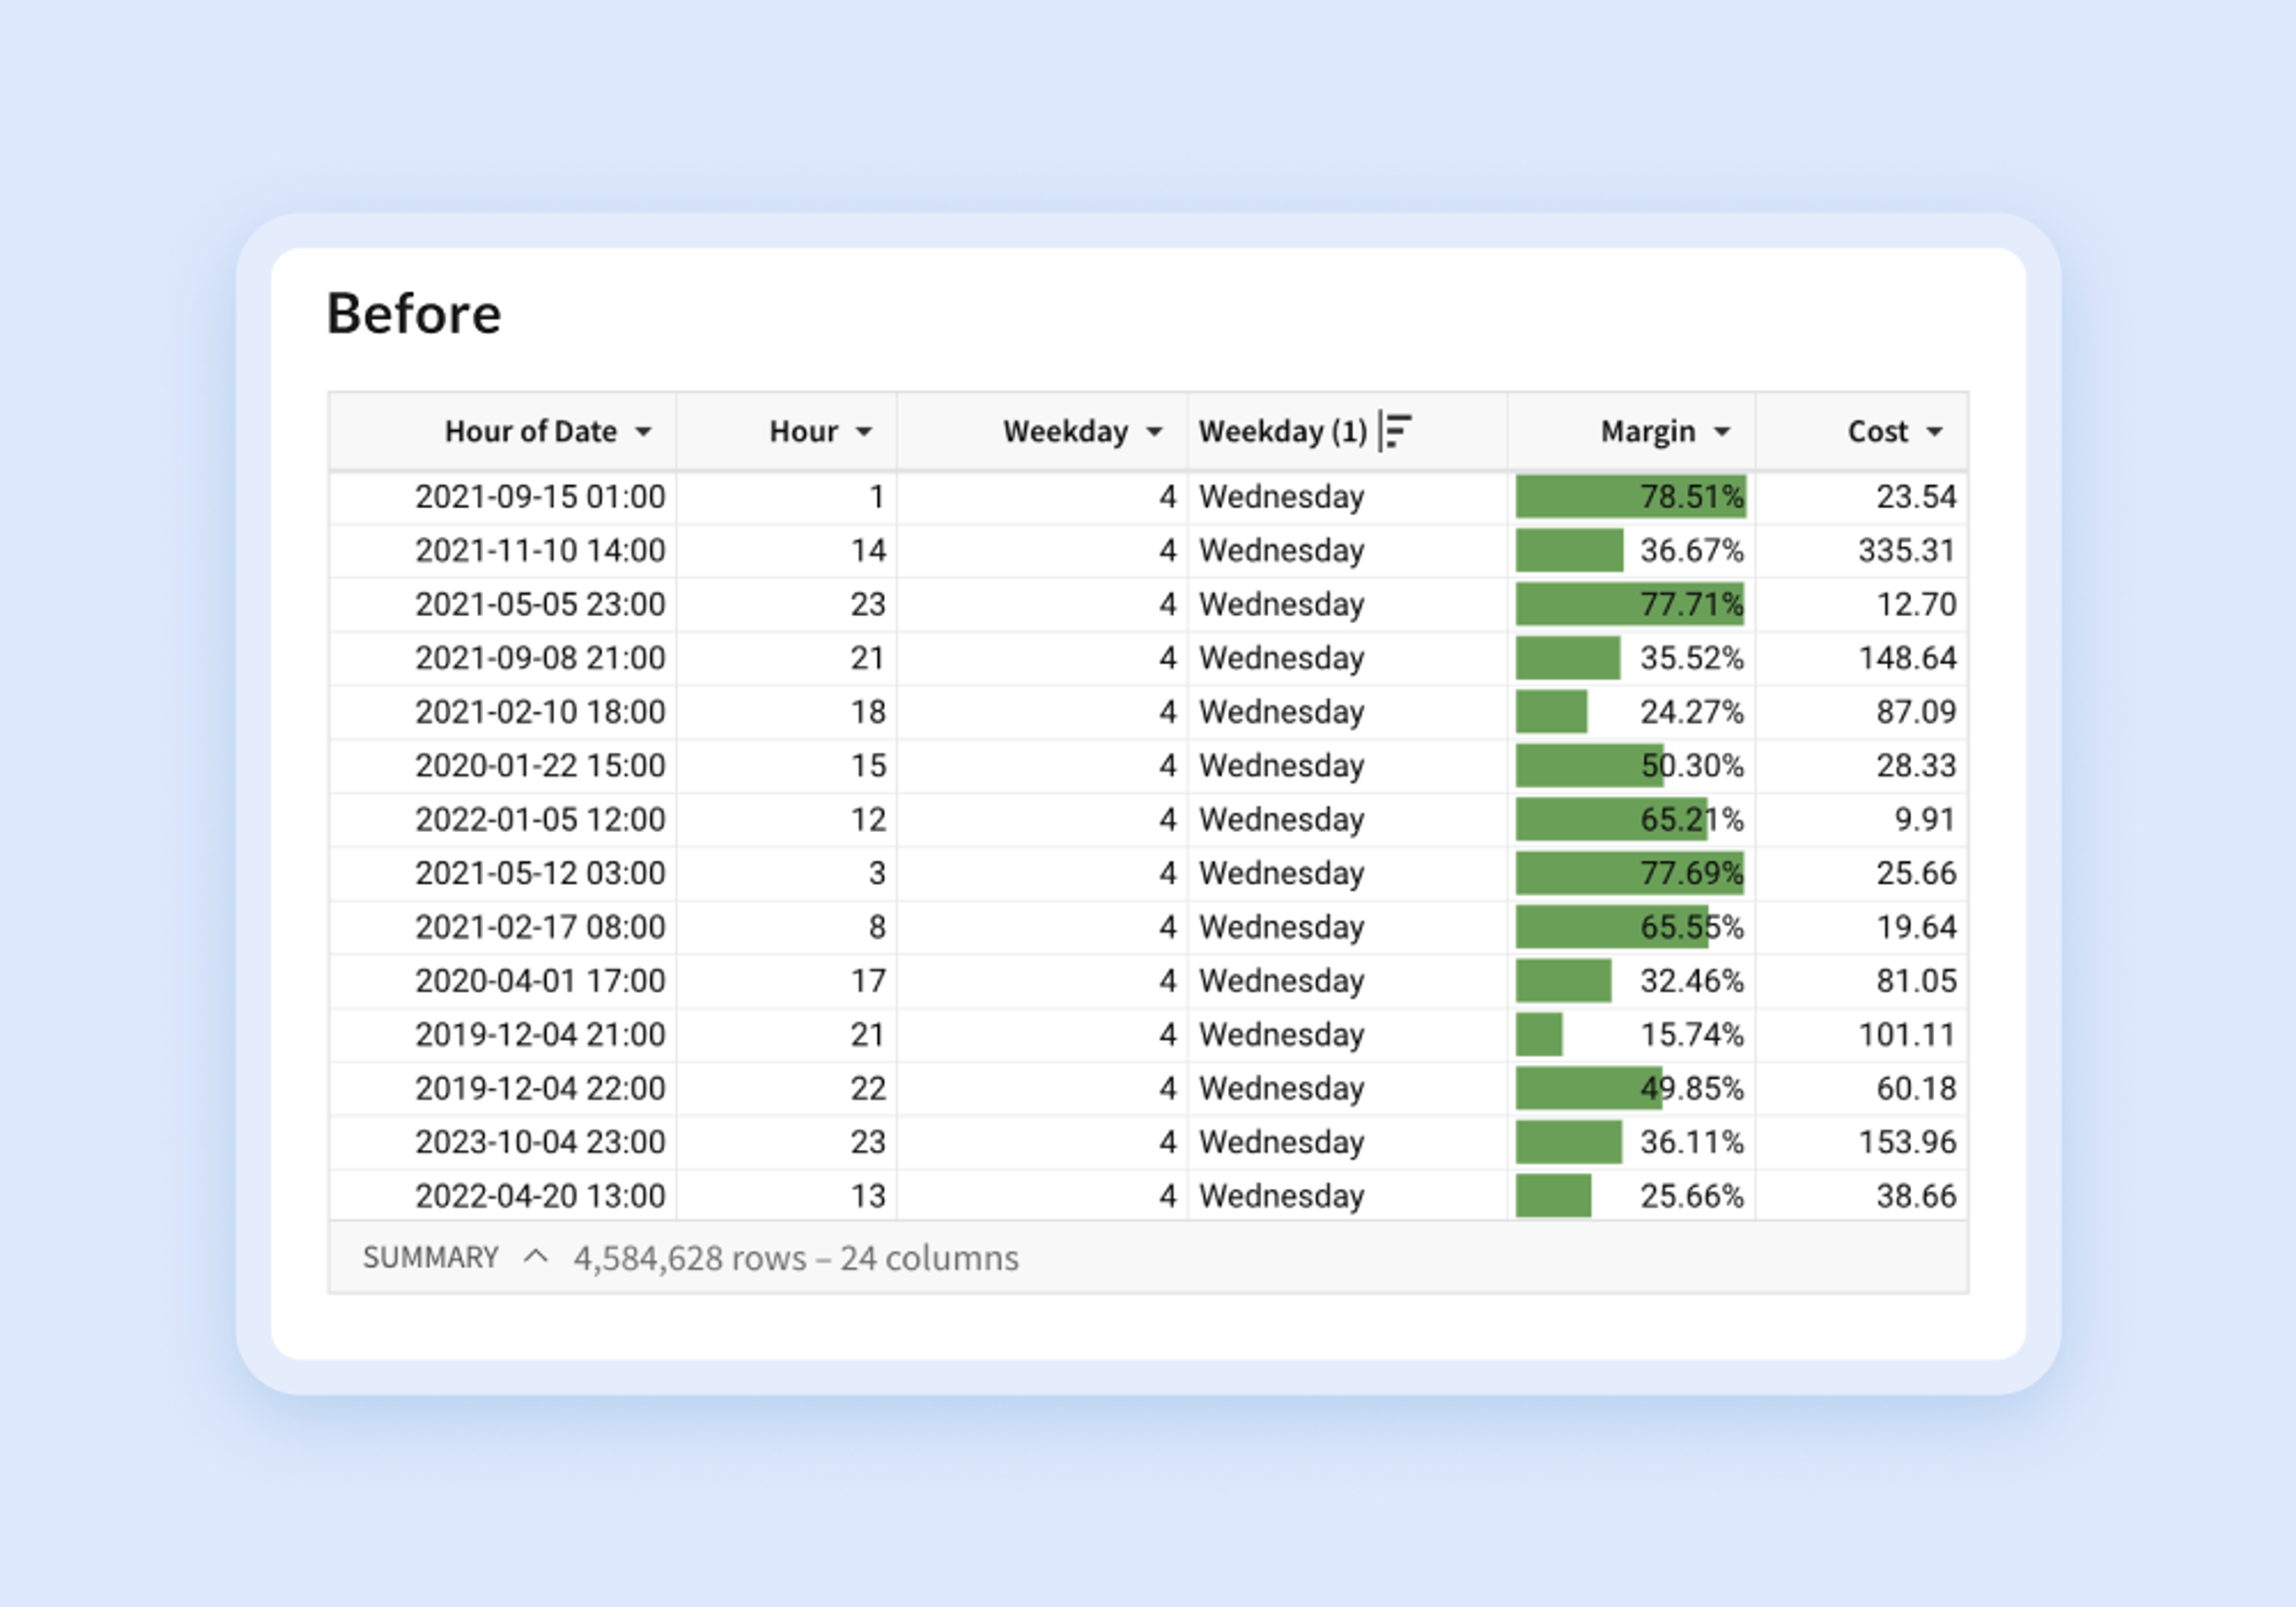
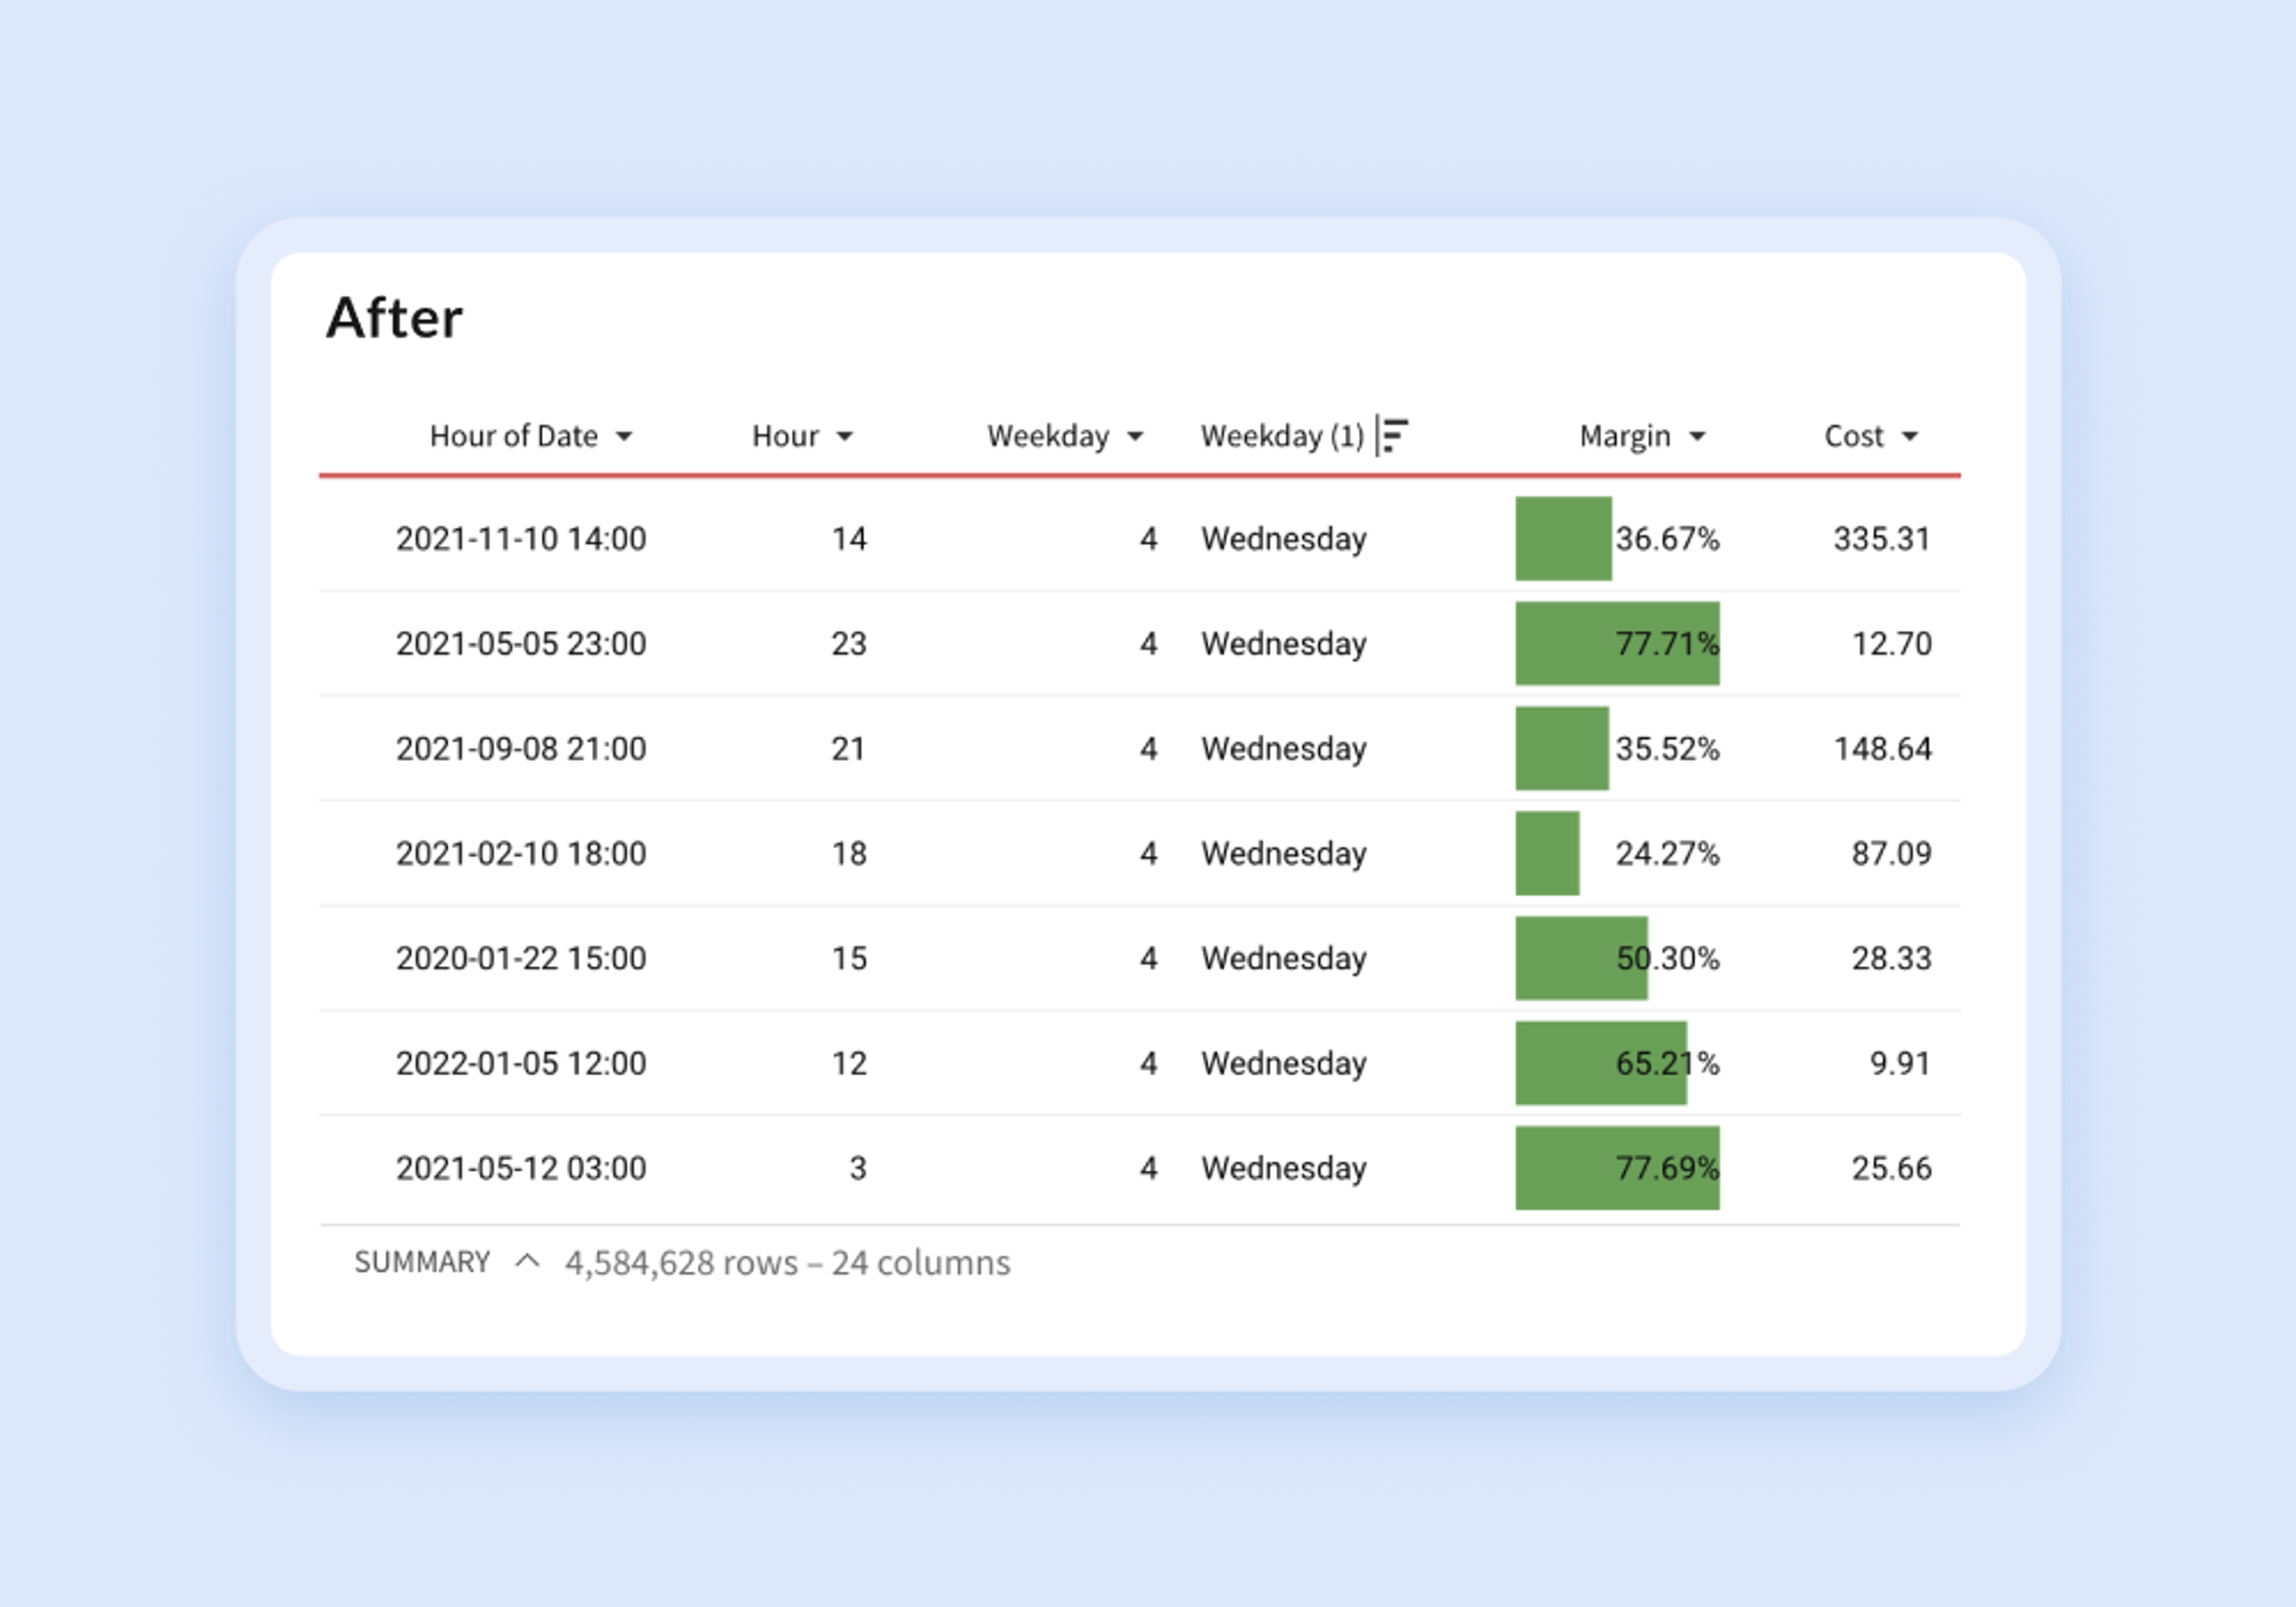
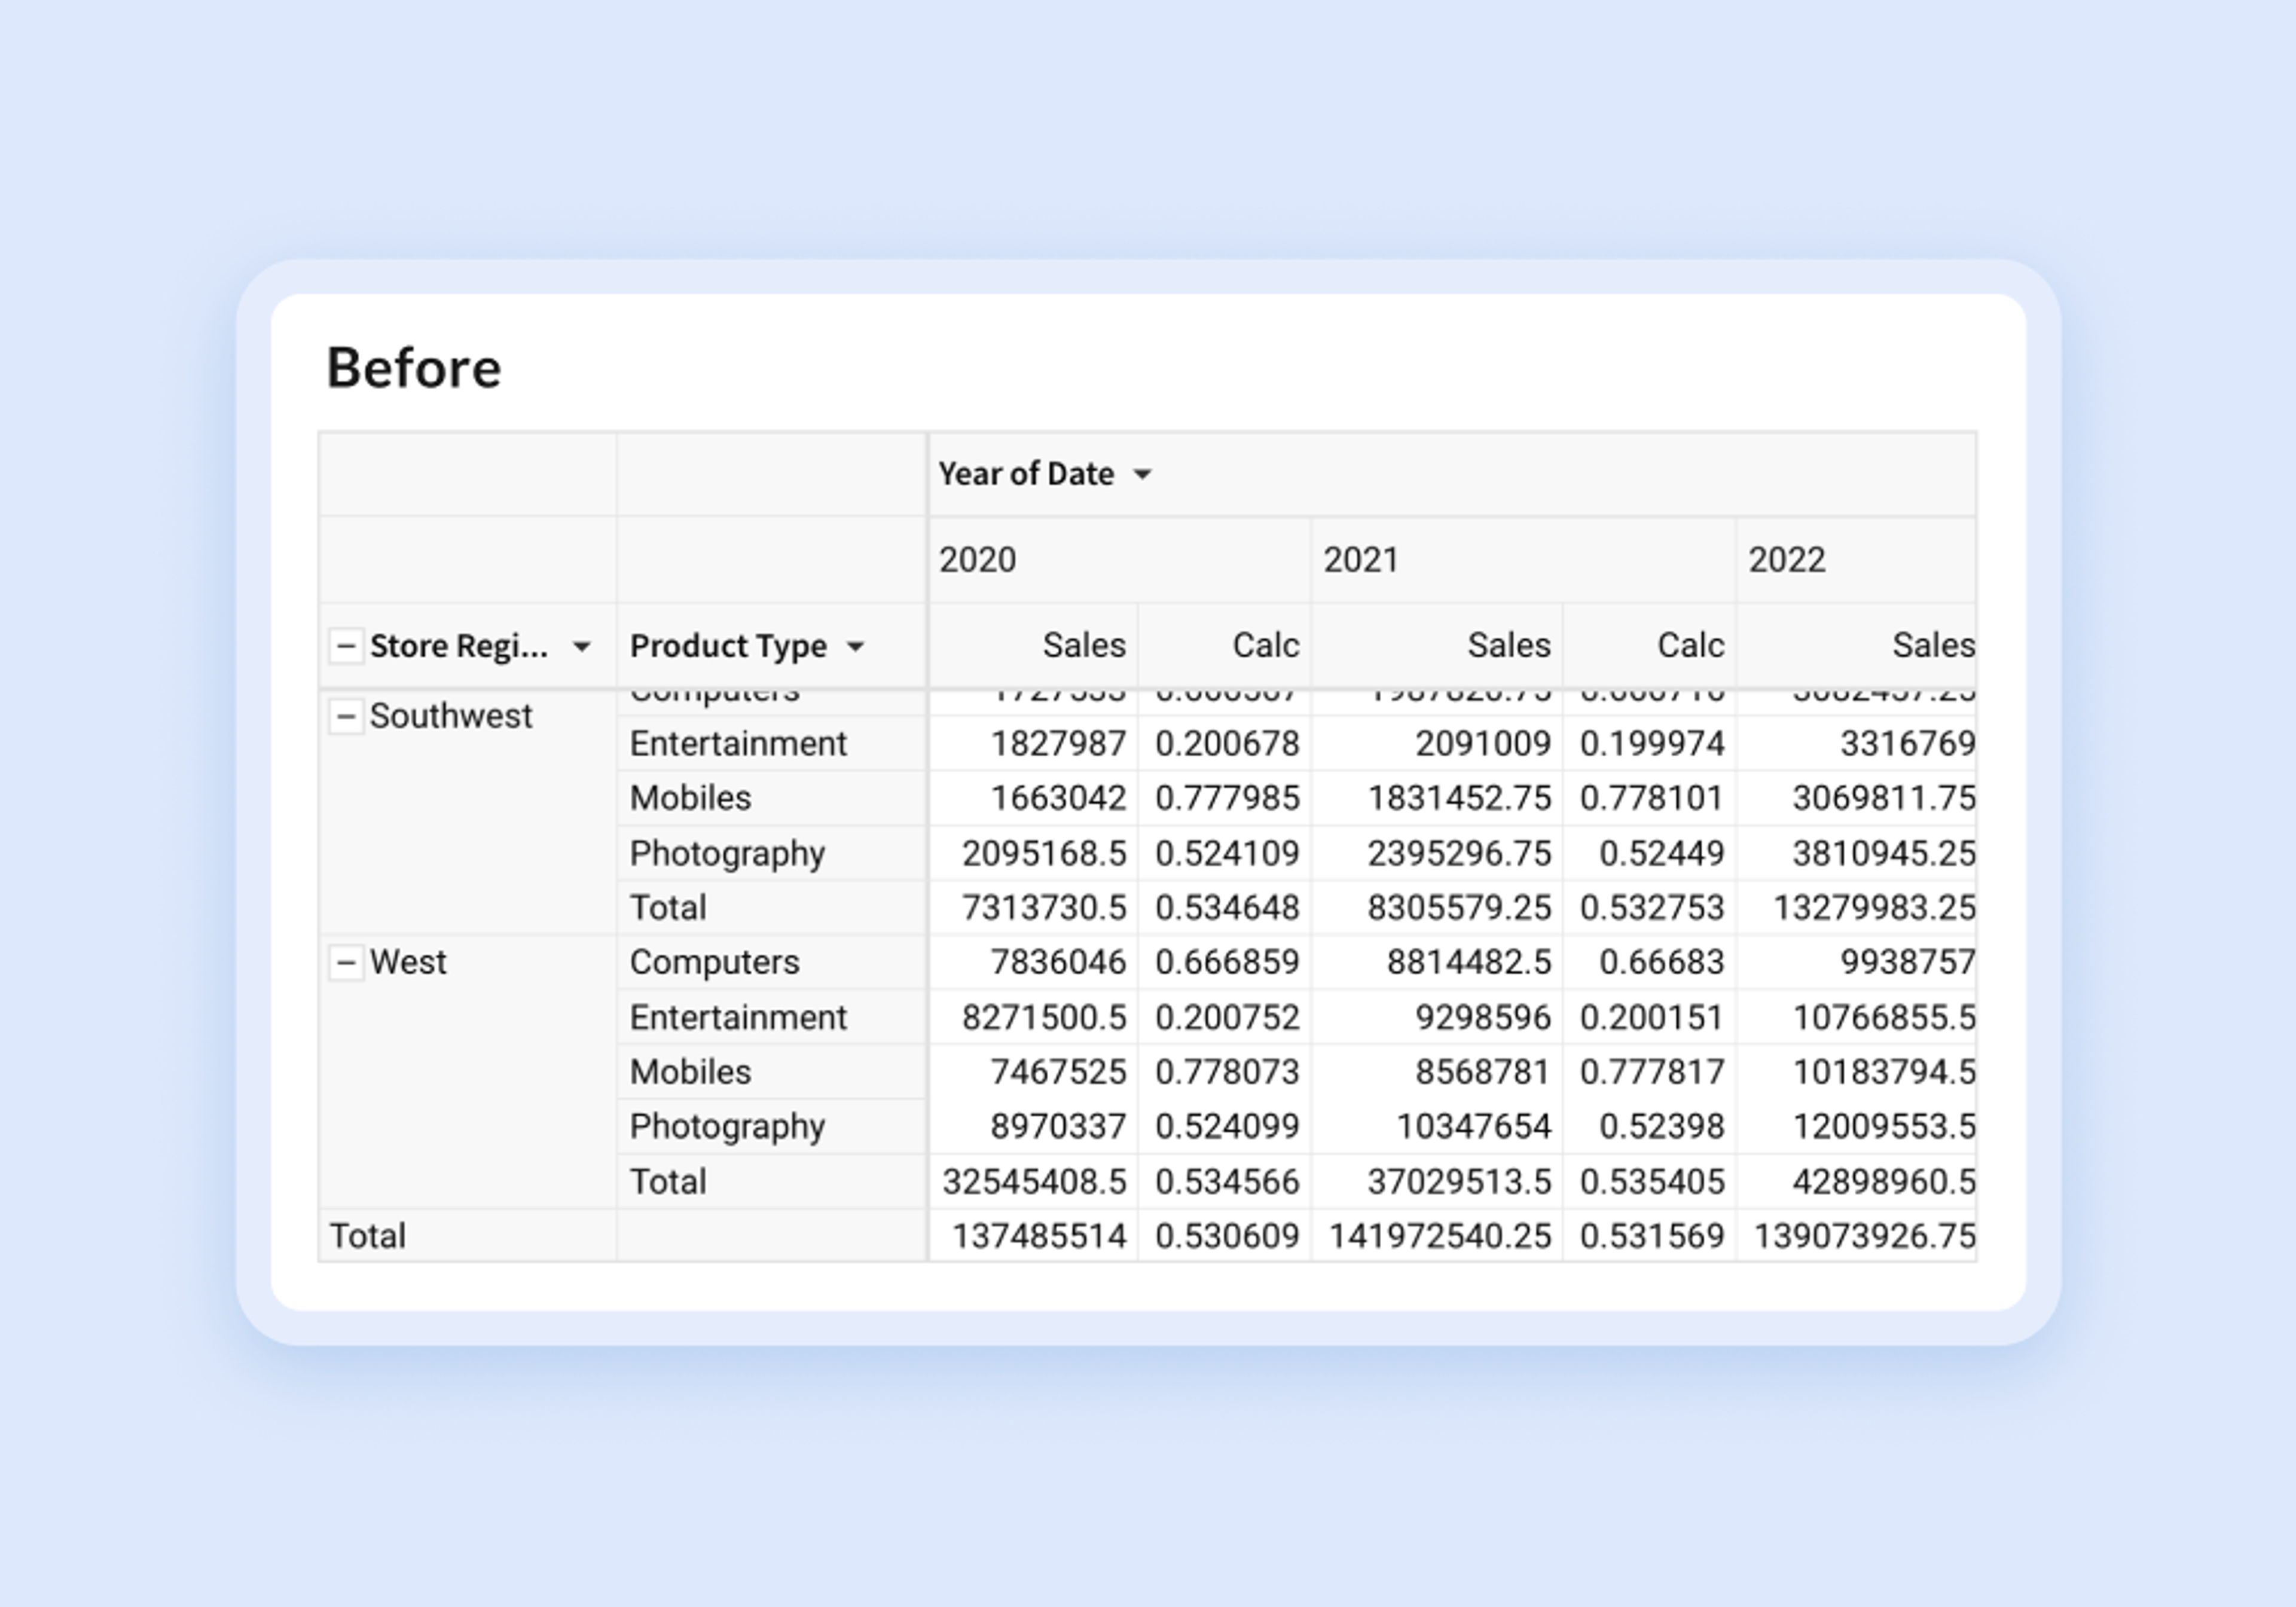
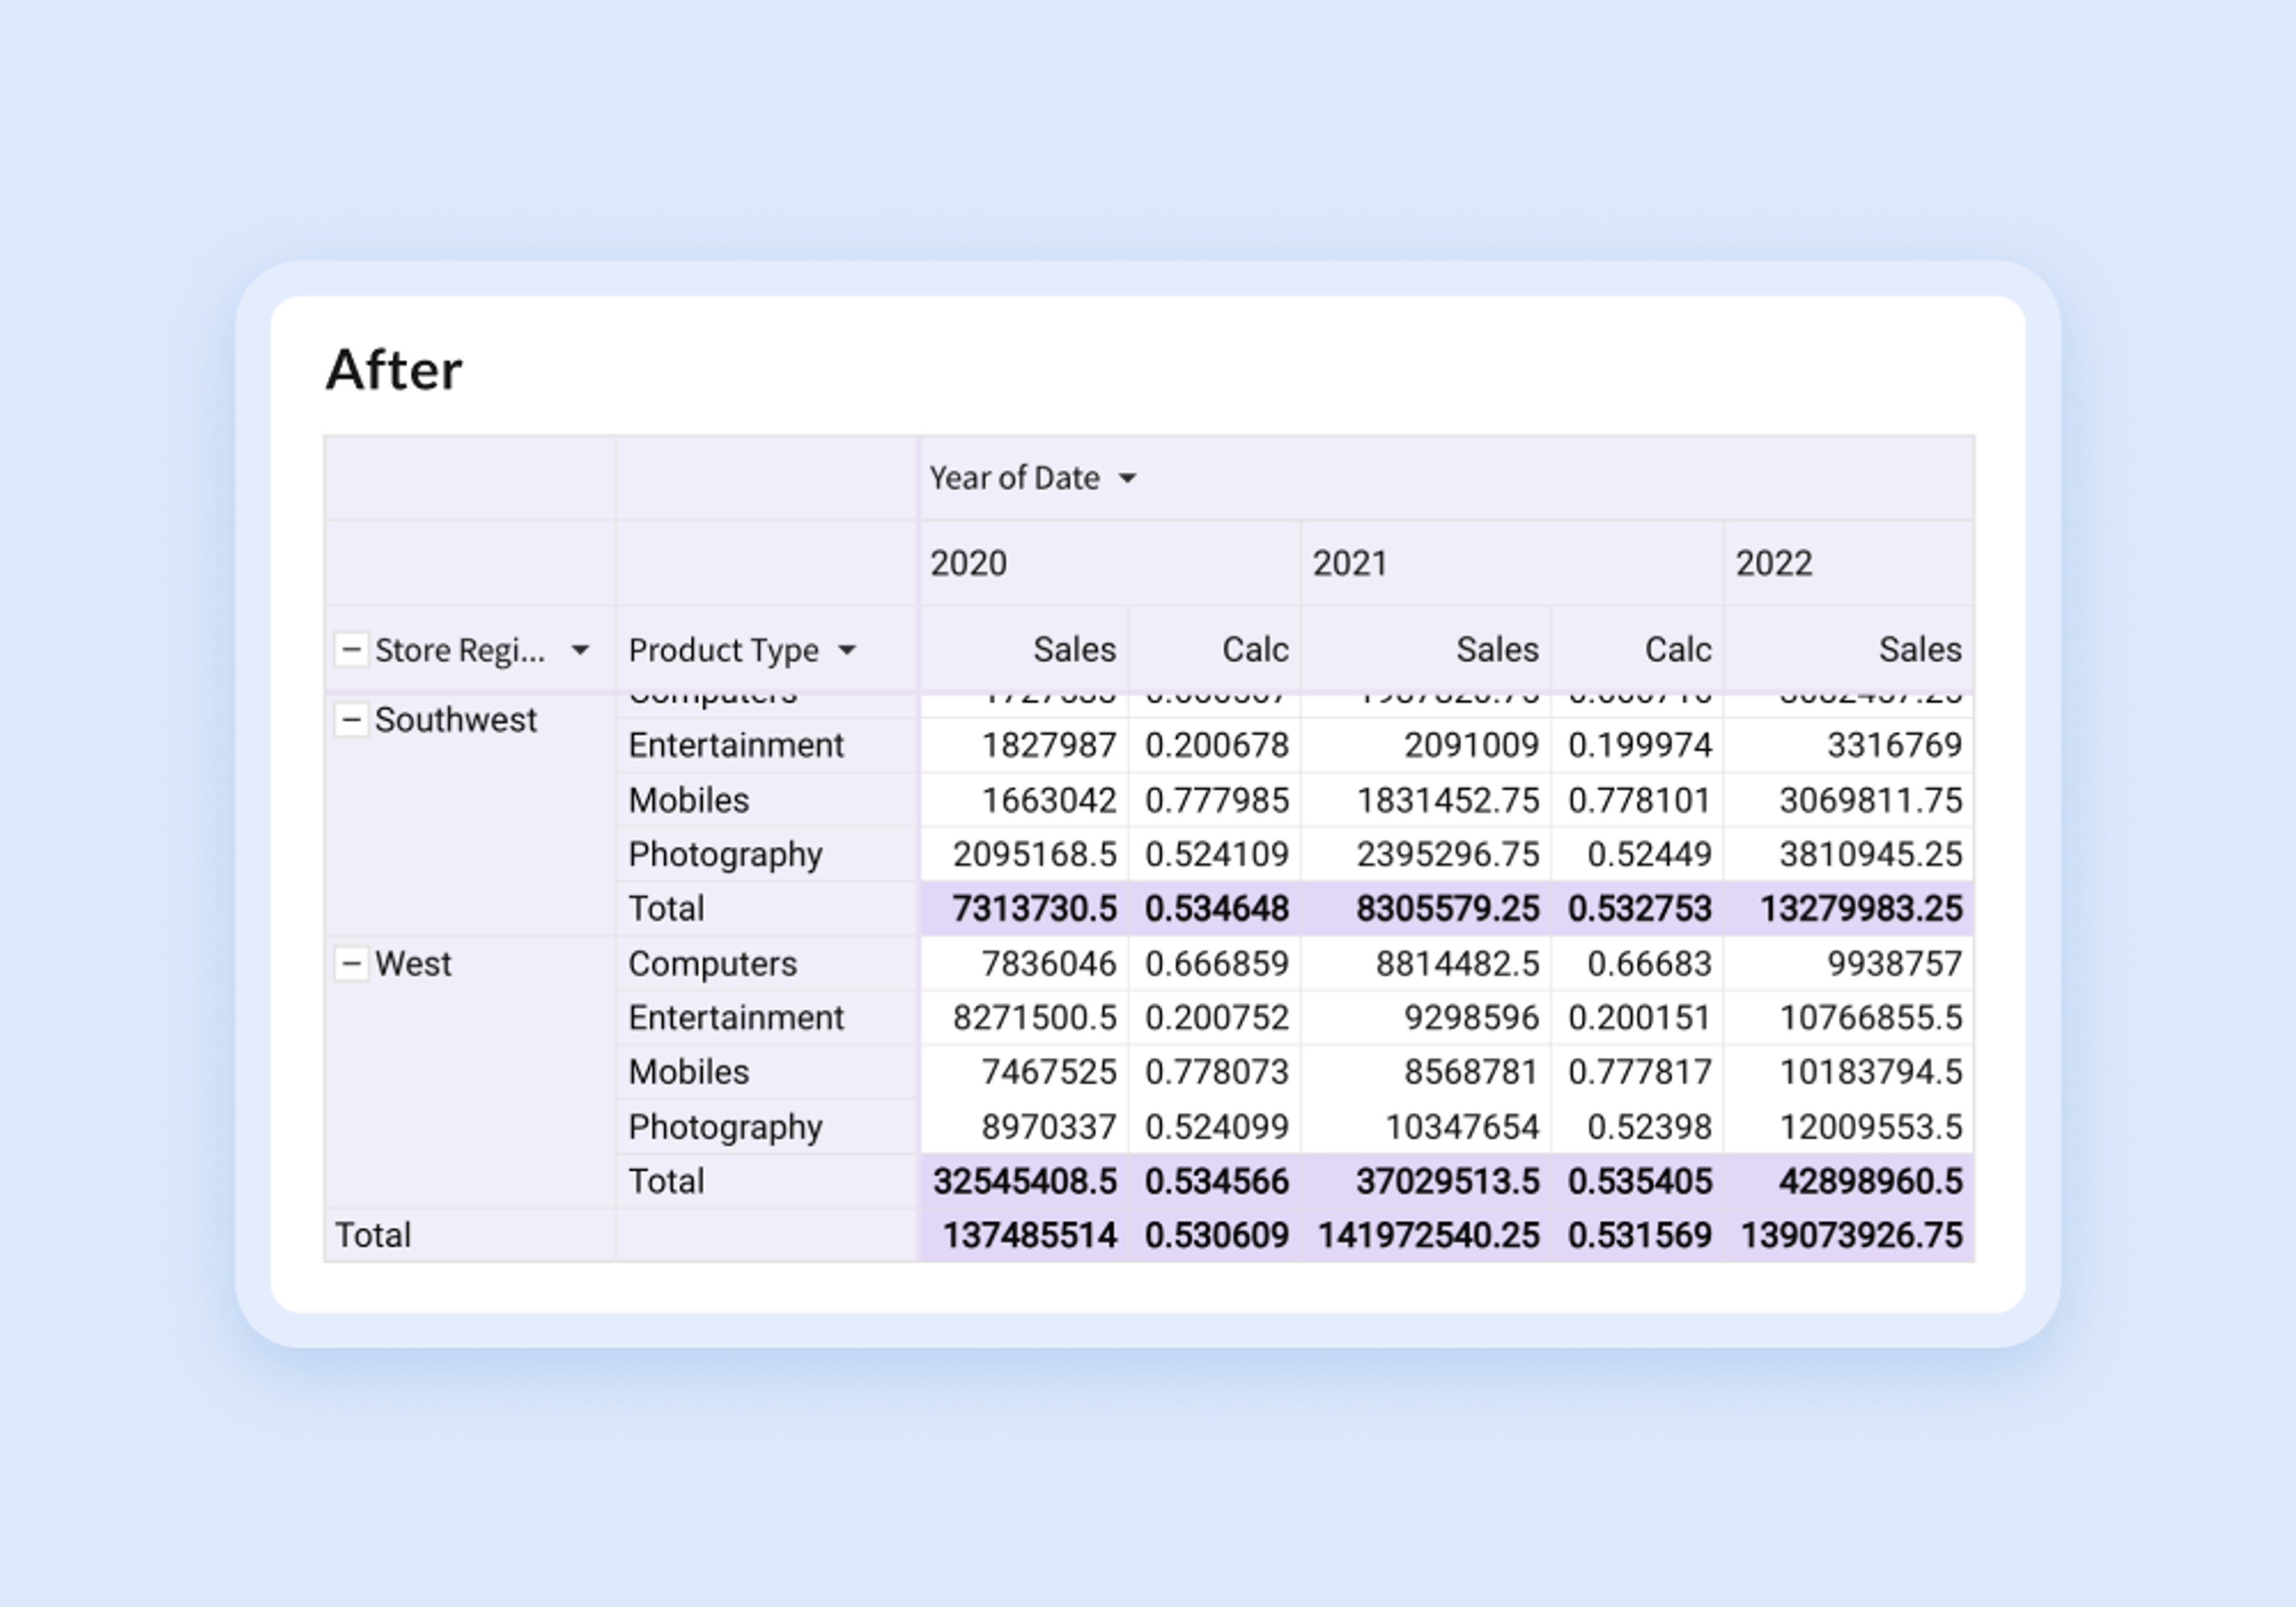
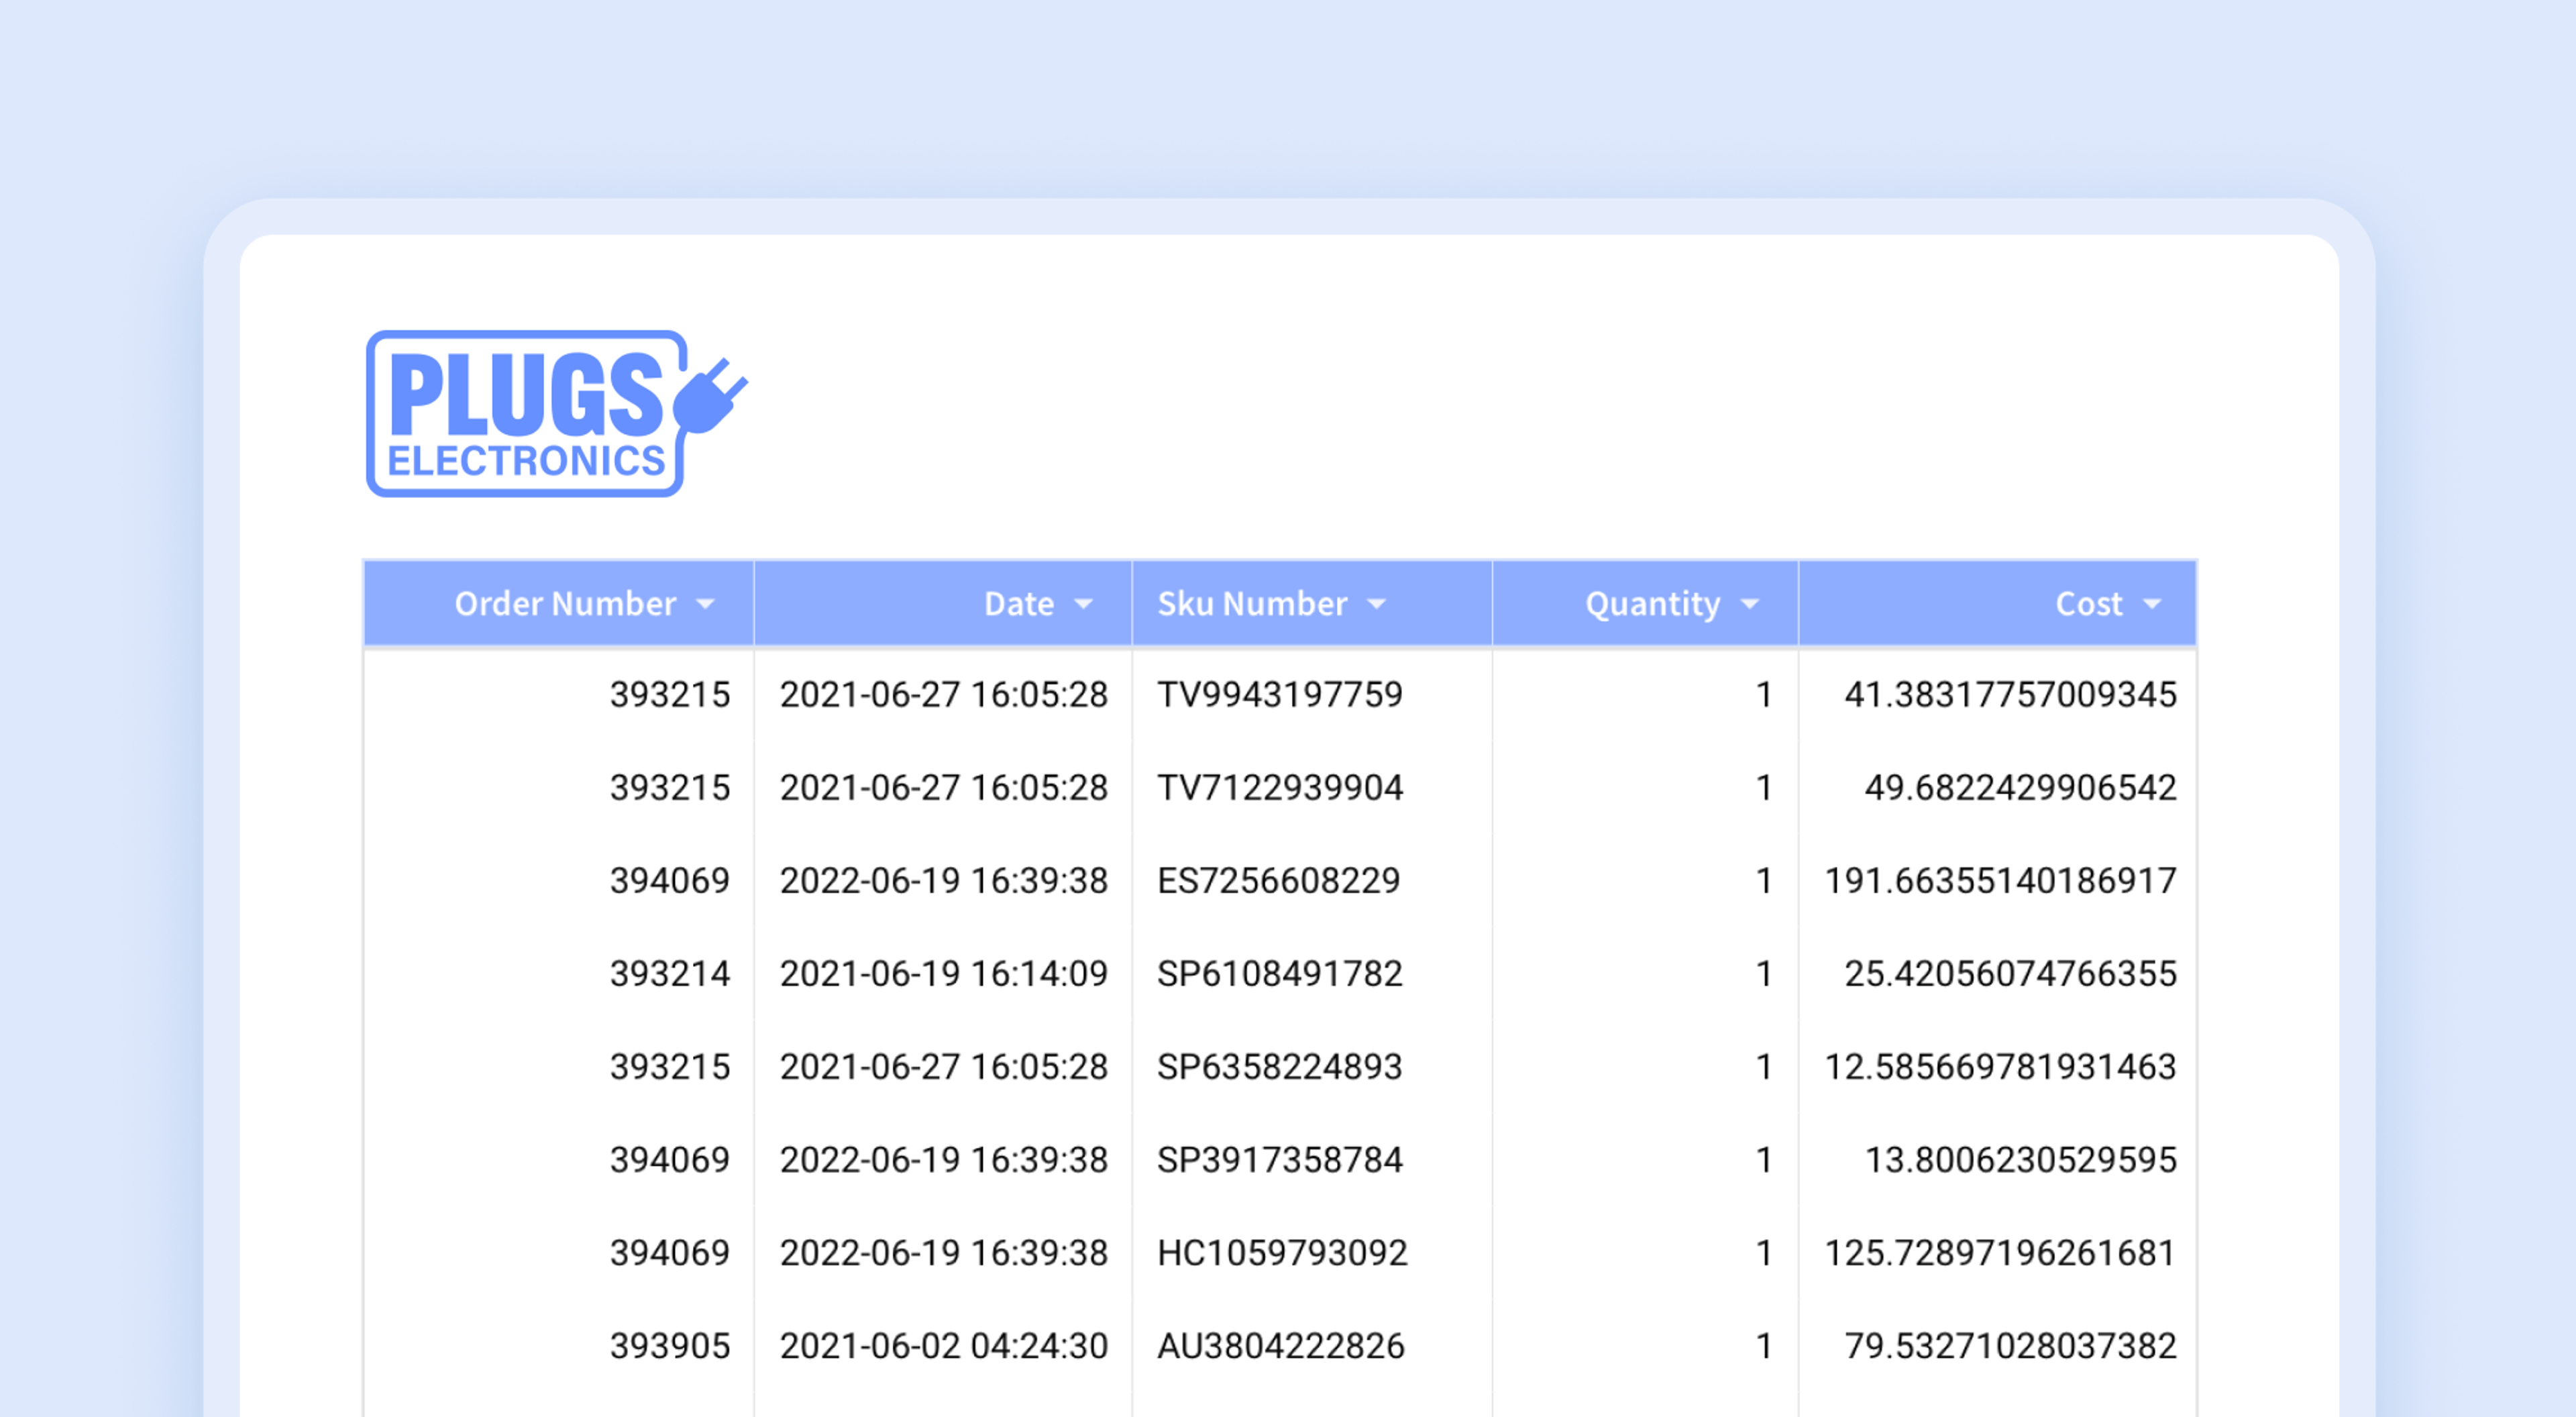
The new table styling options offer several advantages when creating workbooks. The examples below show a before and after for what will be possible with the new styling features coming soon.
- Improved aesthetics: The new features enable customization options such as header styles, cell spacing, and gridline options, making the tables more visually appealing.
Designing data tables in business dashboards is a critical aspect of effective data visualization. With Sigma's upcoming customization features, including header styles, cell colors, cell spacing, gridline options, as well as the ability to incorporate them into themes, users will be able to easily make any dashboard more visually appealing and tailored to their specific needs. By leveraging these styling capabilities, businesses can stay true to their brand and empower their teams to make informed decisions with confidence. Stay tuned for more details on the upcoming Table Styles in Sigma.
Read more about data visualization in Sigma, or start a free trial here.