Data Visualization Tools & Software
Visualizations are just the beginning, and everyone can create them.


Real-time visualizations for real-time decision making
Go directly from data warehouse to visualization
Sigma connects directly to your data warehouse, enabling users to explore real-time business data without concern for stale or inaccurate information. With as little as four clicks, you can create a chart based on any table in Sigma. Start assembling your sales dashboard, app monitor, or any number of unique use cases instantly.
Learn about the types of visualizations we support.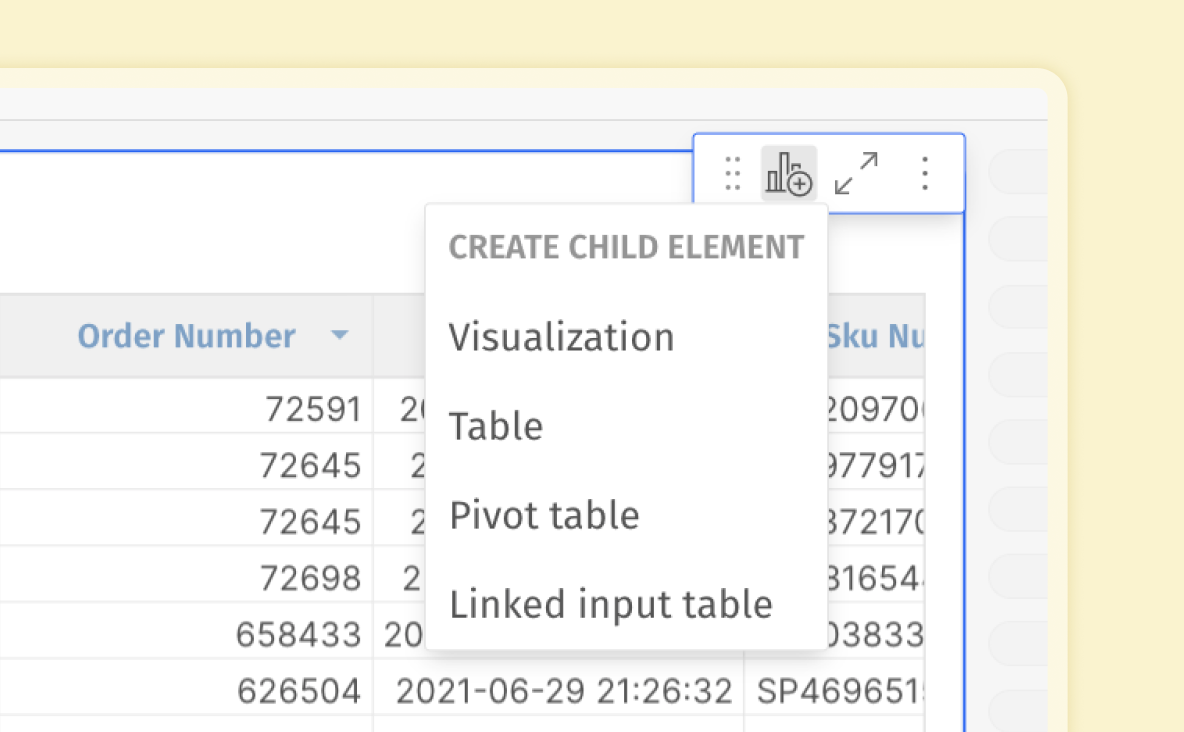
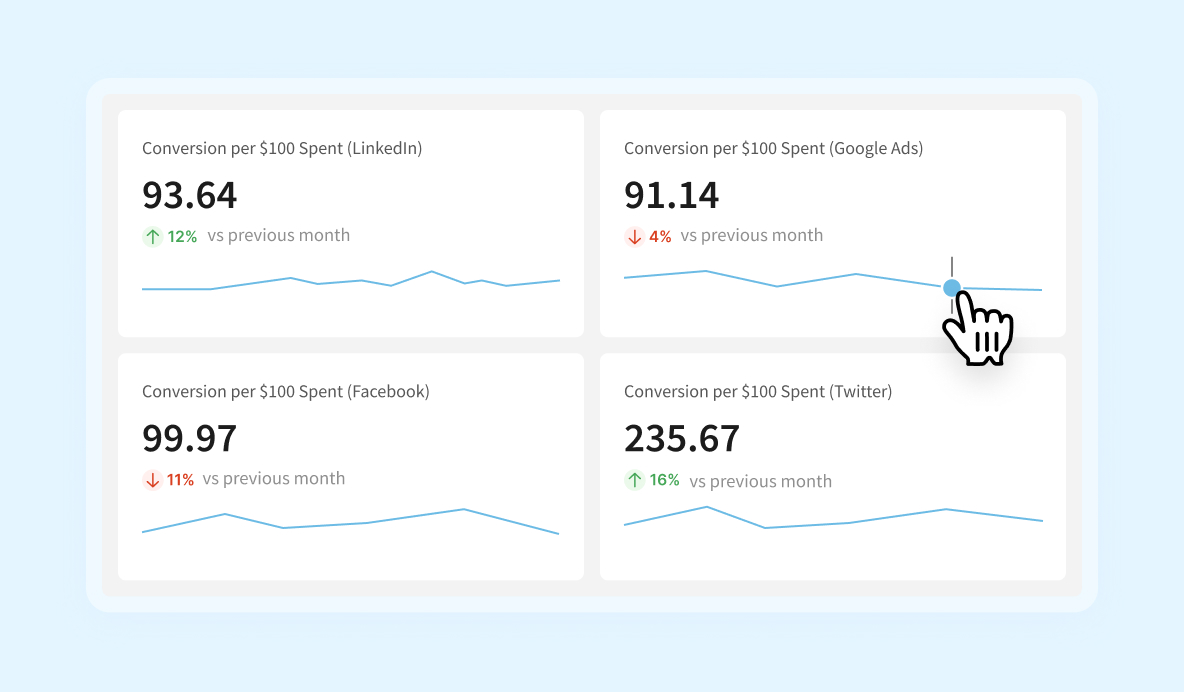
Build beautiful KPI charts, fast
Understand and follow your most important business metric, all connected directly to the underlying data that updates in real time.
Read more about our new KPI charts.Drill down on every visualization without any additional data prep
Deep dive into any chart visualization immediately after creating it without having to pre-architect anything else. Anyone exploring the visualization can right click to drill into any other field for more real-time exploration on those values.
Learn about the types of visualizations we support.

Get instant insights on any device
Access your latest data and charts from anywhere, at any time, on any device. Use Sigma’s custom mobile layout builder to create the ideal arrangement for your users to view their data with the right context.
Fully customize elements to make them your own
With over 40+ native configurations, anyone can build easily customized elements to help share the information in your warehouse with just a few clicks.

What’s Coming
We value saving time and effort without sacrificing the look and feel of your work. You don’t need to be a designer or spend countless hours configuring every little detail of a chart to make beautiful workbooks. Sigma is dedicated to continuously releasing features that make it even faster and easier to tell eye-catching data stories with our visualizations and our spreadsheet interface. Stay tuned for updates on our next upcoming features like table styling templates.
We are Sigma.
Sigma is a cloud-native analytics platform that uses a familiar spreadsheet interface to give business users instant access to explore and get insights from their cloud data warehouse. It requires no code or special training to explore billions of rows, augment with new data, or perform “what if” analysis on all data in real-time.
Sign up to get Sigma in your inbox
Stay connected as we bring speed and ease of use to the data world.
By submitting, you consent to allow Sigma Computing to store and process the personal data from this form to fulfill your request.