How to Automate Financial Reporting: A Practical Guide to Faster Closes on Live Warehouse Data

Many finance teams run the same scramble as the reporting period draws near. Someone pulls the numbers from the source systems, drops them into a spreadsheet, and the team races the clock to reconcile discrepancies, chase down missing context, and produce the same reports they produced last month.
Manual data work still consumes a large share of finance's time, but teams that have adopted AI robustly spend 20 to 30% less time crunching data. Financial reporting automation uses governed data pipelines, shared metric logic, scheduled refreshes, distribution, and human exception review to produce recurring financial reports without manual assembly.
This guide walks through how to automate financial reporting end-to-end: where to start, which steps to automate first, and how to keep the output accurate and up to date once the manual work is gone.
Key takeaways
- You need to get four things right before you automate your financial reports: reconciled source data, an agreed-upon definition for every metric, documented transformation logic, and audit controls.
- Consolidate your data into a governed warehouse layer, model every metric once in a semantic layer, build reports directly on that model, schedule refreshes around the actual close calendar, and keep a human review step for flagged exceptions before reports ship.
- The fastest path to value is one report at a time. Pick the recurring report that costs your team the most time each close, automate it end-to-end on warehouse data, run it in parallel until the numbers reconcile, then move to the next one.
Benefits of automating financial reporting
The benefits from automating financial reporting compound across the close cycle, the quality of the numbers, the controls around them, and how analysts spend their time:
- A faster, more predictable close. Automation makes the close more structured and repeatable, especially when workflows align with the closing calendar. Tasks run in sequence without waiting for someone to kick them off, and the team can plan around the close timeline.
- Faster decision making. With faster and more predictable closes come faster and more reliable decision making. Finance teams can deliver answers and recommendations at the speed the business requires.
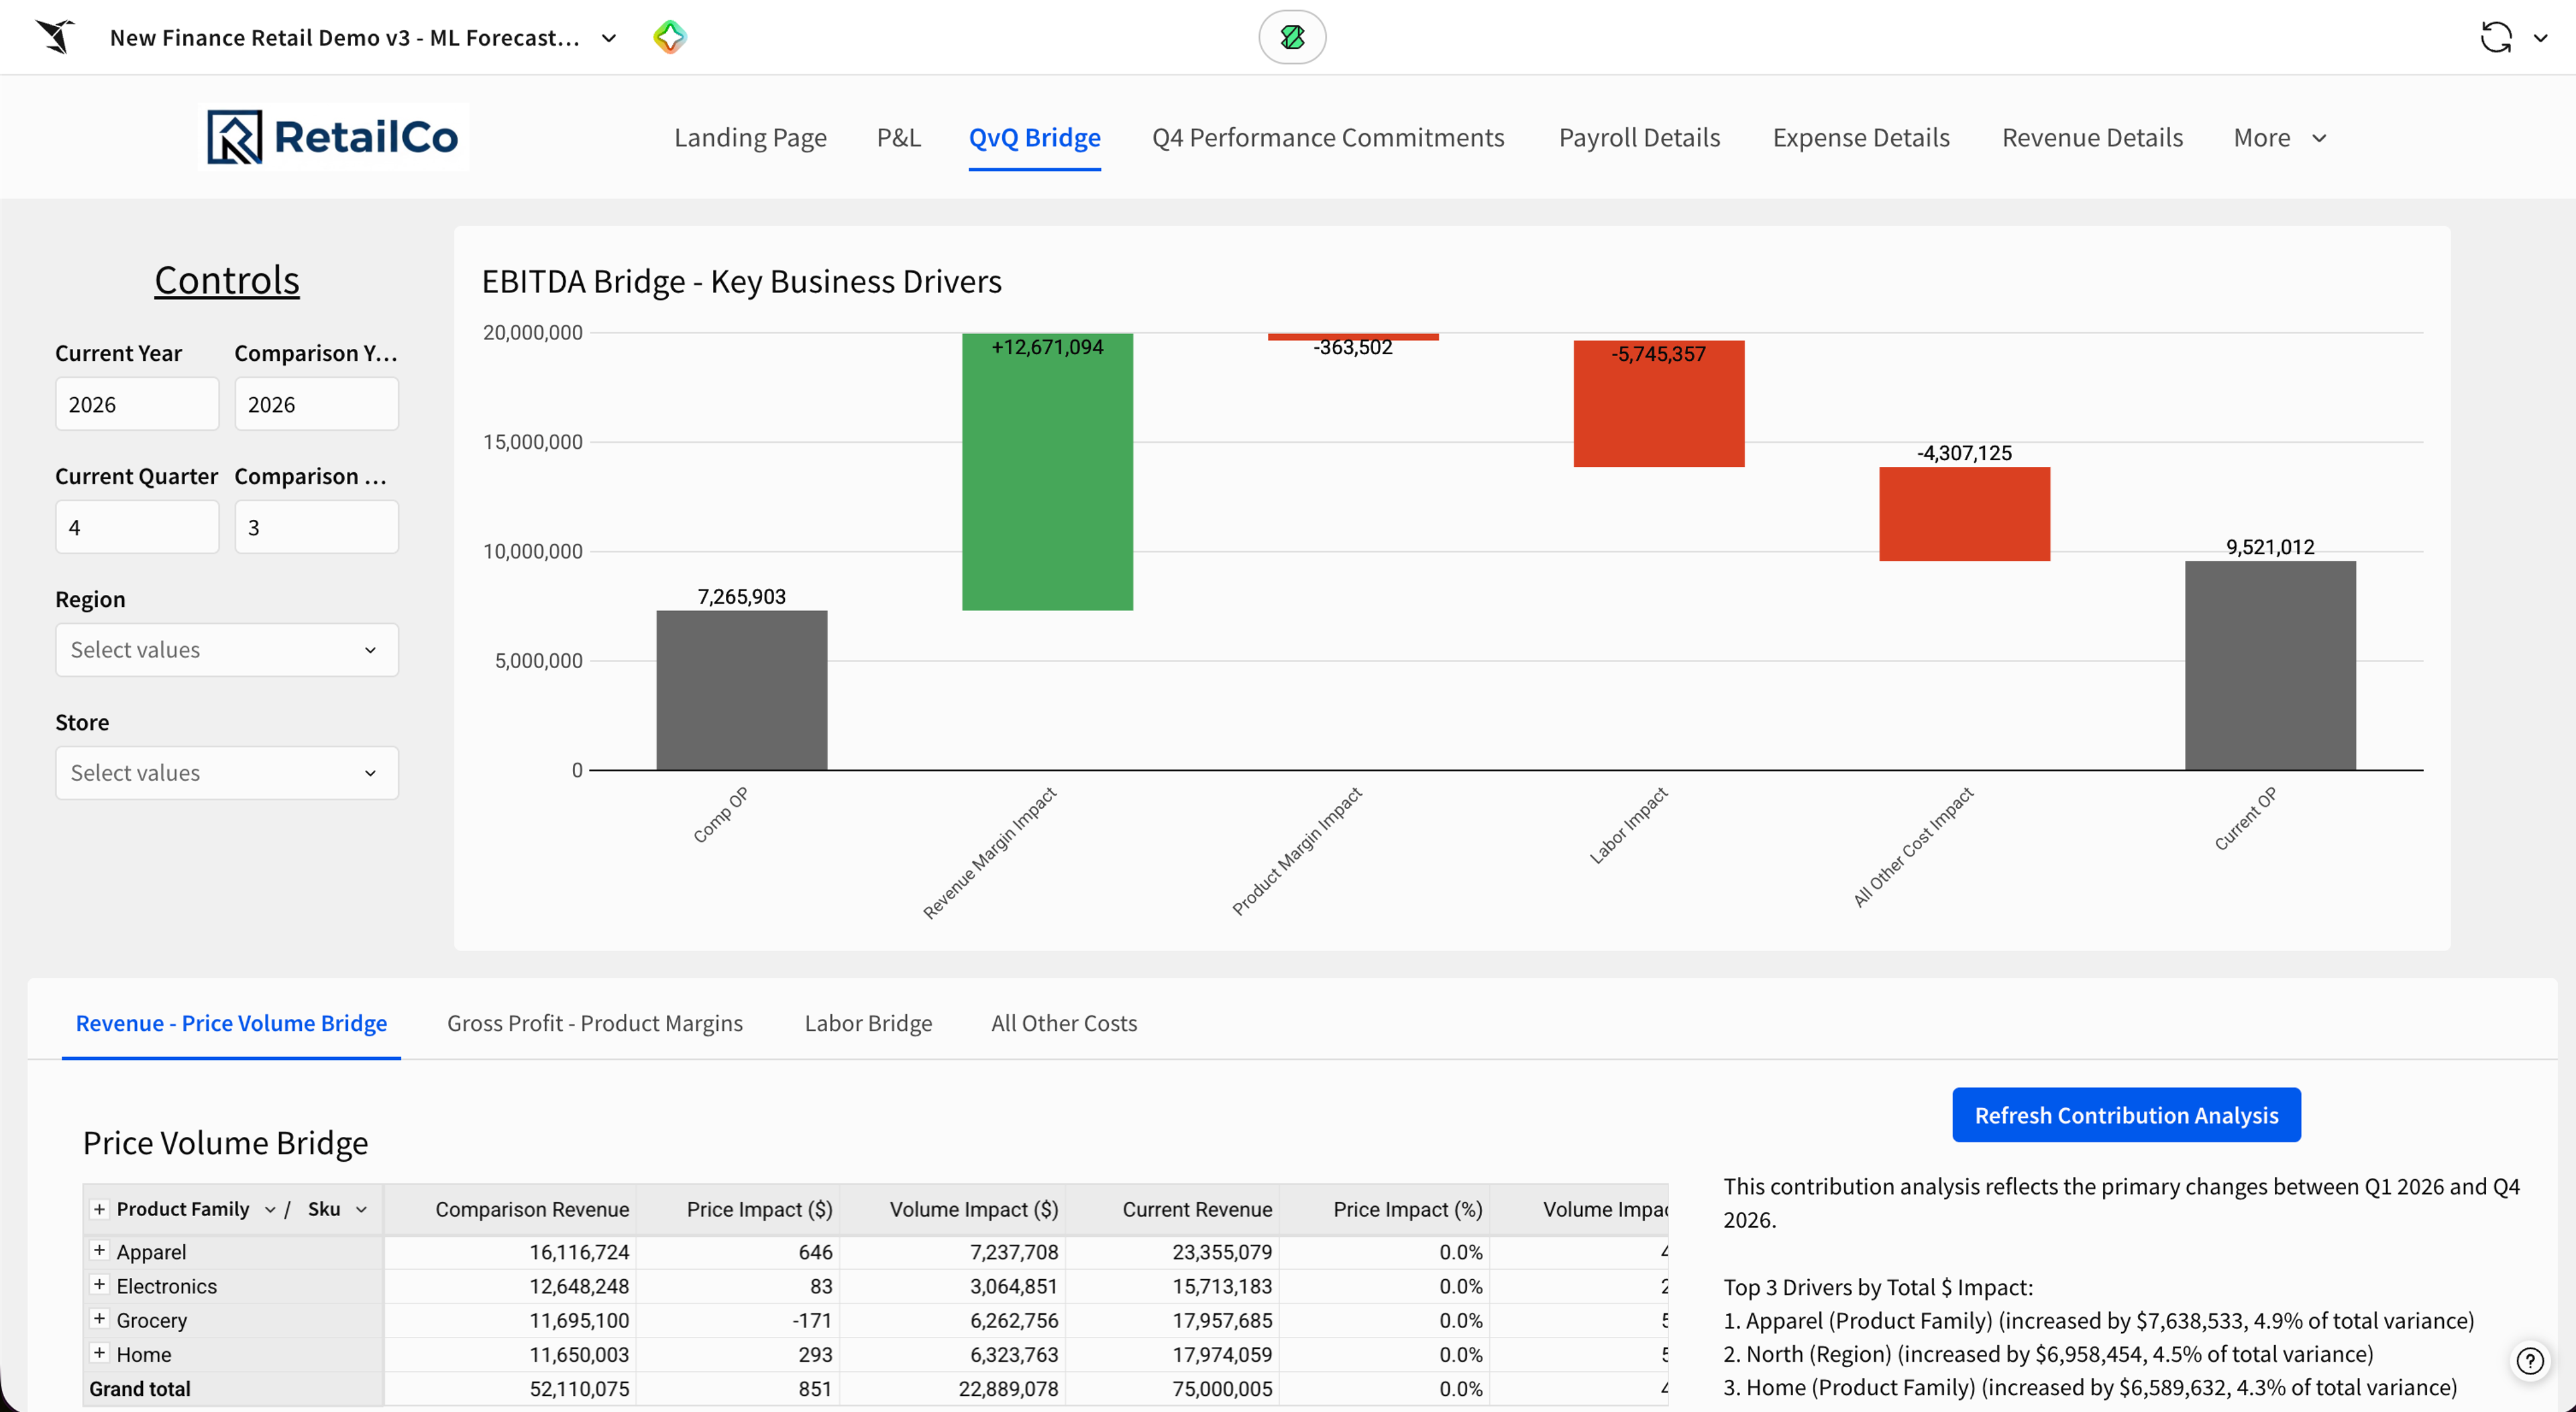
- Numbers that stay current between reporting cycles. Automated pipelines connected to live source data keep reports current as the underlying numbers change, so leadership decisions don't rest on figures that have already gone stale by the time of review.
- Analyst time redirected from assembly to analysis. 45% of FP&A time is spent on manual data cleaning and reconciliation. Automation pushes that work into the pipeline so analysts can spend more time explaining variances, modeling scenarios, and advising the business.
- Fewer manual errors and a clearer audit trail. When reports pull from a single governed layer instead of stitching together exports, copy-paste mistakes, broken formulas, and version conflicts largely disappear.
- A reporting process that scales with the business. New entities, new product lines, and new reporting requirements plug into the same governed model instead of triggering a one-off rebuild. Adding them becomes a configuration task rather than another month of spreadsheet engineering.
Together, these benefits turn financial reporting from a recurring scramble into infrastructure that the team operates rather than reassembles each period.
4 prerequisites for automating financial reporting
Before you build anything, four foundations have to be in place. These are the conditions must be met on day zero, before a single pipeline runs. Skip them, and automation will produce unreliable reports faster than the manual process it replaced.
1. Clean source data
Align your chart of accounts across legal entities, govern intercompany accounting, and document data lineage from source system to report output. A bot that extracts bank statement data and compares it against the GL only works when those systems hold a consistent structure upstream.
2. Shared metric definitions
Every metric and report needs a single agreed-upon definition before you automate it. If revenue from the CRM differs from revenue in the ERP, automated reports will surface both without flagging the conflict. A semantic layer maintains shared definitions for metrics, data contracts, and product ontologies. Define every KPI once, in one place, before you build any report.
3. A written record of how every number is produced
Every figure in an automated report needs a written explanation of how it was produced. Capture the source tables, the transformation rules, the business logic, and the exception-handling rules at design time, before the pipeline runs in production. This explanation is assurance by design, where controls and assurance activities are built into the transformation work rather than bolted on after deployment. If your auditor can't trace a number from the report back to its source on the day automation goes live, the reporting process loses its auditability before the first close runs.
4. Role-based access tied to the warehouse
Configure role-based access at the data classification level before the system goes live, and tie those permissions back to the roles already defined in your warehouse so finance doesn't maintain a parallel access model. Decide upfront who can view, edit, and approve each report, and turn on immutable audit logs from the first run rather than retrofitting them later. Compliance architecture is much harder to add after automation is producing reports than to configure before it starts.
How to automate financial reporting step by step
Building automated financial reporting follows a clear sequence: consolidate the data, model the logic, build the reports, orchestrate the refresh, and keep humans in the loop on review. Each step compounds on the one before it, and skipping ahead is the most common reason automation projects produce reports that still need manual cleanup.
Step 1: Consolidate your data sources into one governed layer
Everything downstream depends on a single, trusted copy of the data. Implement ELT pipelines that move data from your ERPs, billing systems, and external feeds into your cloud data warehouse, with automated error and duplicate detection at ingestion.
Separate raw, staged, and curated layers so analysts always know which version they're reading, and design pipelines to be robust, ensuring that reruns produce the same result. Resolve data quality issues at ingestion, before they propagate into models and reports where they'll be harder to find.
Step 2: Model your metrics and reporting logic once
Every shared metric should have exactly one definition that the system enforces. Define revenue, margin, and every KPI in a semantic layer with version control, so a change made for one report doesn't silently shift the numbers in another. Spell out the distinctions that trip teams up at close: booked vs. billed vs. recognized revenue, gross vs. net, constant-currency vs. reported. Organizations that skip to AI or reporting without this governed baseline produce outputs that need more review than the manual process they replaced.
Step 3: Build the reports and statements on that model
Connect reports directly to the governed data layer rather than relying on spreadsheet exports or manual refreshes.
Embed intercompany eliminations, consolidation, and FX translation into the report structure so those calculations don't become a post-processing step each period. Build statement templates (P&L, balance sheet, cash flow) parameterized by entity and period, so the same template rolls forward each period and scales across the business without a rebuild.
Step 4: Schedule the refresh and the distribution
Refresh on the rhythm of your actual close, not an arbitrary cron schedule. Configure your orchestration layer to trigger on real events, such as the subledger close flag flipping, rather than running at a fixed time against incomplete data.
Automate distribution to defined stakeholder groups on defined schedules, route failures to an owner instead of a shared inbox, and maintain an audit trail of what went out, to whom, and when, to support governance and compliance.
Step 5: Keep a human review step before anything ships
Automation shifts the analyst's role from collating numbers to exercising judgment on them. Build anomaly detection that generates a review queue based on variance thresholds, account-level outliers, unusual journal entries, and repeated rejections. Route those exceptions to named reviewers with a clear sign-off workflow, and feed their resolutions back into the rules so the queue gets sharper each period.
Best practices when automating financial reporting
The prerequisites get automation off the ground. These practices keep it trustworthy once it's running. They are the operating habits that prevent a system that worked at launch from drifting period by period until the numbers can no longer be trusted.
1. Treat the closing calendar as your orchestration source of truth
The closing calendar should govern the entire orchestration layer, beyond triggering refreshes for real close events. It should link workflow design, defined tasks, roles, inputs and outputs, dependency management, status tracking, and internal controls.
When the calendar is the system of record, refreshes wait for complete data rather than running mid-period and shipping reports with no visible error signal.
2. Build reconciliation and validation checks into every run
Catch problems in the pipeline, not in the review meeting. Embed automated reconciliation controls within the reporting pipeline itself, and for reports that depend on subledger data, include subledger-to-GL reconciliation before distribution. A control that runs before the report ships provides reviewers with a reconciled artifact to evaluate, so the exception queue stays focused on real anomalies rather than data integrity issues.
3. Version your logic so changes don't silently break a report
Treat reporting formulas, data mappings, and configurations as code, with formal change management, version control, and peer review behind every edit. A common failure mode: a new operator changes the attributes or precision of a control so subtly that it no longer addresses the risk it was designed for, and no one notices until an audit. Housing analytics routines in controlled environments with access protections preserve the evidence of every period during which the changed logic operated.
4. Don't automate an unrevised process
Automating a broken process just produces broken outputs faster. Mature automation organizations are three times more likely to reimagine processes end-to-end than to automate as-is. Carve out time to fix the workflow before encoding it in pipelines.
5. Avoid having a single point of failure
Reporting automation becomes a black box when its logic, runbooks, and operating procedures reside with the analyst who built it. Define accountability between data teams and finance operations, document the governance, and store it where the next person can find it. The test is simple: if the person who built it took a month off, would the next close still run?
How Sigma automates financial reporting on your warehouse data
Sigma is the runtime layer for building and scaling analytics, apps, and agents on live cloud data warehouse data. It sits between the warehouse and AI, so every workbook, report, and agent your team builds becomes governed software that inherits your existing warehouse security, permissions, and audit trail.
For finance teams working with governed warehouse data, Sigma supports reporting, analysis, writeback, review, distribution, and audit in a single platform IT can trust.
Query the warehouse directly on every refresh
Sigma's cloud native architecture ensures:
- Data is always live from the single source of truth
- Data is accessible at unlimited scale
This means finance teams can start from a top-level view and drill down to the transaction level on billions of records—in seconds.
In more detail, Sigma keeps reports current by running every query live against the warehouse instead of a copy. Every formula, filter, pivot, and sort compiles to SQL and executes inside your cloud data warehouse, with no in-memory engine, no extracts, and no snapshotting. Each refresh hits the warehouse directly, so finance teams work with current data, and the row-count ceilings that stall Excel and legacy BI disappear.
Build reporting logic in a spreadsheet that finance already uses
Sigma puts the modeling and report-building work in the hands of the people closest to the numbers. The interface uses the same formulas, pivot tables, and cell references your finance team already works with, and it ships with 200+ calculation functions and live multi-user collaboration.
SQL and Python remain available to analysts who want them, and the default path lets any Excel user define metrics and build reports on top of them without queuing requests to data engineering.
Capture adjustments and inputs inside the same workbook
Sigma closes the loop between reporting and data entry by writing back to the warehouse directly from within the report. Input Tables let finance teams capture journal adjustments, accruals, forecast inputs, and scenario assumptions directly in the workbook, with INSERT, UPDATE, and DELETE operations running against warehouse tables.
Sigma also logs every change in a record-level audit trail with the original value, the new value, who made the change, and when.
Orchestrates refreshes, distribution, and exception review
Sigma can support configurable exception-review workflows alongside scheduled refreshes and governed distribution, all on the same canvas where your team built the report.
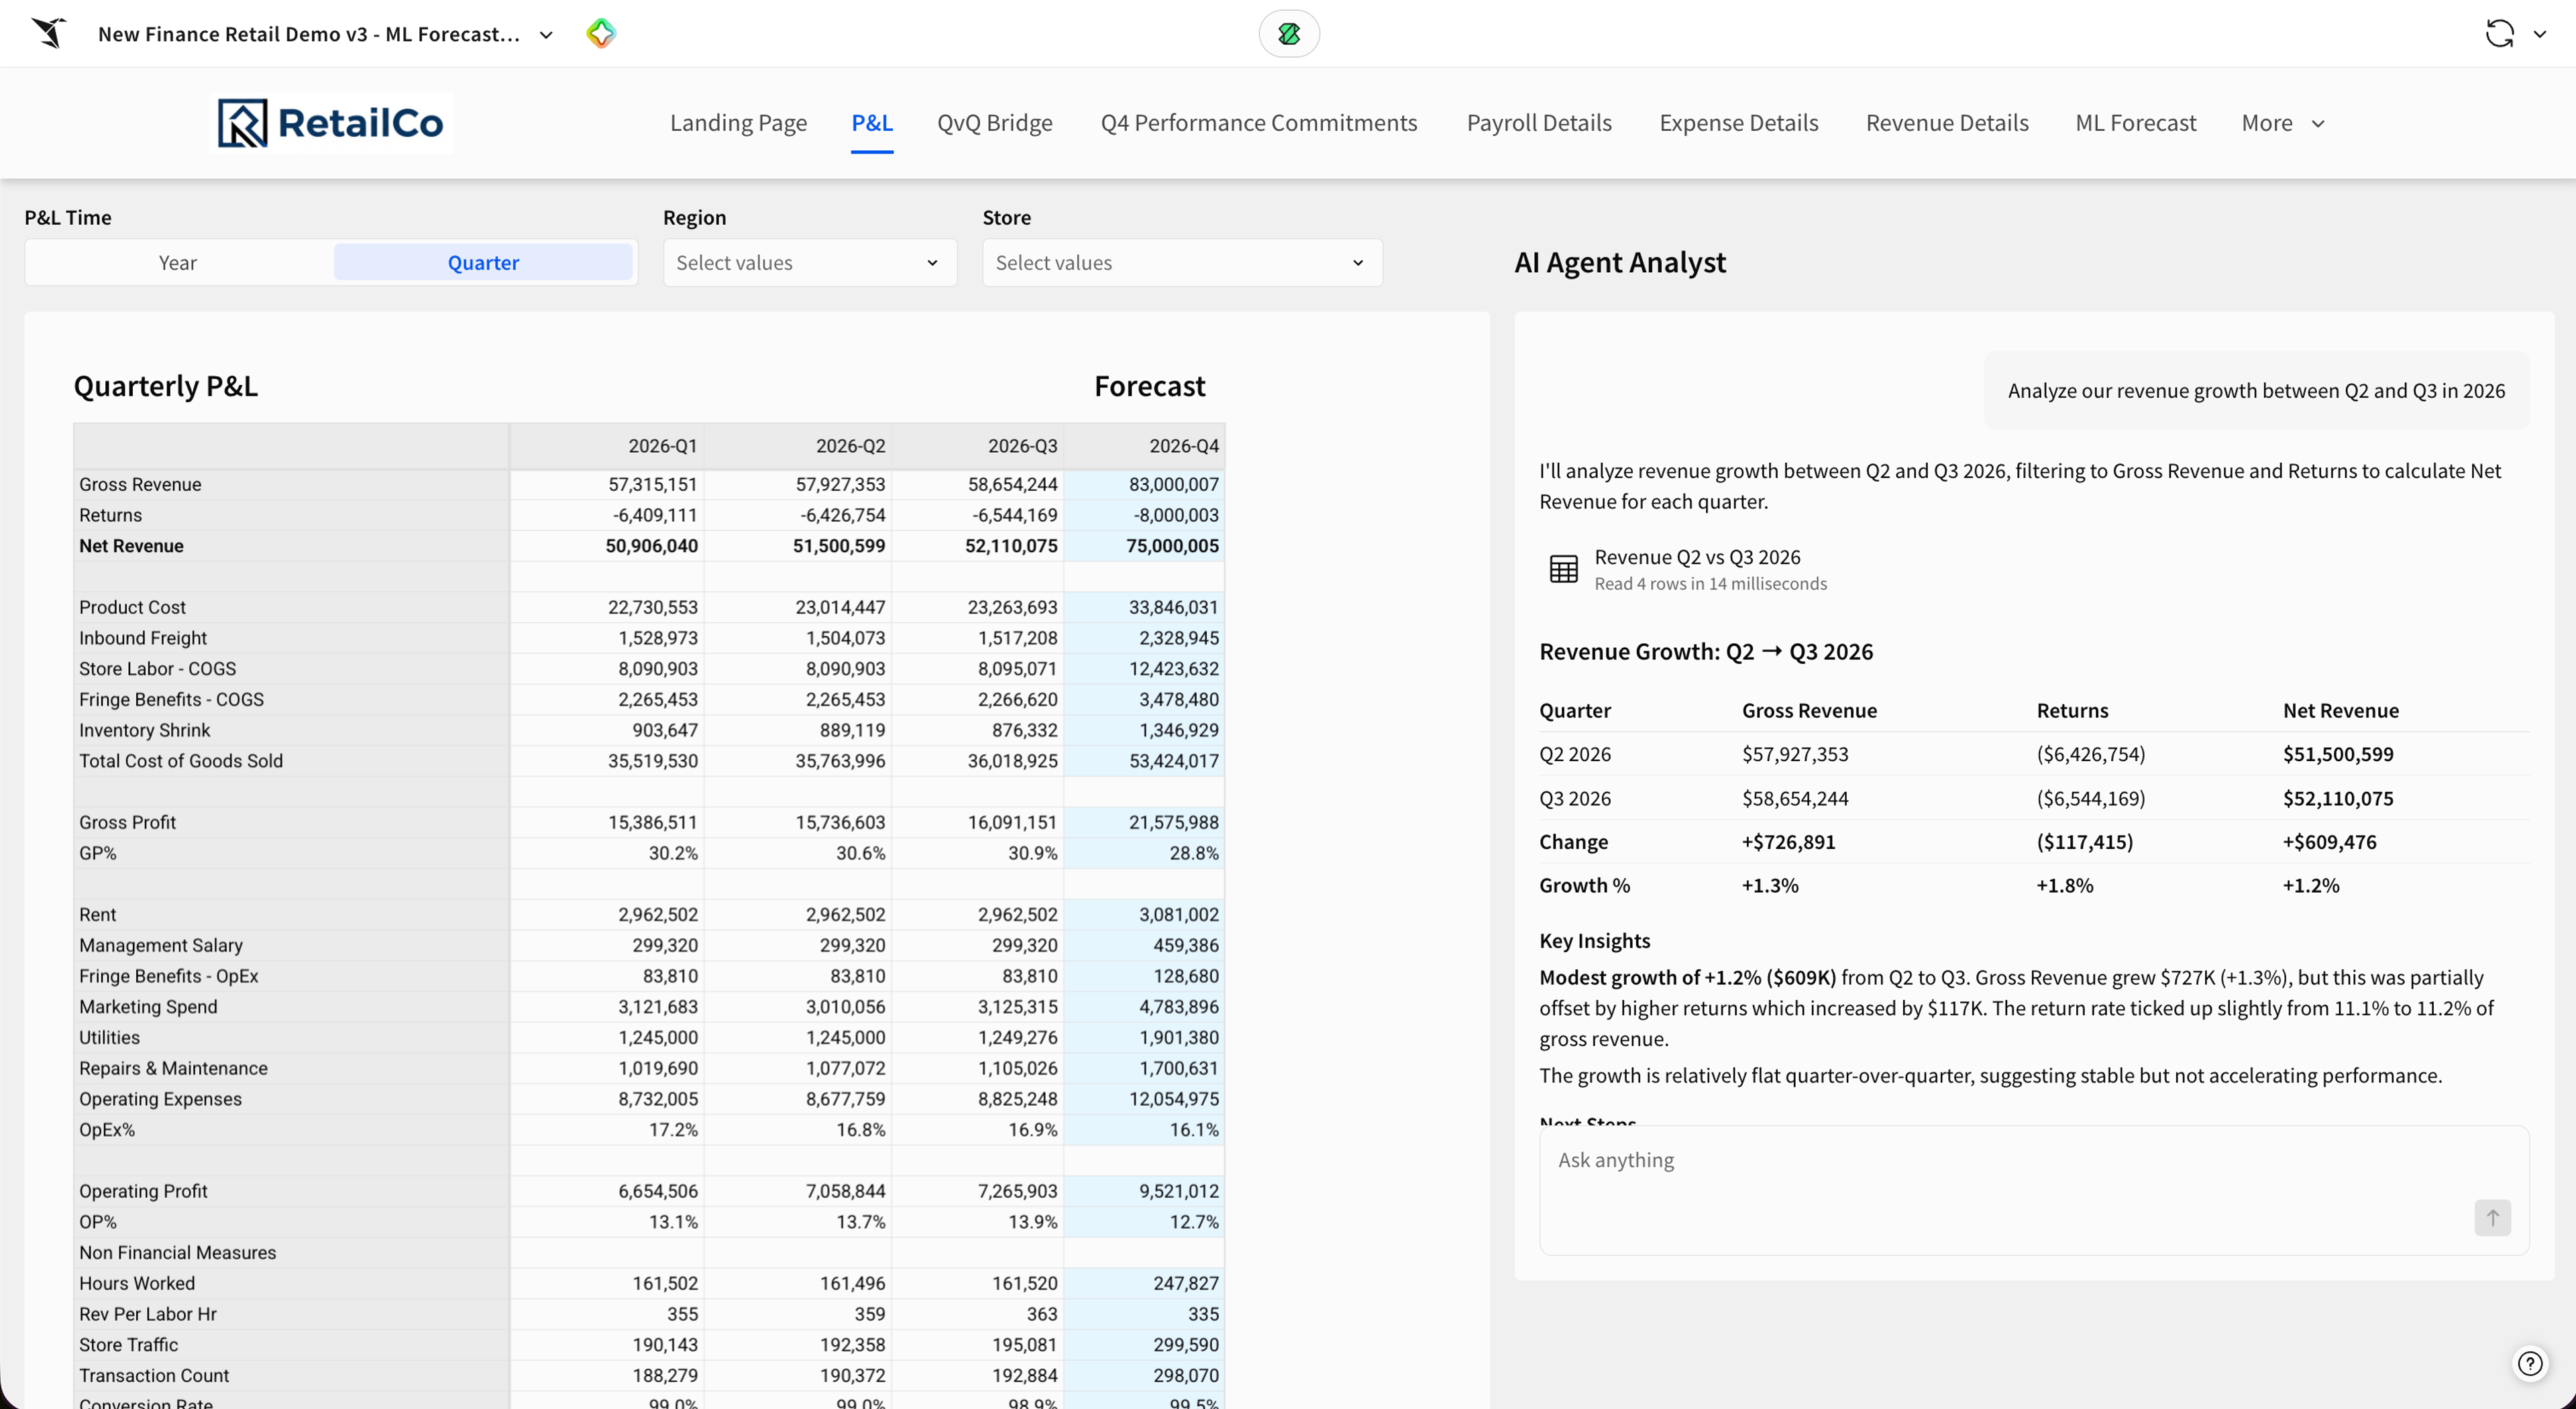
Sigma Assistant lets reviewers ask questions of the data in plain language and trace every answer back to the underlying query and table, thereby compressing variance explanation and anomaly review into the same workspace as the report.
Sigma Agents can bring customized agentic workflows to a specific workbook, scoped to defined data access and configured actions like writeback, notifications, and approval routing. Both run on your warehouse compute (such as Snowflake Cortex or Databricks) and inherit the row-level security of whoever called them.
Sigma's report builder interface produces pixel-perfect, paginated documents on a canvas you control down to the pixel—headers, footers, logos, and page breaks included. Because the report queries the warehouse directly, every export reflects current numbers under the same governance as the rest of your workflow.
Inherit warehouse governance to make reports auditable
Sigma carries your existing compliance architecture through to every automated report without maintaining a parallel permissions system. Row-level security and column masking carry over from the warehouse; role-based access can use roles defined in the underlying data warehouse; and you can replay any run or restore any prior version.
Getting started with automated financial reporting
Start with one recurring report instead of rebuilding your entire reporting stack at once. Pick the report that costs your team the most time each close, such as the revenue reconciliation, the consolidation package, or the board deck. Automate that single report end-to-end on your warehouse data, and let the result make the case for the next one.
If you're not already on Sigma, that first report is also a low-risk way to evaluate whether a warehouse-native platform fits your stack. Sigma connects to the cloud data warehouse you already run (Snowflake, Databricks, BigQuery, or Amazon Redshift) and inherits the governance you've already configured.
Get a demo or try Sigma free to run your first automated financial report on live warehouse data.