Why Finance Teams Are Moving Their 3 Most Critical Workflows Out Of Spreadsheets
Every finance leader I talk to says the same thing: they want their team spending 80% of their time on strategy, accountability, and decisions, and maybe 10 or 20% pulling reports together. But most will also tell you that it’s the opposite in practice. Finance teams spend the vast majority of their time just meeting the minimum reporting requirements.
The reality is that this isn’t a people problem, but a tools problem. Budget variance, revenue forecasting, and headcount planning are the three workflows where finance spends most of that time — and what they have in common is that they’re all database problems being solved in a tool that was never meant to be a database. Excel was built to visualize and calculate, not to store and slice millions of rows across every dimension the business throws at it.
I’ve spent years on the finance side of these exact problems. So, I built an app in Sigma for each one, to get finance teams off the spreadsheet and enable them to use their time for the business instead of the reporting. Here’s how they work.
The real problem isn’t the data, but where it lives
Whenever I ask finance leaders why their tools fail them, the answer is almost always the same. They aren’t flexible enough. Businesses are always changing, and the tools can’t keep up.
Think about what that actually means in practice. One year you’re a single sales team. Then you expand into the UK, then Australia. Then you add a growth enterprise segment you didn’t have before. Each one of those changes requires you to recalculate your financial metrics across new dimensions, and if you’re using a dedicated planning tool, a standard implementation takes 4 to 8 months on average. If you’re making organizational changes every 3 months, you’re already behind before the last one is done.
So, teams default to spreadsheets. But this creates a different set of problems like version control, security, no ability to get down to the transaction detail, and a real risk of fat-fingering something critical. Excel is supposed to be a visualization and ad hoc calculation tool, but it’s not a database. When you get into something like headcount reporting and you want to see data in 5 different arrangements — by financial accounts, by department, by hiring manager, by impact this year vs. next year — what you really need is a database. In Excel, that’s a nightmare.
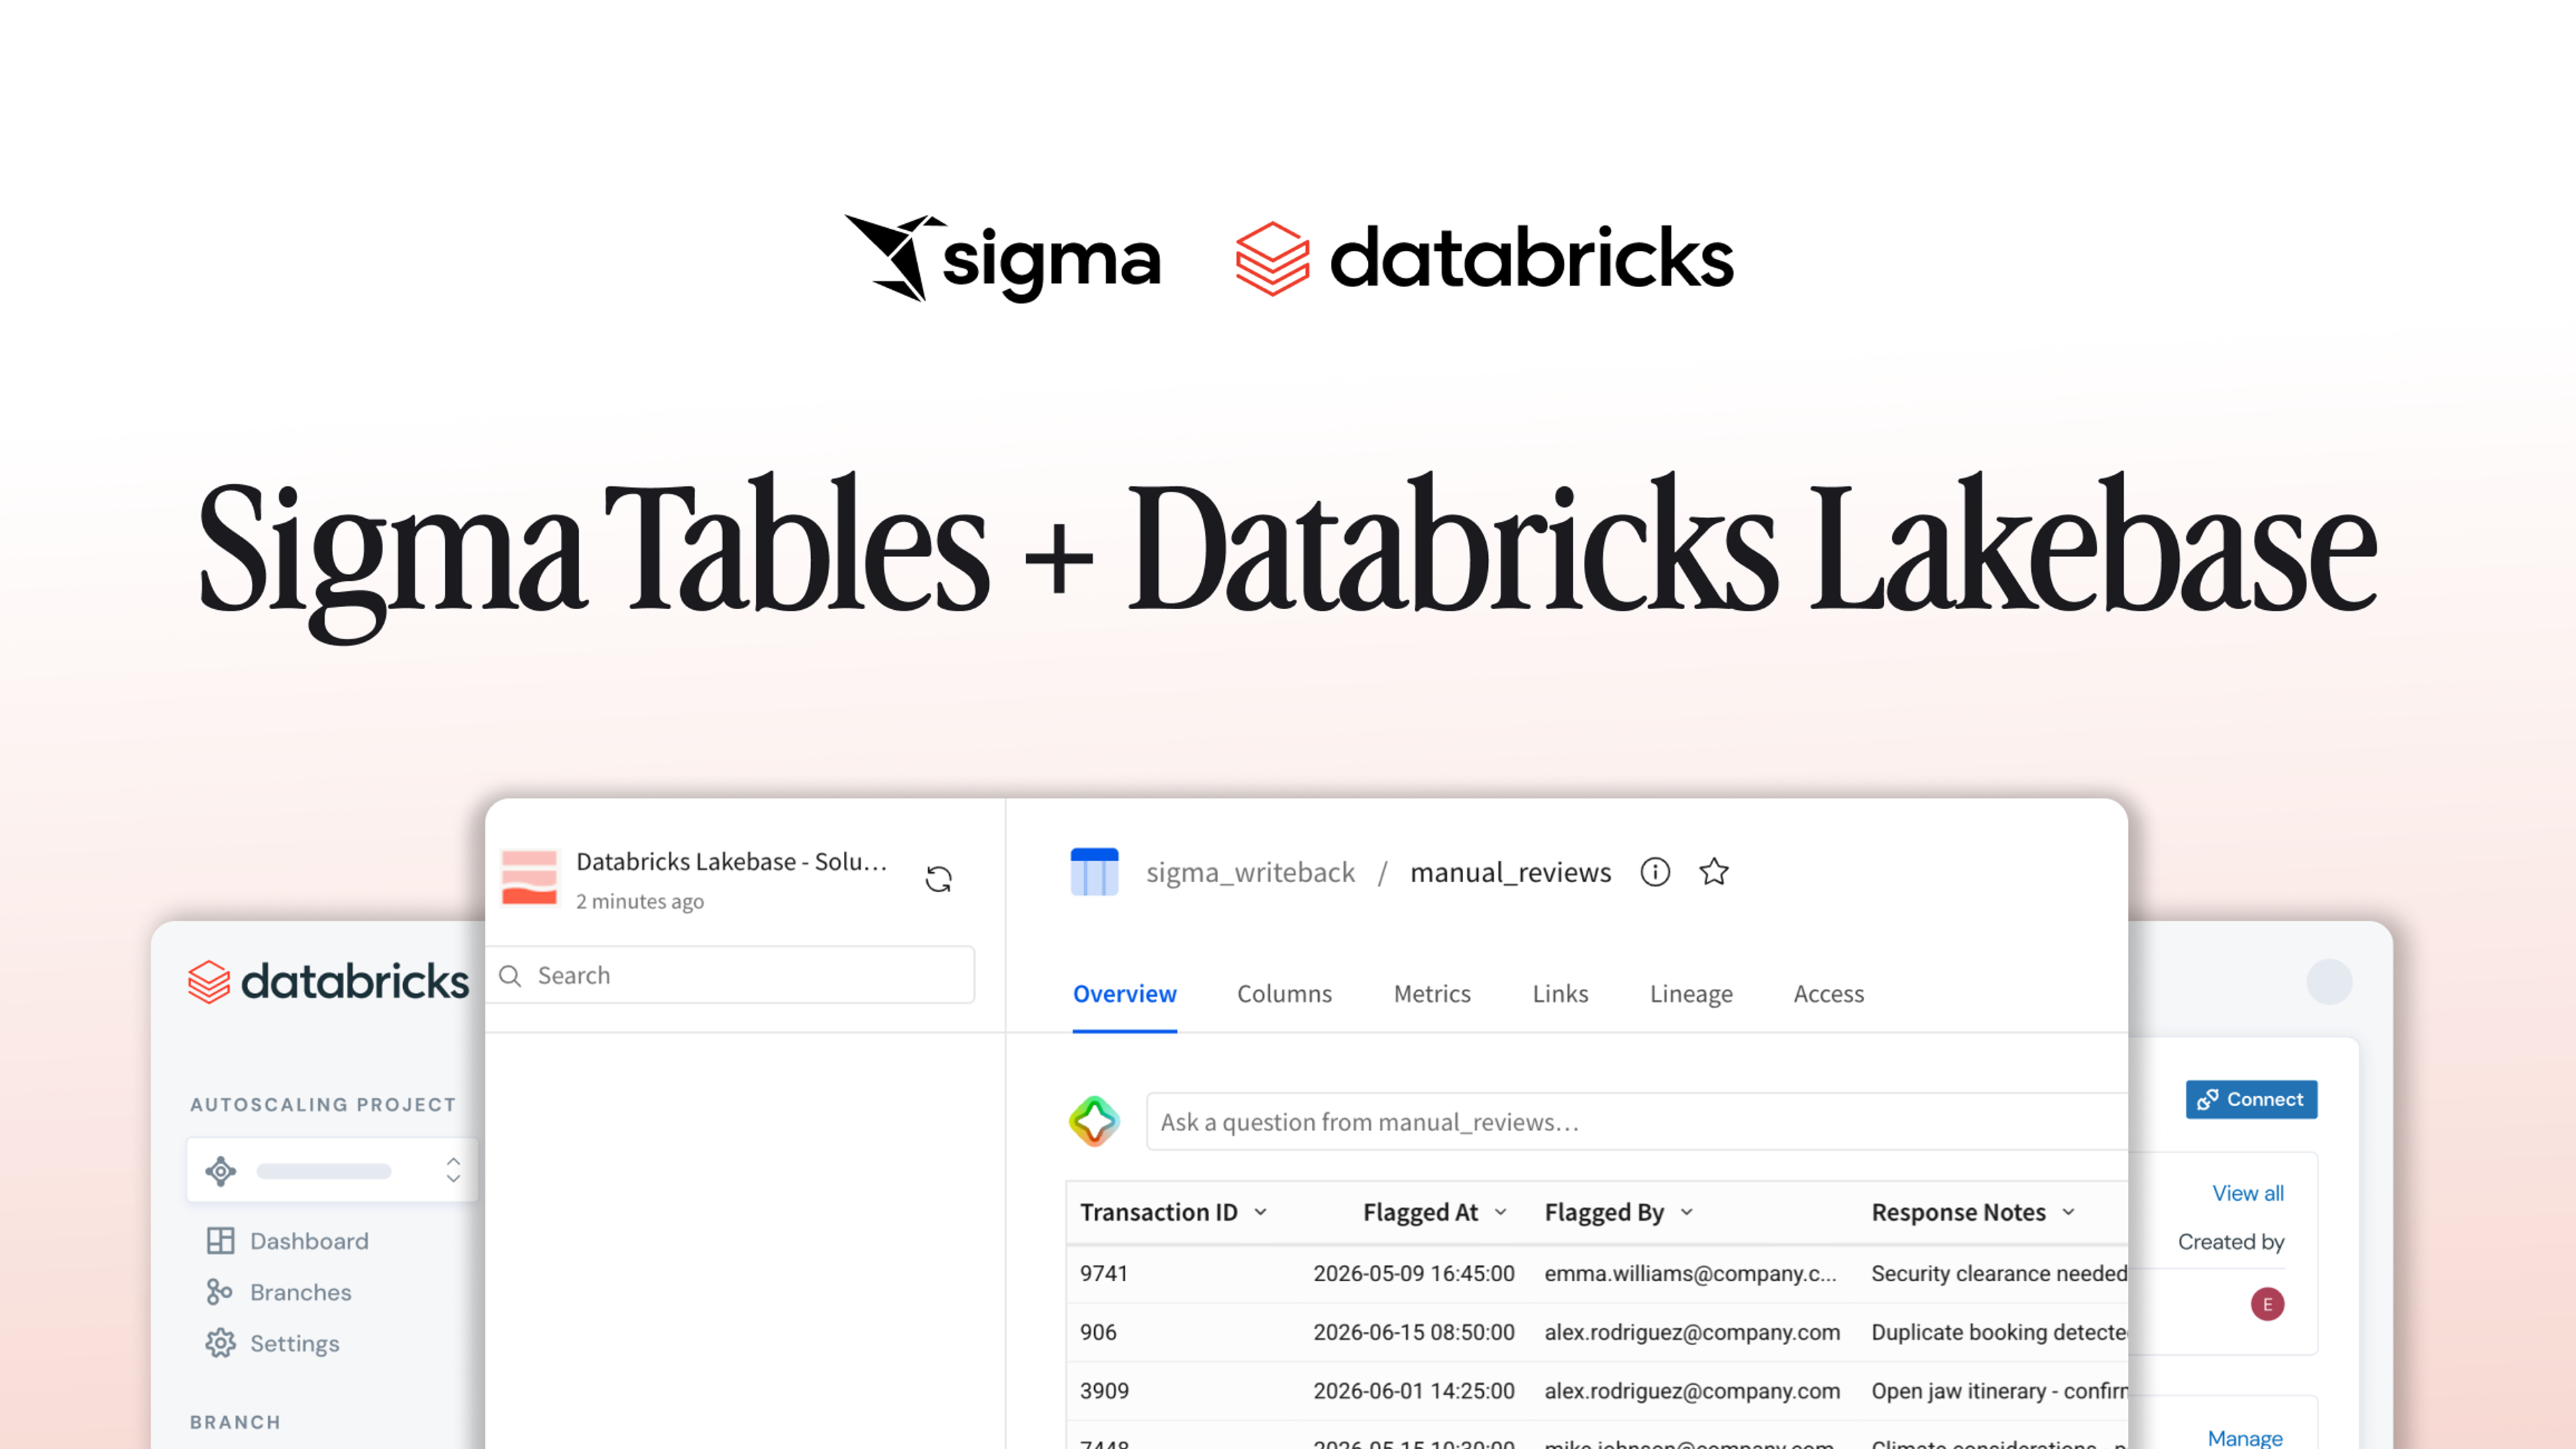
What makes that so frustrating is that most finance teams already pay for the world’s best database. They’ve already got Snowflake or Databricks set up, which are governed running at whatever scale they need, yet they’re still doing their most important financial work somewhere else entirely. It’s like having a state-of-the-art lawnmower sitting in the garage while you’re out front with an old hand mower and a metal blade. The infrastructure is right there. It’s just not being used for the thing it’s best at.
That’s what Sigma changes. It has the complex calculation power of a planning tool, all your data is available at full scale, and it works like an Excel model, so updating it feels familiar, not like reconfiguring software.
Budget variance tracking: from 20 spreadsheets to one central source of truth
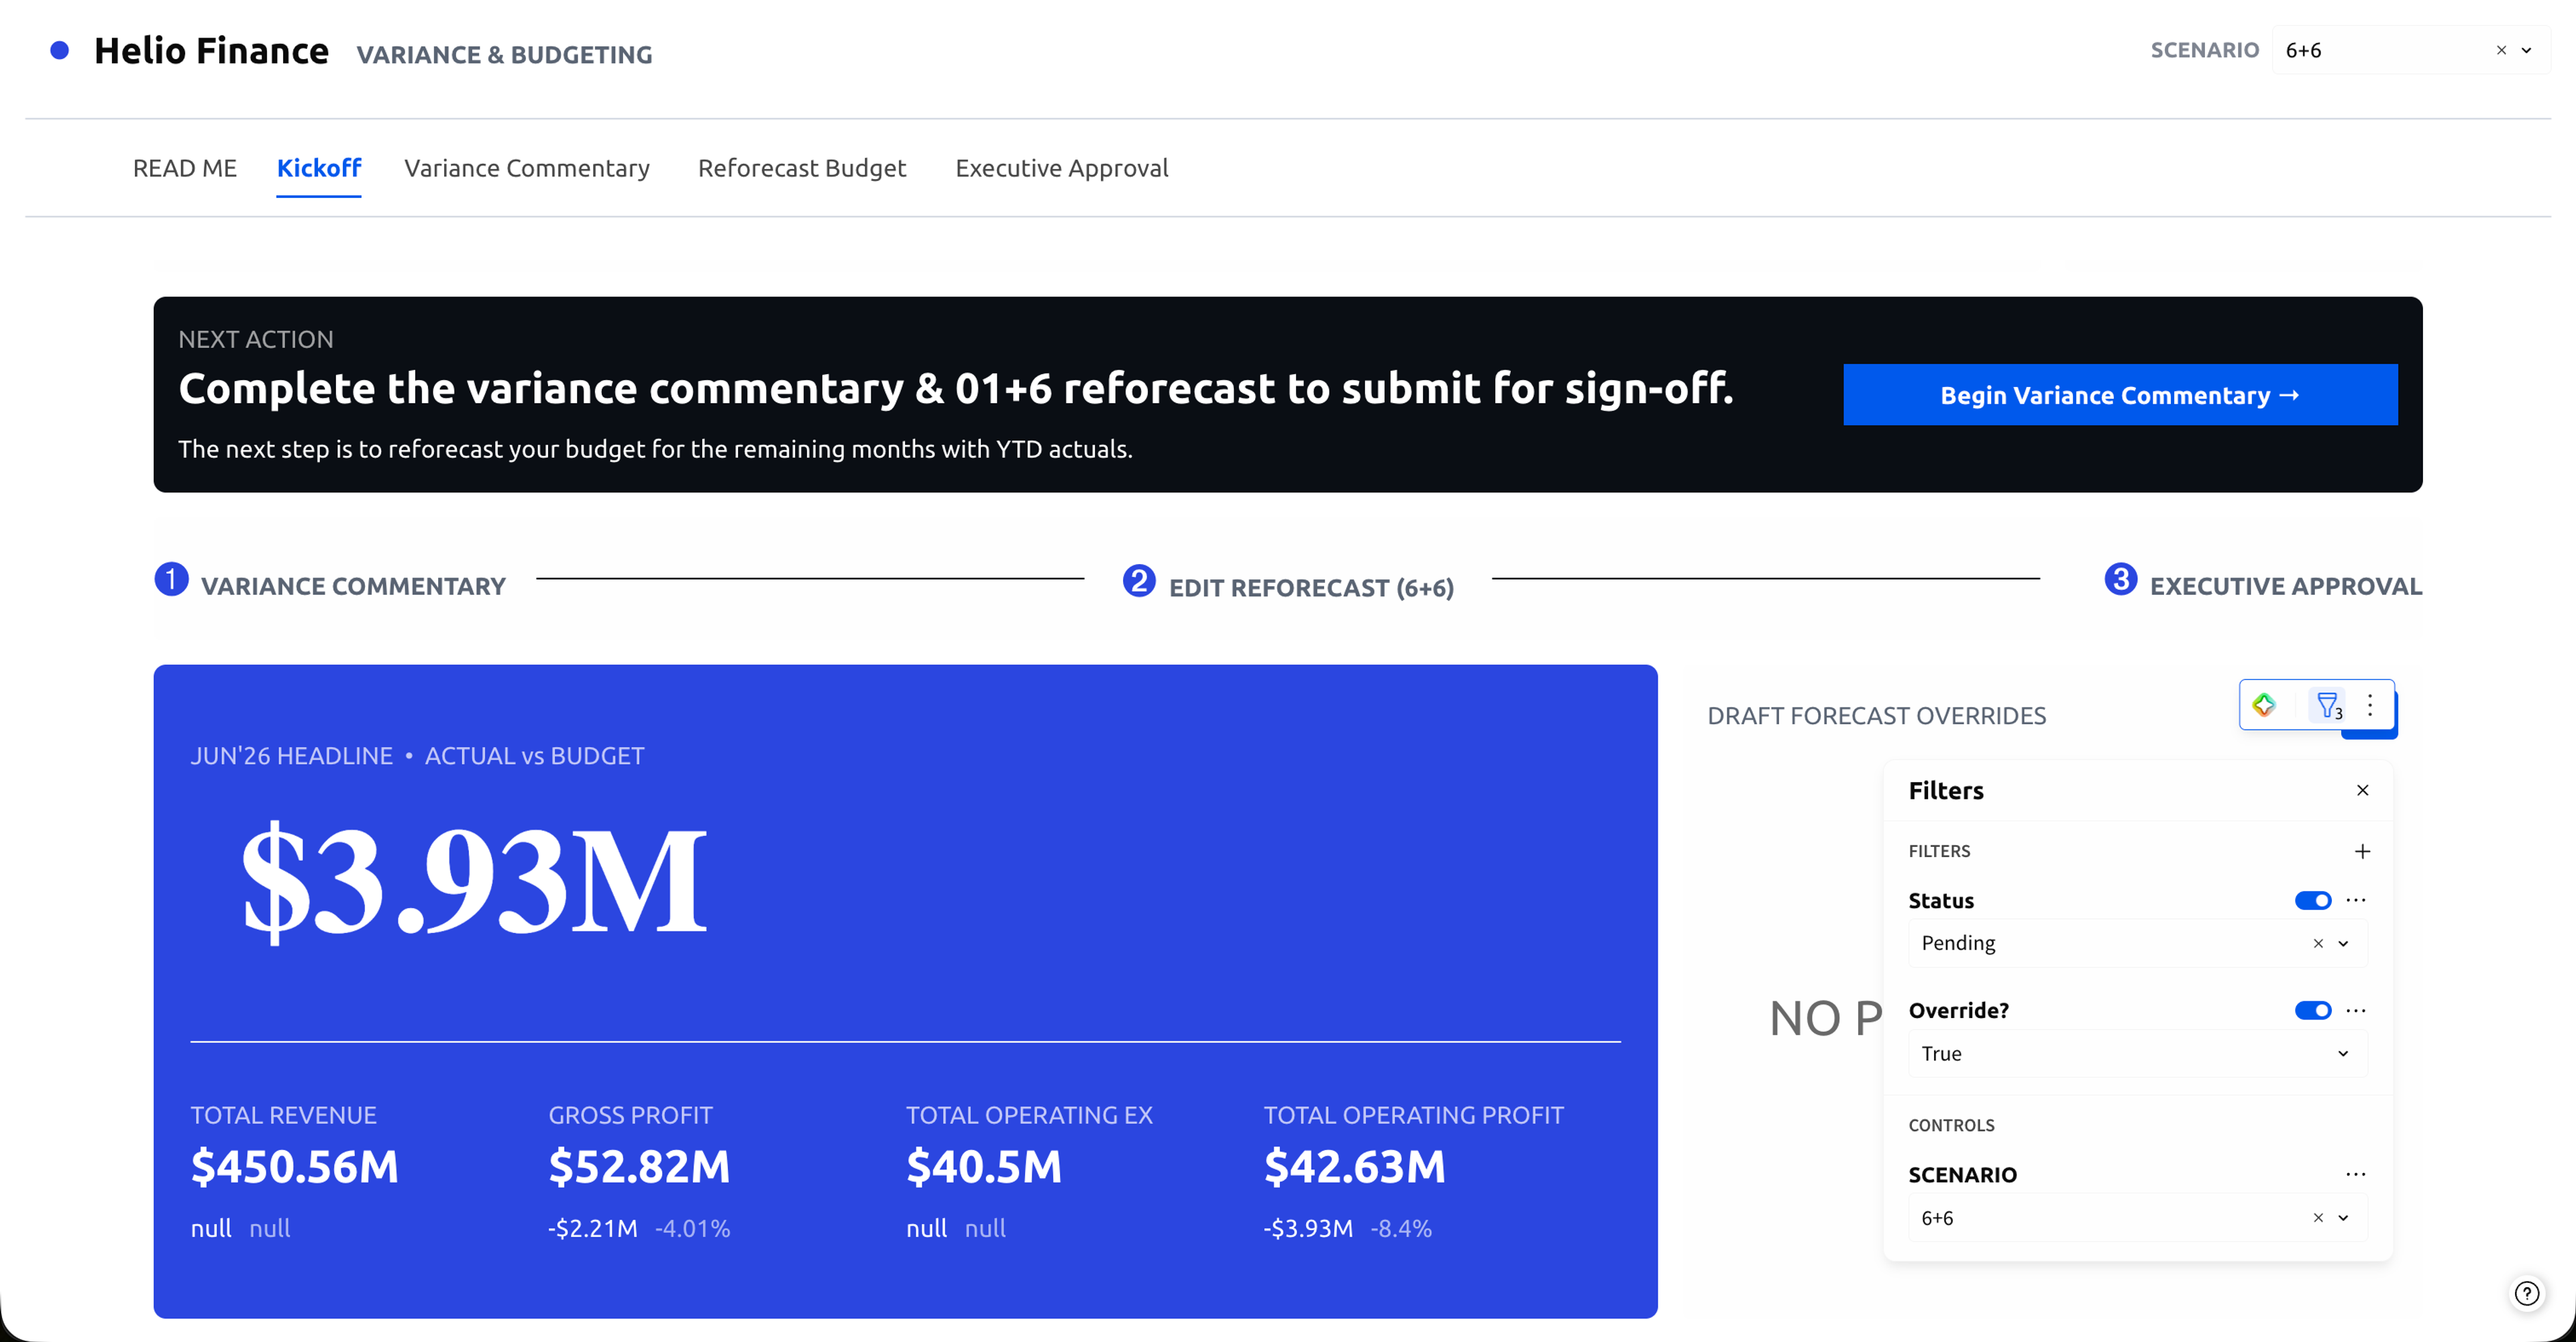
At most companies, budget variance tracking lives entirely in spreadsheets. Say you’re a plant manager: you have a team of analysts producing one spreadsheet per department. With around 20 departments, that’s 20 spreadsheets to open, comb through, reconcile, and summarize up to the regional controller, who has 10 plant managers reporting in. All of it ultimately feeds the high-level story the CEO and CFO need for an earnings call. The data exists; the problem is that it’s scattered across 20 disconnected files, and none of them are drillable.
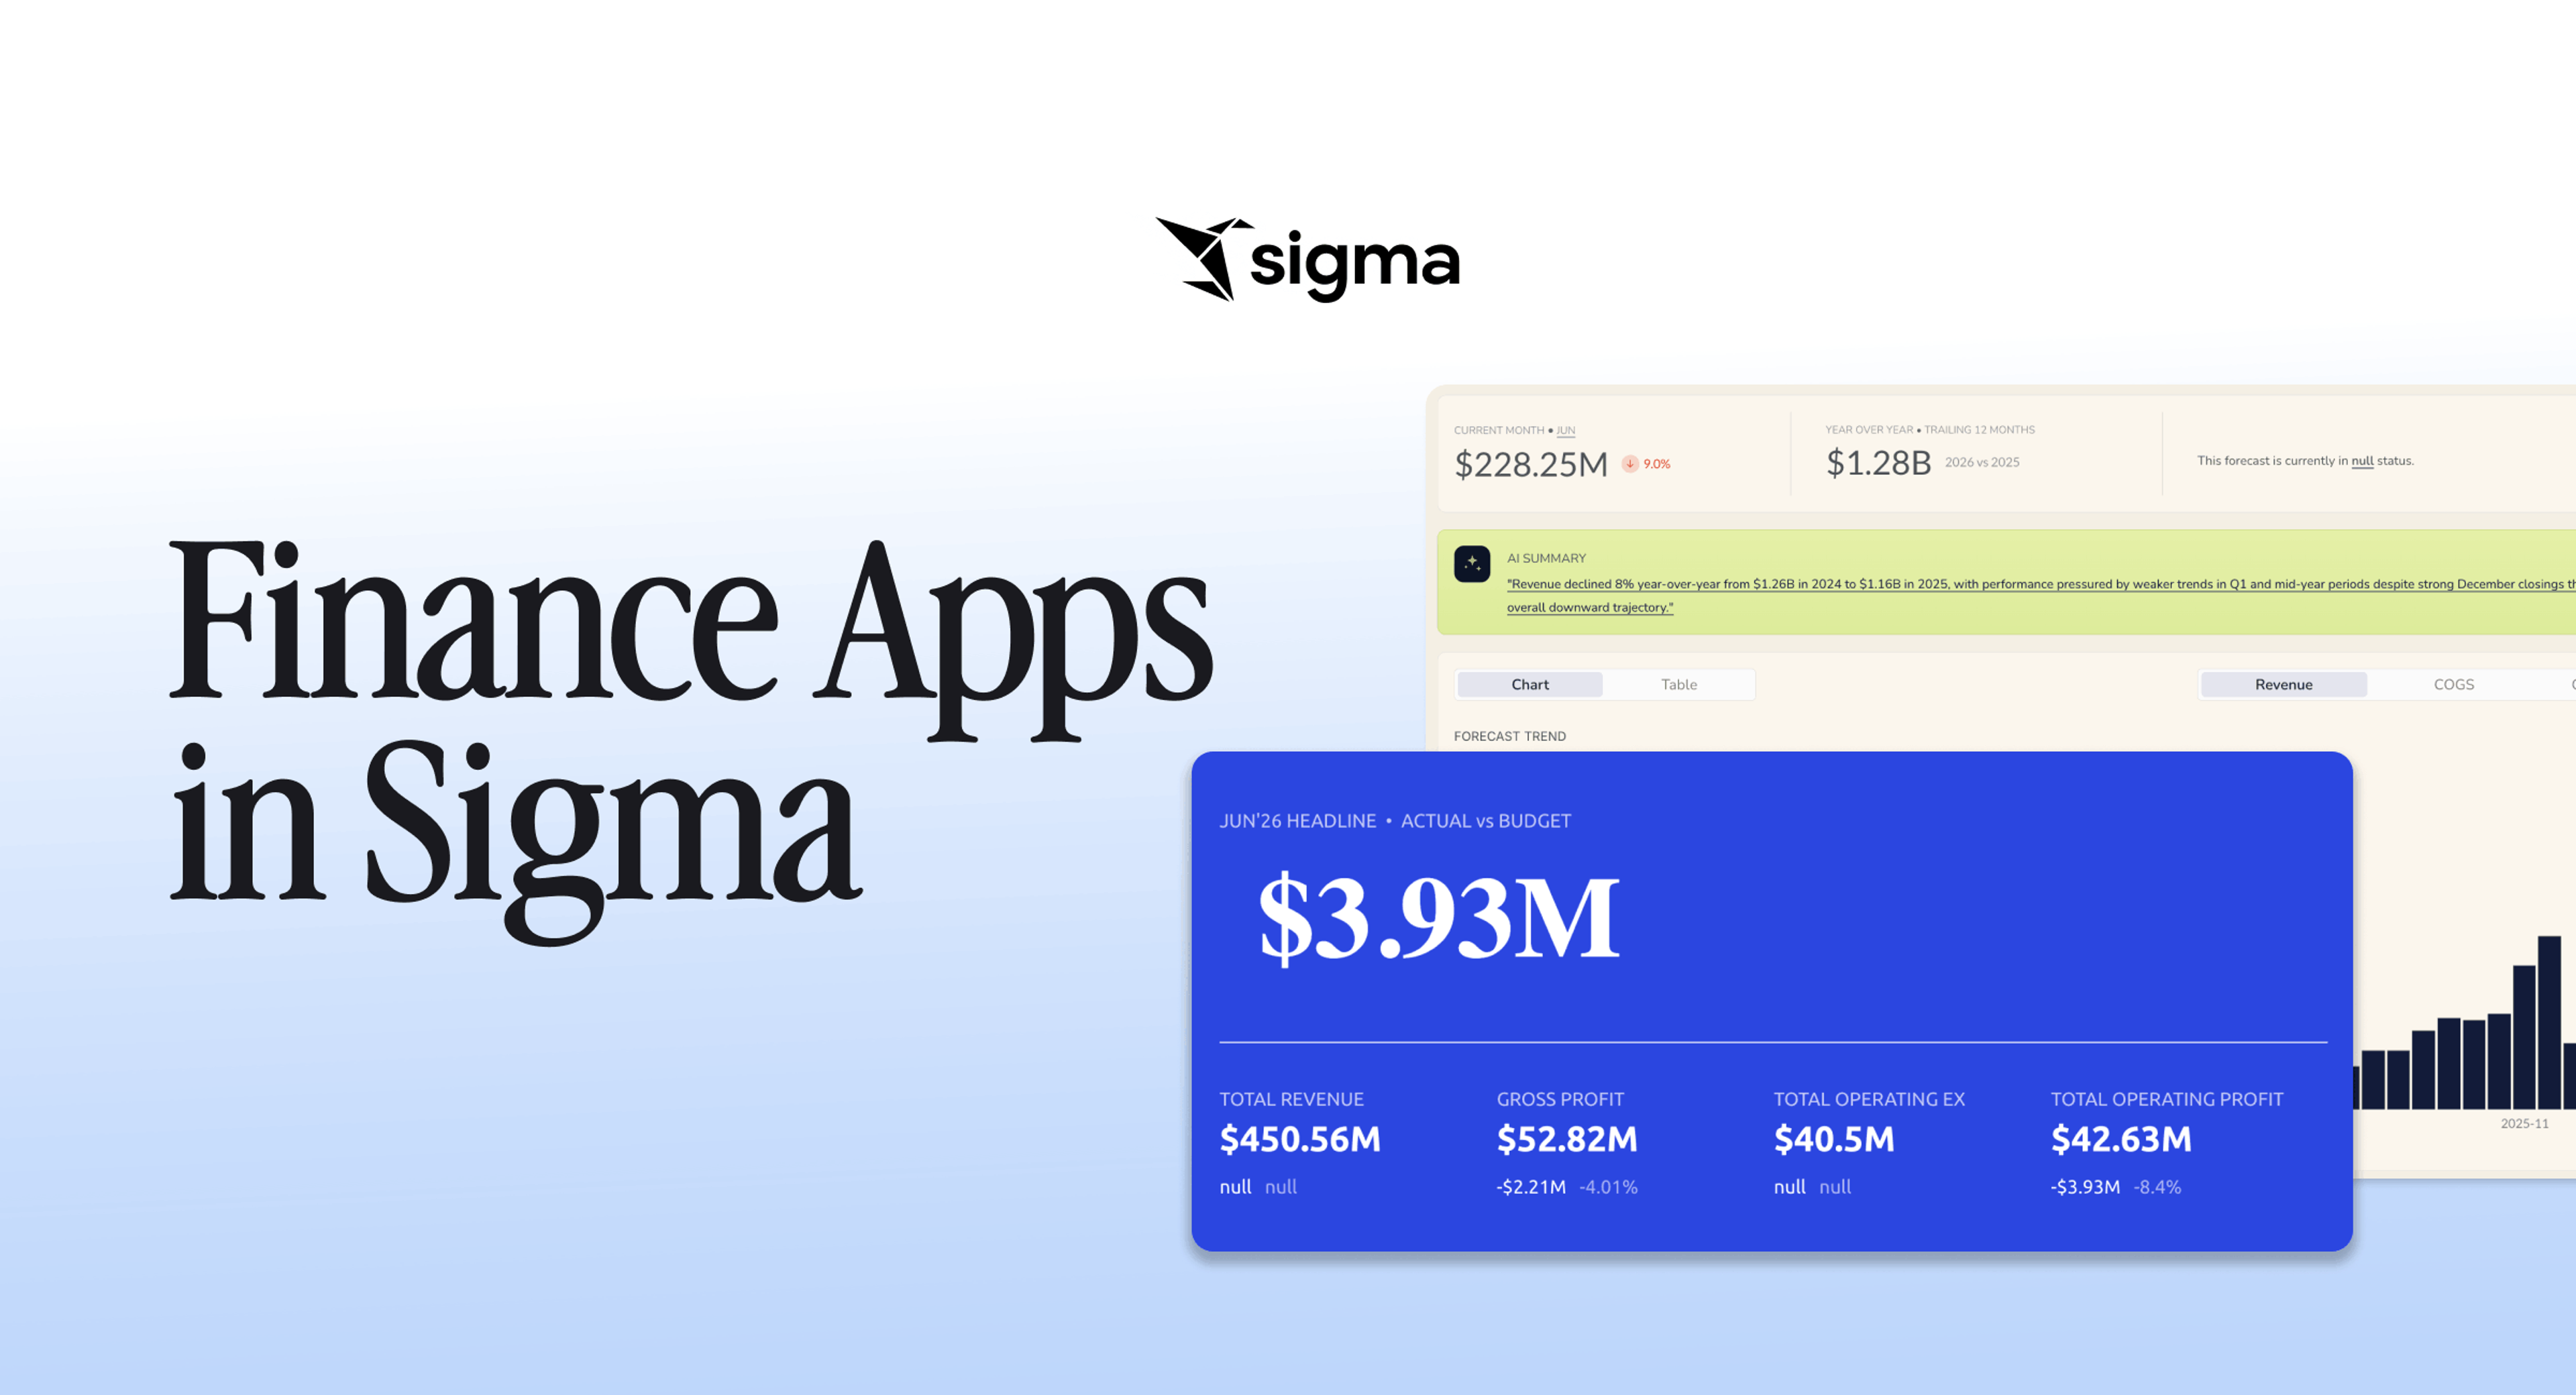
This is exactly the kind of problem that belongs in the warehouse. The budget variance app I built in Sigma replaces those 20 files with a single view. The plant manager opens one roll-up instead of 20 spreadsheets; the regional controller sees across all 10 plants from the same place. Because it sits on the warehouse, the app aggregates the numbers at every level — department, plant, region — so users can read the top-line variance and then drill into the exact transaction behind it, without switching tools or waiting on an analyst to pull a new report.
It also handles the part that used to eat the most time, which is the commentary. Instead of reading through 20 sets of analyst notes to pull out the themes for an earnings call, the app uses AI to summarize them. One publicly traded company with hundreds of billions in annual revenue used this approach to cut its close time from 12 days to 9.
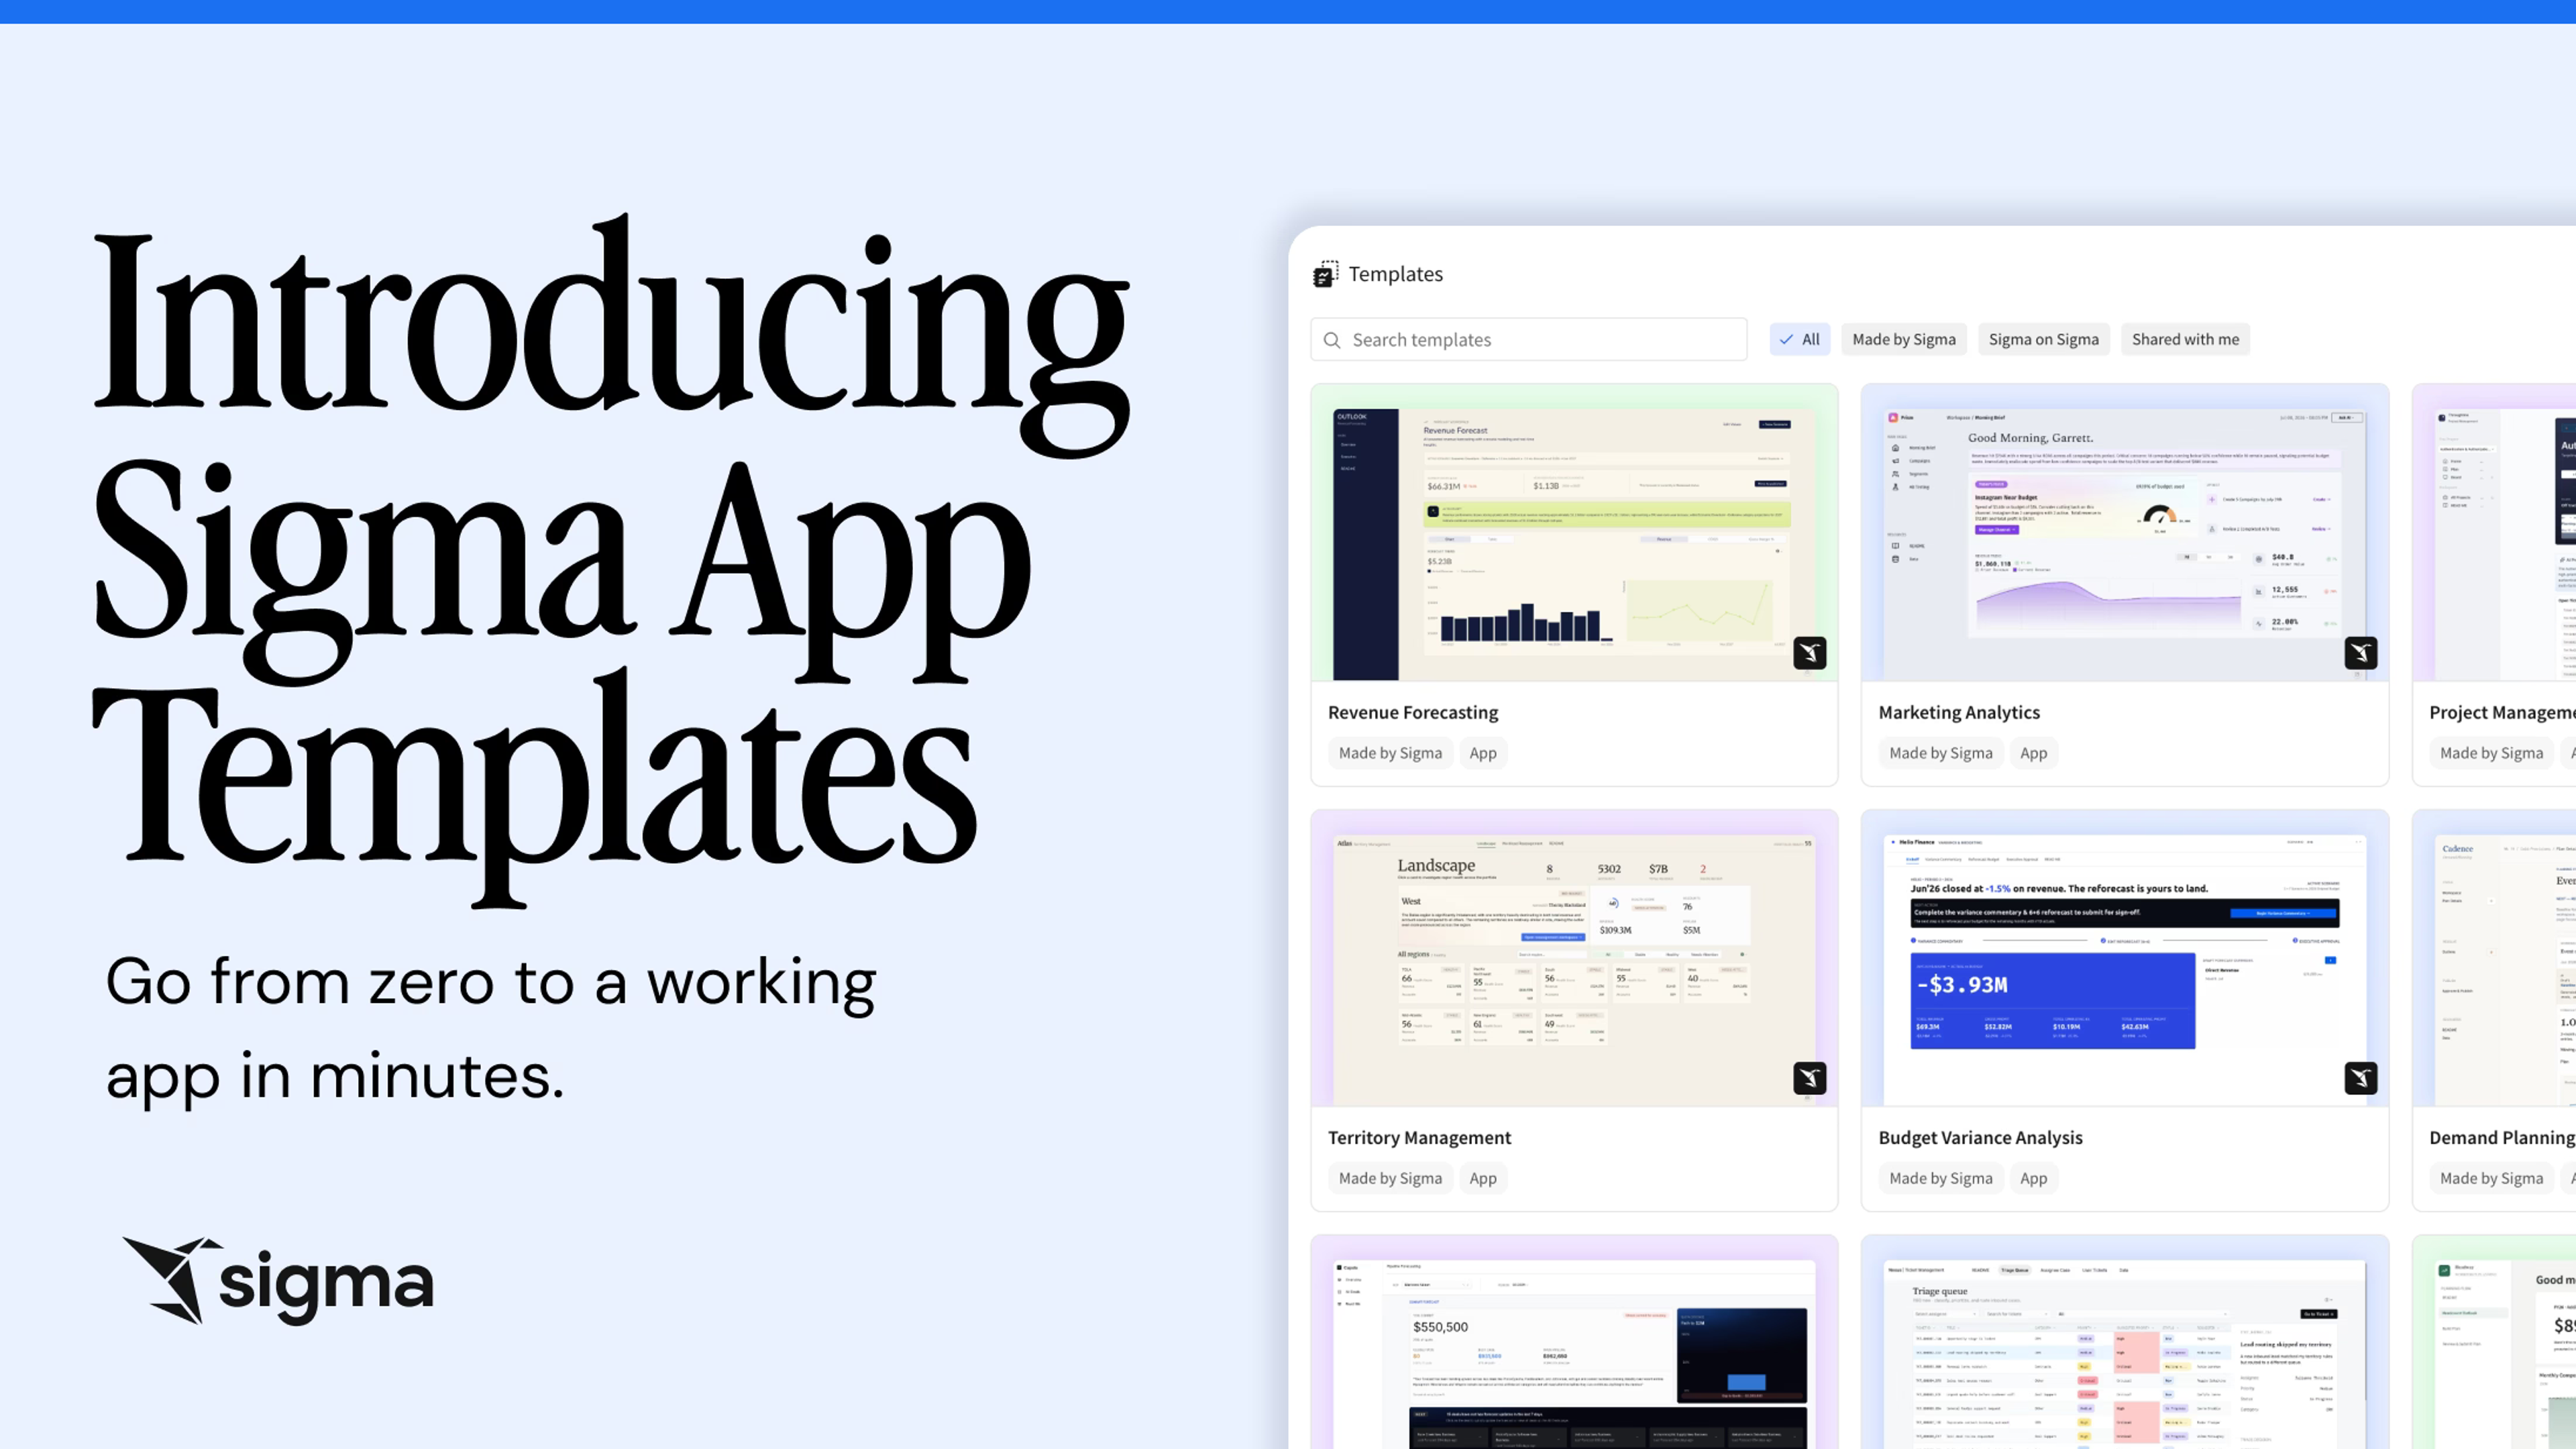
And it isn’t the heavy lift you’d expect to build. If your data is in good working order, you can have a working prototype in a day. Budget variance is one of the first apps in our starter template library because it’s such a common, repeatable pattern.
Revenue forecasting: you can’t fix what you can’t see
Revenue forecasting is probably the most consequential thing a business does. The revenue forecast determines everything else — including how much you can spend, how many people you can hire, and what initiatives you can fund. If you forecast $400M in ARR and you come in at $300M, that’s more than a miss on a spreadsheet. At its worst, it could mean layoffs.
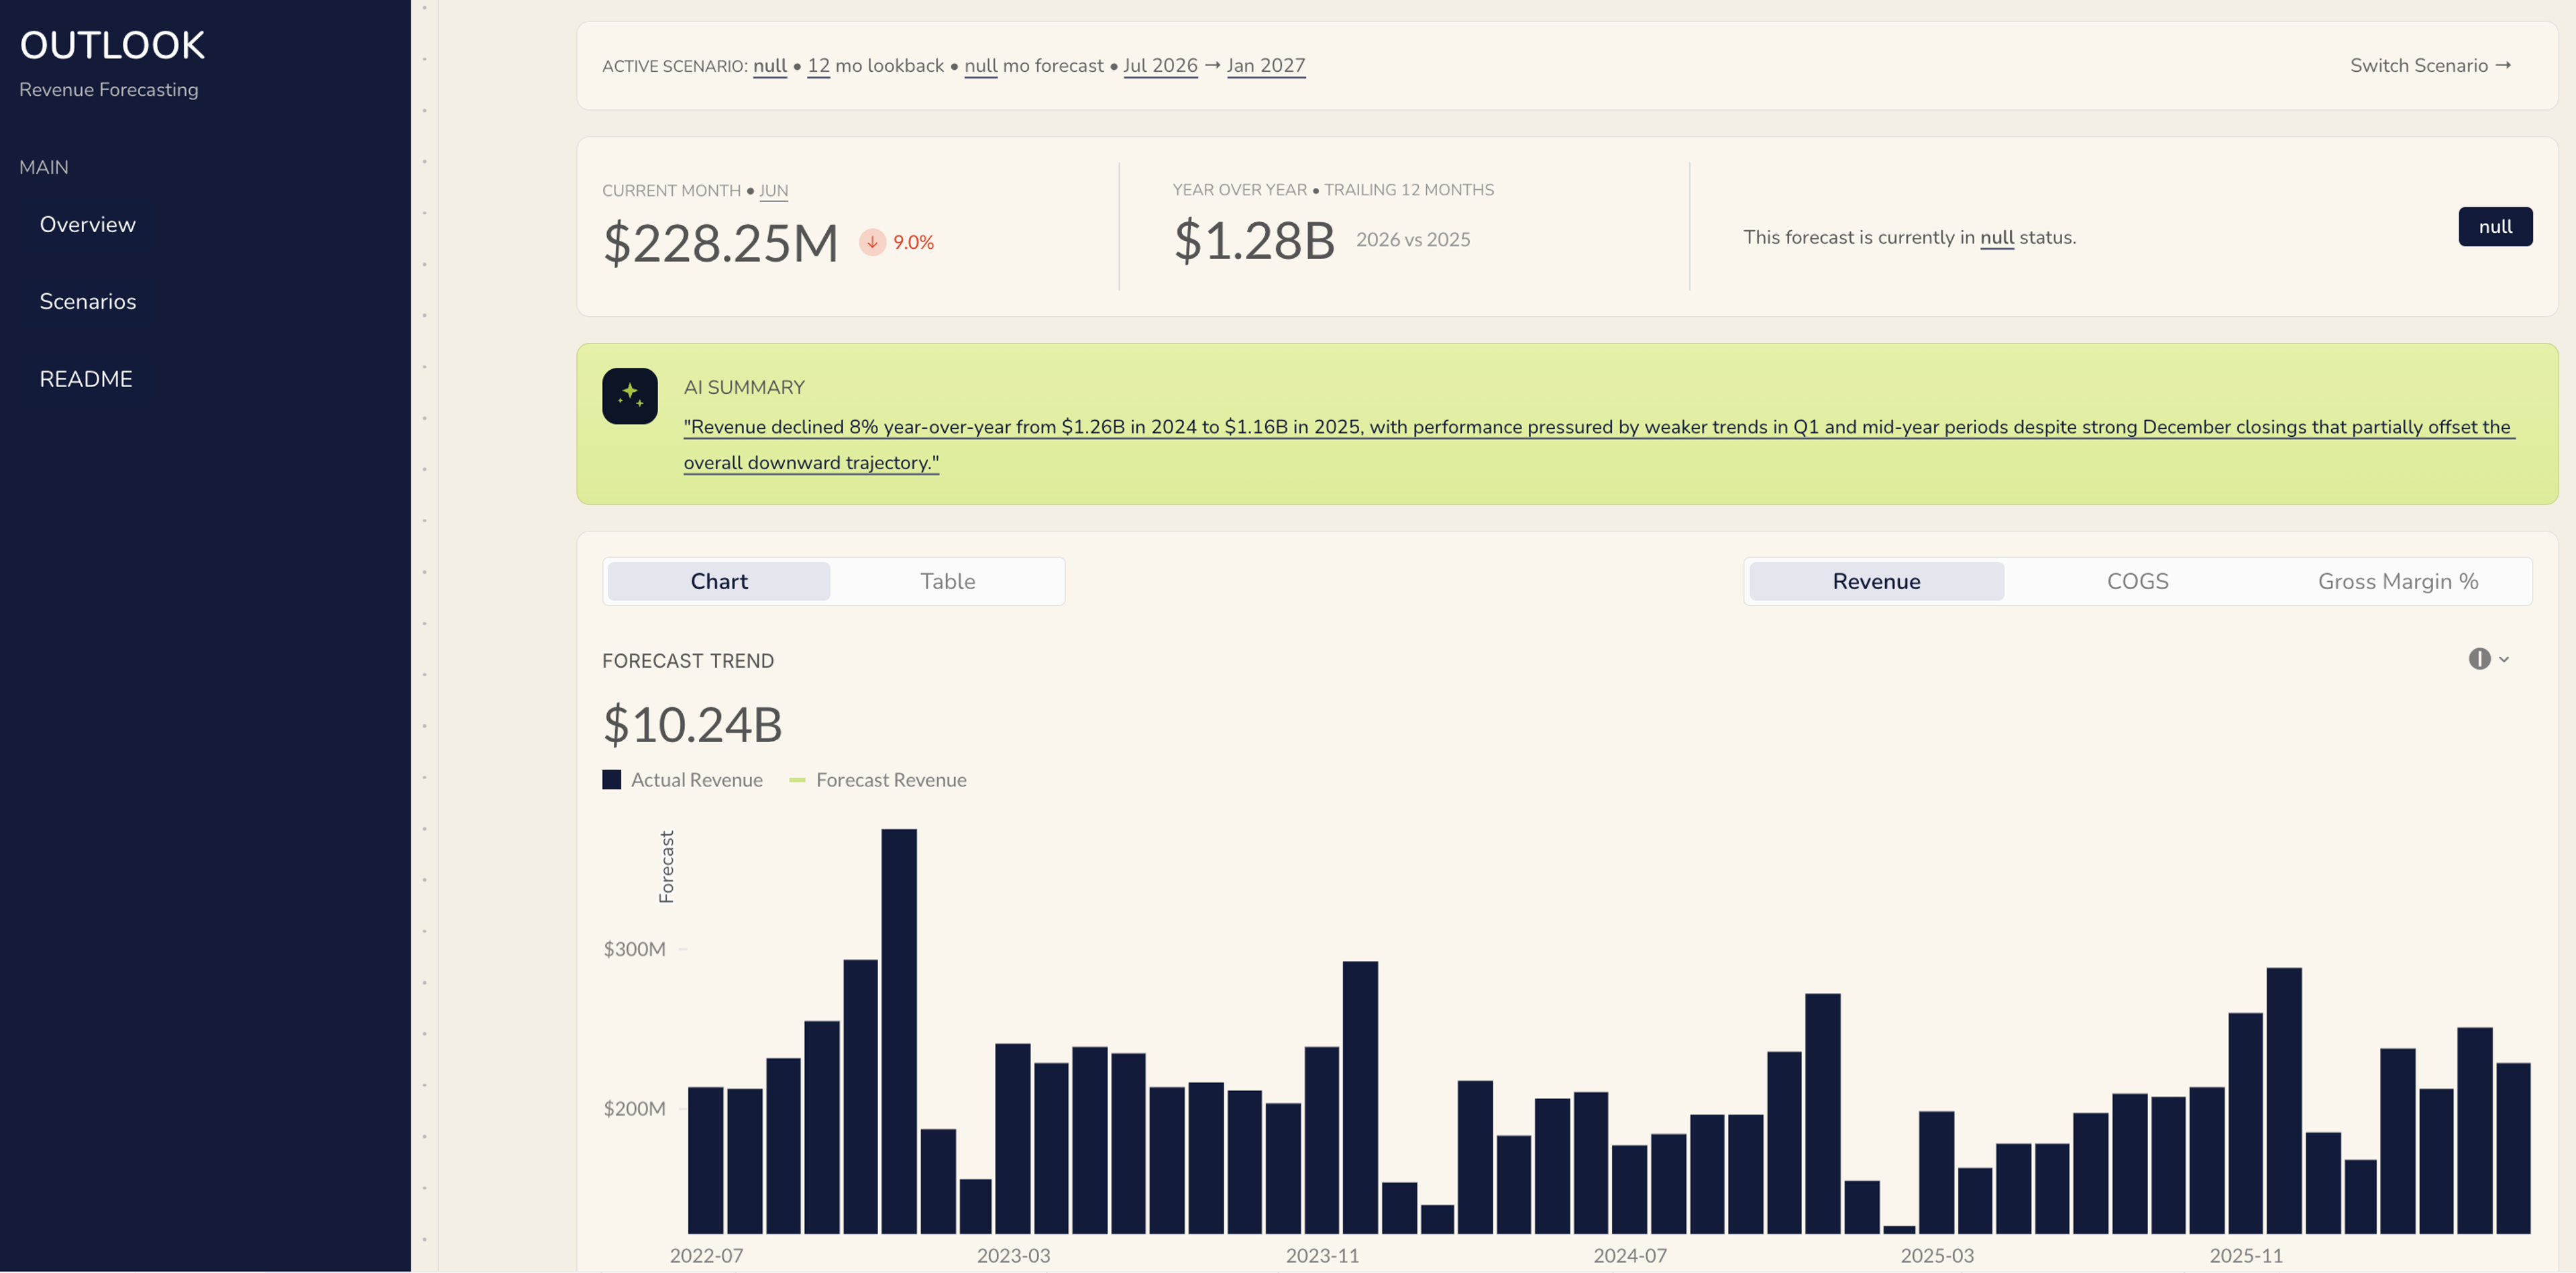
So, why do companies keep getting it wrong? A big part of it is that when you can’t see where the problem is, you can’t fix it. And in most companies today, the revenue data is so aggregated by the time it reaches the people making decisions that there’s nothing actionable in it.
I’ve seen this firsthand. One company had built an elaborate labyrinth of spreadsheets just to take their source data and push it down to a level where it was actually usable — hundreds of IF functions, mapping GL accounts to categories, trying to get to what actually happened. That was so much work, they couldn’t even take that output and forecast forward. All they could do was look backward. When it came to forecasting, they were just making directional guesses.
This is where Excel runs out of room. Once you get over 300 or 400 thousand rows, it starts to become unusable, so the moment your data gets big enough to be useful, the tool can’t hold it. In the app I built with Sigma, a table with 5 million rows works just as well as one with 5 billion, because the calculation happens in the warehouse, not in a local file. That’s what gives you the visibility to actually run the analysis and forecast forward.
From there, you can see what’s happening at a product family level, a product line level, a brand level. You can use pivot tables, SUMIFs, and filters — concepts that every Excel user already understands — to identify exactly where you’re on track and where you’re not. Layer in Sigma Assistant, and you can move even faster.
And then, when you know where you’re falling short, you can dig into why. Is pricing the issue, or volume? If it’s volume, is the whole market down, or are competitors taking share? You can bring in external market data through Snowflake and Sigma to answer that question. This gives you an actual basis for a conversation, not just a number that nobody can act on.
Headcount planning: the same pattern, higher stakes
Headcount planning has all the same structural problems as the other two workflows, with one added dimension: the data is some of the most sensitive in the company.
The core challenge is scale plus motion. Every headcount connects to a cascade of costs like salaries, bonuses, benefits, payroll taxes, software, or travel. Across 20 departments and 12 months, you’re already managing thousands of data points before you’ve run a single scenario. And the minute you export your roster, it starts going stale. People join, people leave, start dates slip, salaries shift.
Traditional BI tools are read-only by design. Dedicated FP&A tools move things out of spreadsheets, but they’re often separate, rigid platforms that create a new kind of data silo — complex to set up, slow to change, and still lagging behind the business.
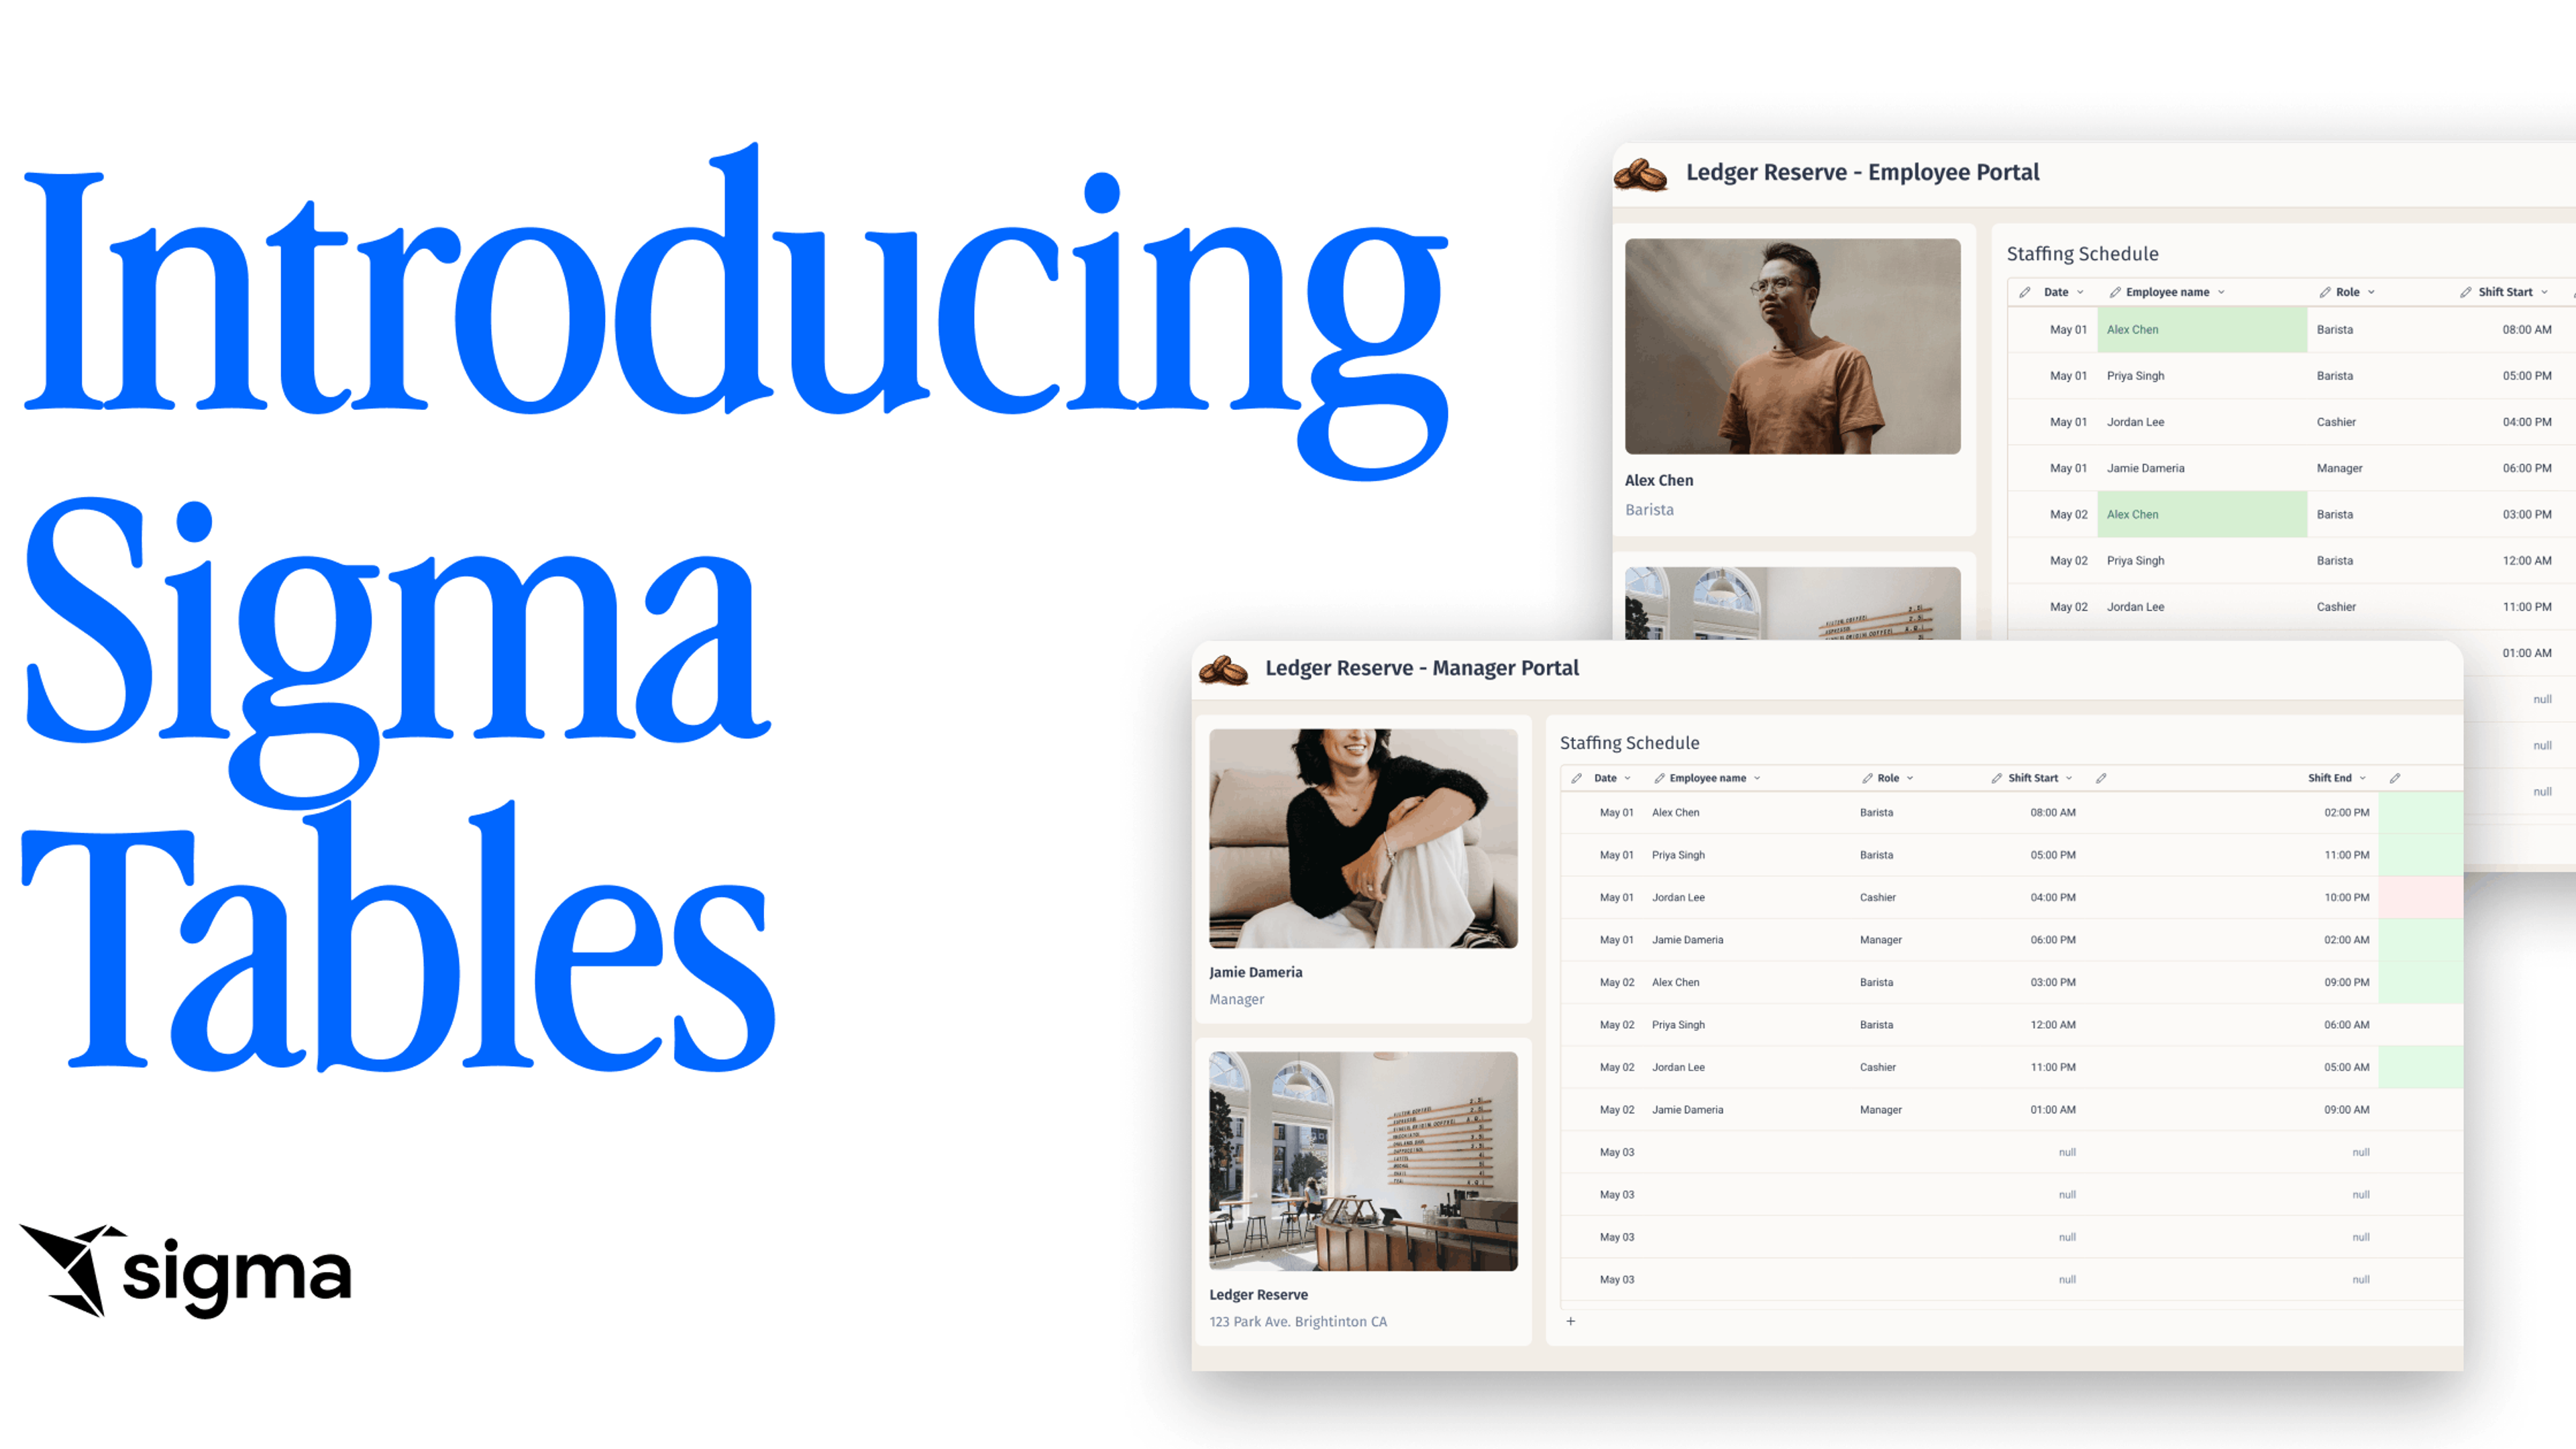
The headcount app I built does this in one view. Finance sees real-time headcount summaries and costs and can model scenarios straight against the budget; HR reviews and approves headcount requests with the financial and departmental data already attached. Because it’s connected to the warehouse and writable, I’m not just reading a plan — I model it, adjust it, and write the changes back to the source. New hires, departures, and pay adjustments flow through on their own, so the plan never drifts from what’s actually happening.
I went deep on this one in its own article, including all 5 challenges and how the app handles each. If headcount is where your team loses the most time, start there.
Getting started is faster than you think
All three of these are templates in Sigma. They’re in our starter library because they’re common, repeatable patterns that nearly every finance team needs. The best part is that you don’t need an army to stand one up, either.
A BI person sets up the first build. From there, finance teams learn it and start taking it on their own. When someone realizes they need to change something, they quickly realize they can. It’s not like reconfiguring software. It’s much closer to updating a complicated Excel model, just without the version chaos and the margin for error.
And the data is already in your warehouse. You’re already paying for it, and you’re already relying on it for everything else. Finance is just the last place to connect it.
Stop doing ETL, start doing finance
Any time you’re spending going into a system, downloading the data, cleaning it, putting it into a template, joining it to data from somewhere else, and checking the numbers to make sure they’re right — is wasted time. That work is simply the scaffolding, not the work itself.
As I already mentioned, most finance teams will tell you they spend 80 to 90% of their time just meeting the minimum reporting requirements — being, as one person put it to me, a glorified data monkey. Everyone knows that’s not the future. AI is coming for that data work. What it isn’t coming for is the human-to-human conversation about how you’re going to pull off an initiative, or whether you need a new person to do it.
The apps I built aren’t actually about helping you get better at busywork, but about taking it off your plate entirely, so your time goes where it matters. The headcount discussion becomes which company strategic initiatives you’re staffing, why, and what they cost. The revenue discussion becomes where you’re growing and how that funds everything else. The commentary becomes the most important thing impacting the business that leadership needs to know and act on.
That’s what finance is for. Budget variance, revenue forecasting, and headcount planning — all connected to your warehouse, all in one place — are how you get there. Come get on board.