Embedded Reporting: A Practical Guide for SaaS Product Teams

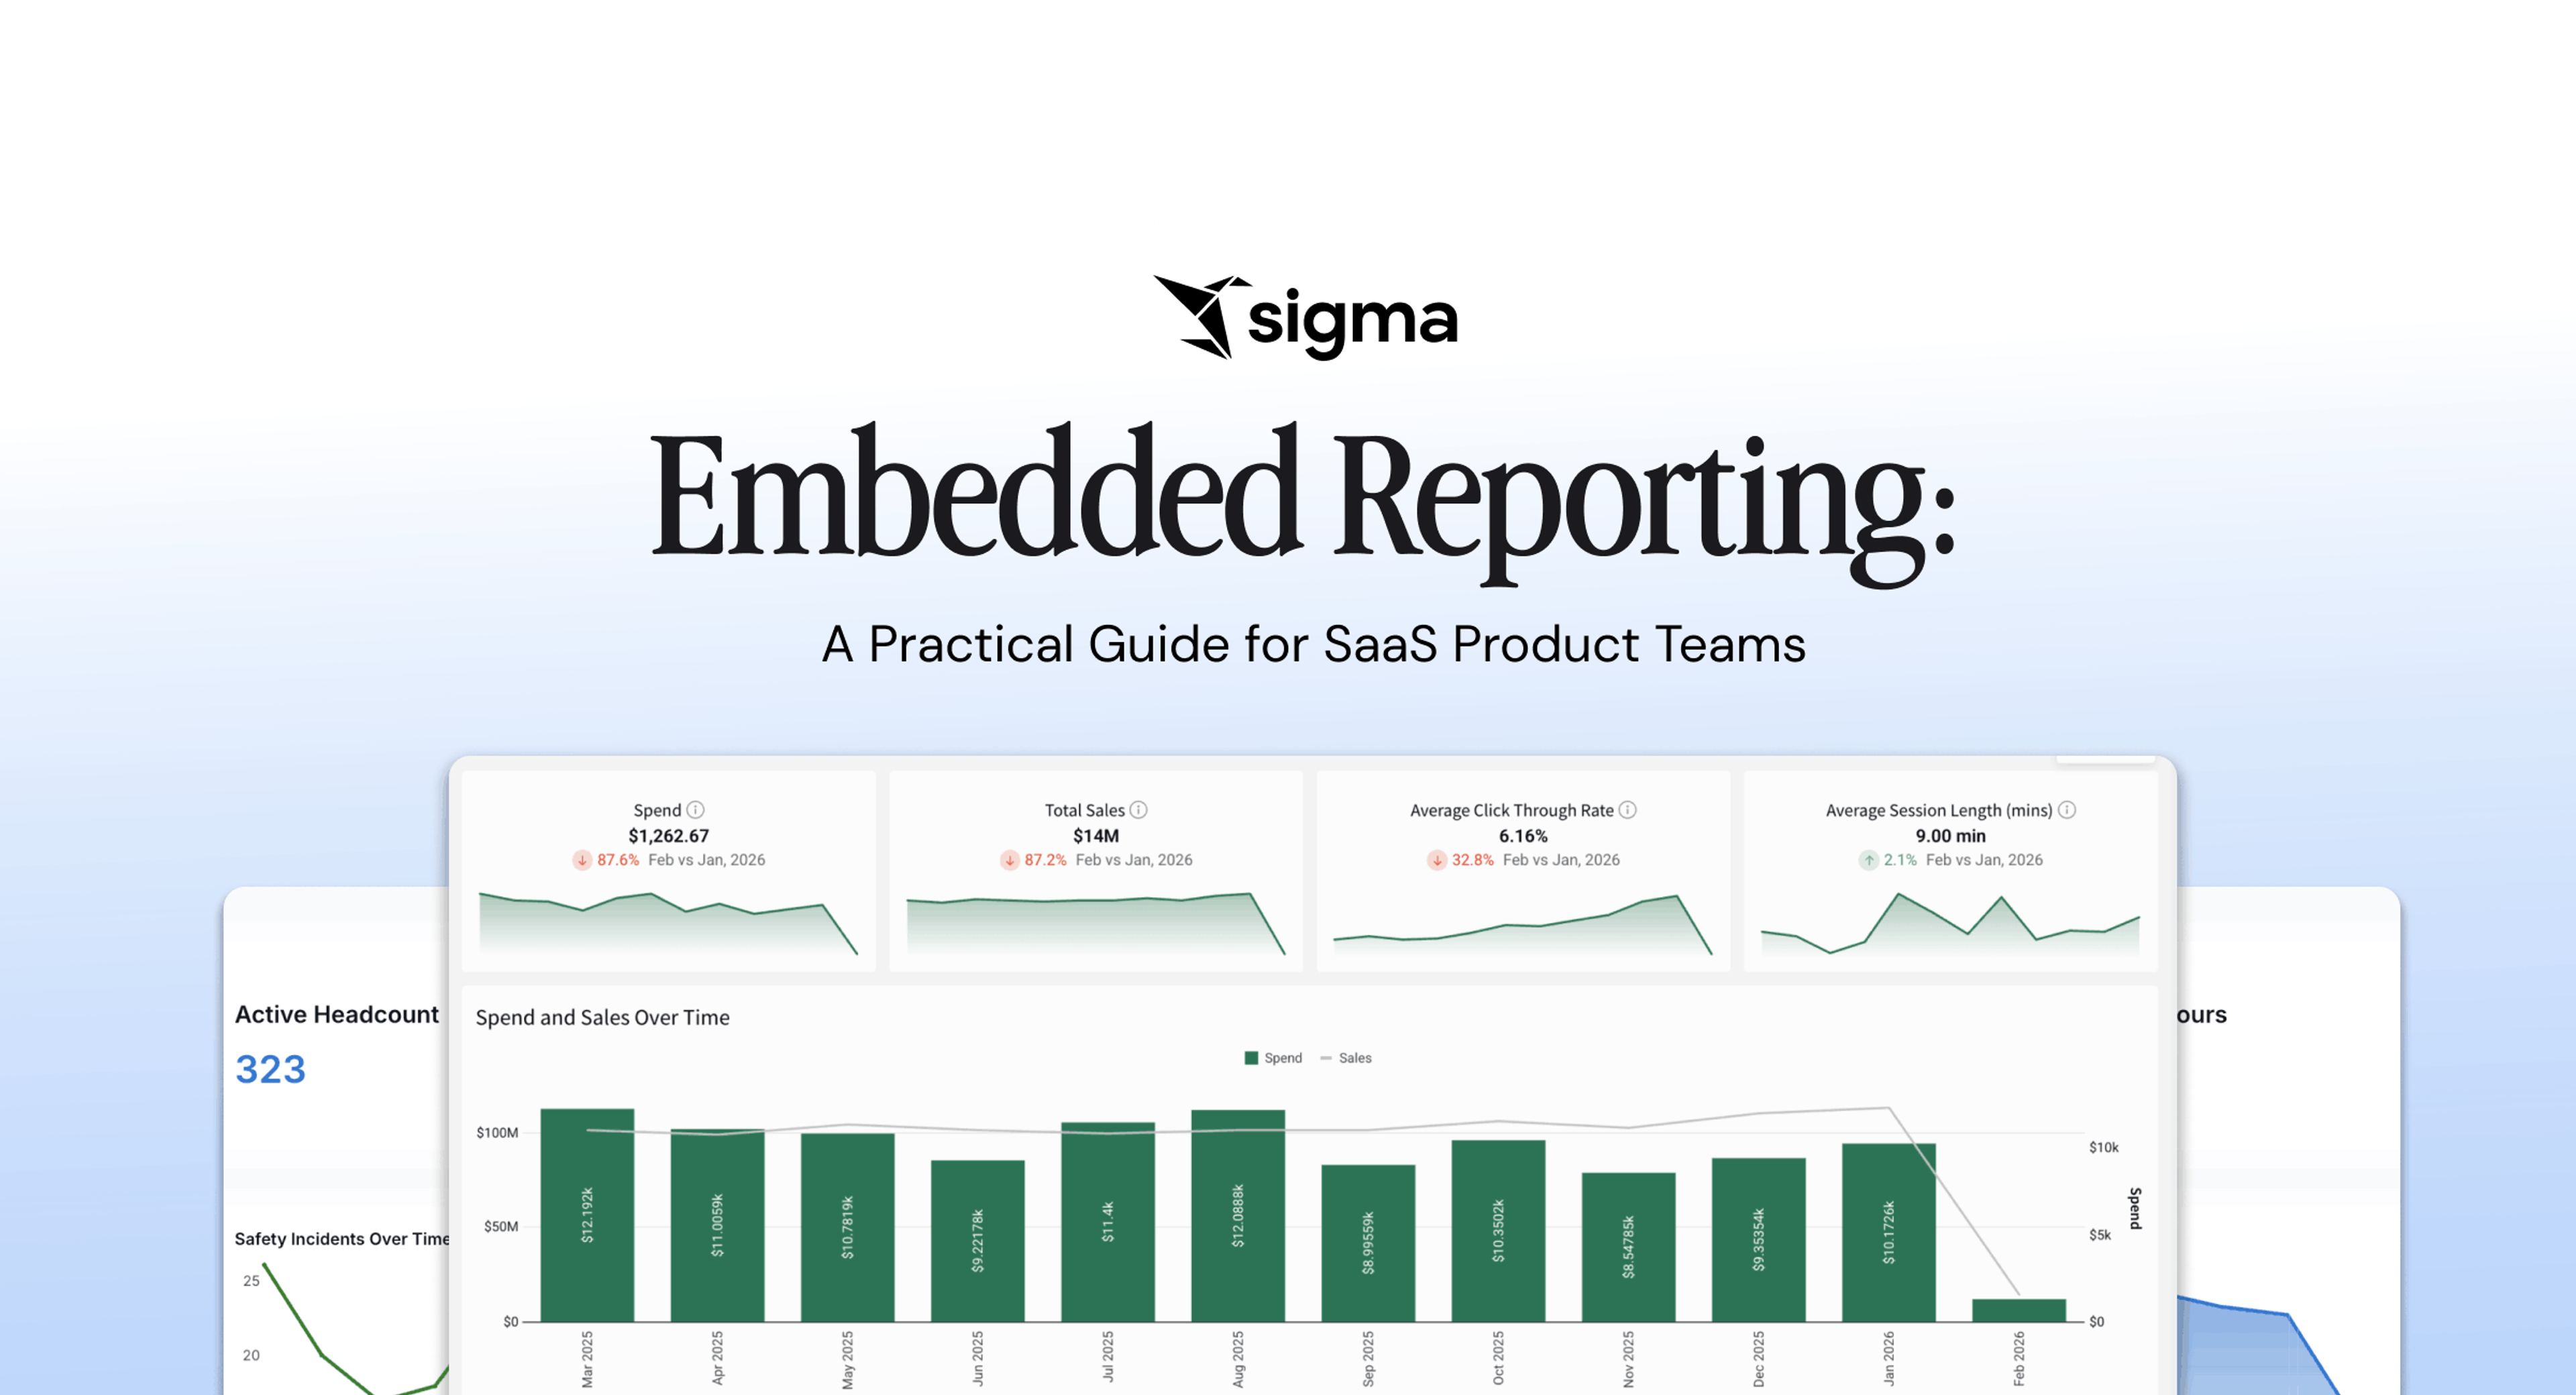
Embedded reporting is often the first analytics feature a SaaS product team ships. It answers a specific customer ask, fits inside a milestone the team can commit to, and stands on its own once it's live. After it ships, customers usually come back asking for more, and the way you built the first version determines how quickly and how far you can deliver additional features.
This guide explains what embedded reporting is, covers what customers tend to ask for next, and lays out how to implement it so it can grow with your product without a re-architecture.
Key takeaways
- After you ship embedded reporting capabilities, customers typically ask to filter, drill down, and check numbers between deliveries. Those requests call for live, interactive access, which is foundational to self-serve analytics.
- When building embedded reporting, query the warehouse live at query time, run a single governance and row-level security model across every embedded surface, and avoid duplicate data models by using a single tenant-aware template filtered per user.
- A single warehouse-native platform lets embedded reporting and self-serve analytics share one foundation. The report you ship first, and the interactive access customers ask for later, inherit the same security from the moment they're built.
What is embedded reporting?
Embedded reporting is the delivery of scheduled, audit-ready reports through a product's own interface. The reporting function is integrated into the host app, branded to it, governed by the product's access controls, tied to a specific tenant, and traceable through an audit trail.
Delivery formats include PDFs, CSV exports, and fixed dashboard snapshots surfaced natively in the product UI or distributed through channels the product controls. Customers get the same governed view of their data on the same schedule every cycle: a monthly revenue recognition report, a weekly campaign summary, a quarterly compliance export. Delivery can happen through an in-product page, an on-demand export, or a scheduled email from the product.
Embedded reporting is a component of the broader embedded analytics category and can also serve as a standalone feature.
Embedded reporting vs. static reporting
The outputs of embedded reporting and static reporting can look similar on a page. They differ in whether the host product can guarantee anything about who saw the report, which version they saw, or which tenant it belongs to. Reading directly from the source avoids the freshness lag that comes with extract-based pipelines and keeps the report's numbers reconcilable with anything else the customer sees in the product.
| Embedded reporting | Static reporting | |
|---|---|---|
| Where it lives | Inside the product or customer portal, or in channels the product governs | Shared drive, external file, or an emailed attachment with no product oversight |
| Access | Native to the product session, no extra login | Requires the file, often forwarded around |
| Branding | Fully branded to the host product | Vendor-branded template |
| Audit trail | Governed and traceable inside the platform | Whatever the recipient does with the file |
| Update path | Same surface, refreshed on schedule | New file each cycle |
- Where it lives: Embedded reporting surfaces the report within the product or customer portal, or delivers it through channels the product controls, such as a scheduled email the product itself sends with tenant scoping and delivery logging. Static reporting sits outside any such system, so once a report leaves the sender, the host product has no visibility into where it ended up.
- Access: With embedded reporting, the customer opens the report within the product session they're already authenticated in, with no separate login and no attachment to find. Static reporting depends on the customer having the right file at the right time, with no reliable way to keep old copies out of circulation.
- Branding: Embedded reporting renders in the host product's brand, using the same header, colors, and layout the customer sees everywhere else in the app. Static reports typically arrive in the analytics vendor's default template, which reads as a third-party artifact rather than a native feature.
- Audit trail: Embedded reporting keeps the report inside a system the host can log and govern, tracking who opened it, when, from which tenant, and which version they saw. Static reporting hands the file to the recipient and loses that trail, which finance and compliance customers tend to notice fast.
- Update path: With embedded reporting, the same surface refreshes on schedule and every customer sees the current version. Static reporting produces a new file each cycle and leaves prior versions floating around in inboxes, so customers can end up reconciling numbers against outdated copies.
Embedded reporting delivers scheduled, governed reports that originate from the product and remain under its control. Static reporting delivers similar artifacts without that product-level integration.
Why SaaS teams build embedded reporting first
For many SaaS teams, embedded reporting is a practical starting point before any other interactive analytics feature. That sequence usually comes down to three reasons.
It matches the literal customer request
Early customers often request embedded reporting in literal terms. Customer success hears, We need a monthly report we can send to our board, and logs it as a reporting request. When the same ask repeatedly arrives from the same vertical, it can become a prioritized roadmap item with retention weight assigned to it.
It fits an initial milestone without committing to a full analytics build
A production analytics build can require upfront engineering and ongoing maintenance. Reporting is a lower-risk entry point. A scoped reporting feature on a purchased platform can fit an initial product milestone without committing the team to a full in-house analytics build.
It stands on its own as a finished feature
A scheduled report can be a finished feature. Audit-ready reports on revenue recognition, invoices, and deferred revenue support real finance and compliance workflows. Once shipped, the report continues to deliver value on its own without waiting for a larger self-serve program. Full self-serve interactivity can stay deferred to a later phase.
The foundational choices that let a reporting feature scale, though, should be in place from the start: live access to the warehouse, tenant isolation, and a single governance model. Those choices are cheaper to make on day one than to retrofit later.
When customers ask for more: self-serve embedded analytics
Once the embedded reporting feature ships, customers often come back with a predictable set of follow-ups. They want to filter the data by their own regions, product lines, or date ranges. They see a number move and want to drill into what sits behind it. They need to check a value on Wednesday afternoon, three days before the next scheduled delivery.
Those requests are a sign the customer got value from the report, worked with it, and now has questions the report was never designed to answer. That calls for a different capability: self-serve embedded analytics.
Self-serve embedded analytics gives customers live, interactive access to explore the underlying data themselves. Customers filter, drill down, change date ranges, and in some configurations query the data directly through a no-code interface. Instead of showing a fixed metric, you let people ask their own follow-up questions and get answers without leaving your product or filing a ticket.
Embedded reporting and self-serve embedded analytics are two distinct capabilities. Embedded reporting delivers governed, repeatable snapshots. Self-serve embedded analytics delivers live exploration.
Build embedded reporting in 6 steps
Shipping embedded reporting comes down to a repeatable sequence. The specifics differ by product, but the process is fairly consistent across use cases.
1. Scope the report with the customers who asked for it
Pin down what a "report" means to the customer requesting it.
- Which metrics belong on the page?
- What cadence do they need: weekly, monthly, or quarterly?
- What format do they expect at the receiving end: a PDF for the board deck, a CSV for the finance team's spreadsheet model, or an in-product view for their operations lead?
Getting these answers up front prevents scope drift once the feature is live.
2. Connect to the source of truth
Point the report at the system where the numbers actually live. For most SaaS products, that means the cloud data warehouse the product already writes to. Reading directly from the source avoids the freshness lag that comes with extract-based pipelines and keeps the report's numbers reconcilable with anything else the customer sees in the product.
3. Design a single tenant-aware template
Build one report template that renders per-tenant and is filtered by an authenticated user or account identifier at query time. Every customer sees the same layout with their own data. Avoid forking a template per tenant, since it multiplies maintenance overhead and creates room for templates to drift out of sync.
4. Choose delivery surfaces
Decide where the report lives. Options include an in-product page the customer can open on demand, a downloadable export, or a scheduled email the product sends. Email can work as an embedded channel when the product governs the send, targets a specific tenant, and logs the delivery. A file emailed outside that system, with no product-level oversight, is closer to static reporting.
Start with the surfaces the initial customers explicitly asked for, and add more once real usage signals appear.
5. Set up the audit trail
Log which reports were generated, when, for which tenant, and who received them. Finance and compliance customers will ask for this once the report becomes part of their workflow. Building the audit trail from the beginning is less work than backfilling it later.
6. Instrument and iterate
Track which reports get opened, which formats get exported, and where customers stop engaging. The follow-up requests that arise from real usage (filter by region, drill into a line item, check a number between deliveries) are the input for your next phase.
Best practices for embedded reporting
Whether an embedded reporting feature holds up over time and grows with your customers depends on three architectural choices made before shipping. Treat these three practices as ground rules: ship embedded reporting first, then add self-serve exploration on the same foundation.
Query the warehouse live
The report should query the same warehouse the product already writes to at query time, and avoid extracts or nightly copies. Extract-based pipelines introduce freshness lag, and an older value can be less useful for a customer making a live decision. When the report and any future interactive surface both query live warehouse data, the numbers a customer schedules and the numbers they drill into come from a single, self-consistent source.
Run one governance and row-level security model
Tenant isolation is a shared requirement across reporting and any interactive surface you add later. Row-level security, tenant filters, and field-level permissions need to apply equally to a scheduled report and a live query.
A misconfiguration in a static report surfaces on the next delivery, while a self-serve query exposes it instantly. Attach access rules to a shared semantic layer rather than to individual dashboards, and each new embedded surface can inherit the same security posture. Without that, each surface may need its own governance audit.
Avoid duplicate data models
A single tenant-aware template also prevents metric definitions from drifting. Keep definitions like Revenue in a single model, so updates happen only once. Forked per-tenant templates or duplicate models allow finance and sales to count refunds differently, leaving customers to reconcile two numbers without a single source of truth.
How Sigma supports embedded reporting
A common failure mode in legacy BI is fragmentation: a reporting tool that can't scale into interactivity, or an interactive surface bolted onto a separate reporting product, each with its own governance model to configure. A second phase then turns into a re-architecture.
Sigma is the runtime layer to build and scale analytics, apps, and agents on live cloud data warehouse data. For SaaS teams, embedded reporting runs directly on the warehouse the product already writes to, on live warehouse data, with a single governance model, and a single platform for reporting and self-serve analytics.
Report Builder for audit-ready paginated reports
Report Builder handles the reporting use case directly. It produces audit-ready paginated reports with export bursting, PDF and image exports, custom SMTP, and scheduled or on-demand runs. It's typically the first surface a team ships: a governed, branded report their customers can count on every cycle.
Warehouse-native pushdown
Formulas, filters, pivot tables, and sort compiles to SQL that runs inside the connected cloud data warehouse. There is no in-memory engine, no data extraction, and no snapshotting. Reports read live warehouse data at query time, so the number a customer sees on the page reconciles with any other information they see in the product.
Row-level security inherited from the warehouse
Because queries execute inside the warehouse, row-level security, column-level security, and access controls apply at query time from the source. Sigma does not maintain a parallel permissions system to keep in sync.
Sigma Tenants for multitenant isolation
Sigma Tenants provides enterprise multitenant isolation with data separation, cross-region provisioning, and source-swap policies designed to meet enterprise security and compliance requirements. Product teams get the isolation guarantees their customers ask for without having to build their own tenant model.
Embedded analytics on the same surface
When customers ask for filtering, drill-down, and live access, Sigma's embedded analytics extends the same surface without a second platform.
Hosts tune functionality across three levels: view-only, drill-down, and full edit mode, where end users can run ad hoc analyses and build their own workbooks. Each level is a revenue lever you can package as a paid tier, which matters because reporting and analytics add-ons can be packaged for expansion revenue.
Get started with embedded reporting in Sigma
To know whether a reporting feature can grow with your customers, build the first version and test how far it extends. Ship a scheduled report with Sigma's Report Builder. Then, when a customer asks to filter it themselves or check a number between deliveries, see how far the same platform carries you toward self-serve access without a second platform or a new security model.
Sigma delivers embedded reporting and self-serve analytics on a single warehouse-native platform. With this architecture, the report you ship first and the interactive access customers ask for later inherit the same governance from the moment they're built. Teams that ship embedded reporting features with Sigma do not adopt a second platform or rebuild security to add self-serve later on.
Get a demo or try Sigma free to build your first embedded report on Sigma.