How to Build a Cash Flow Dashboard: A Step-by-Step Guide

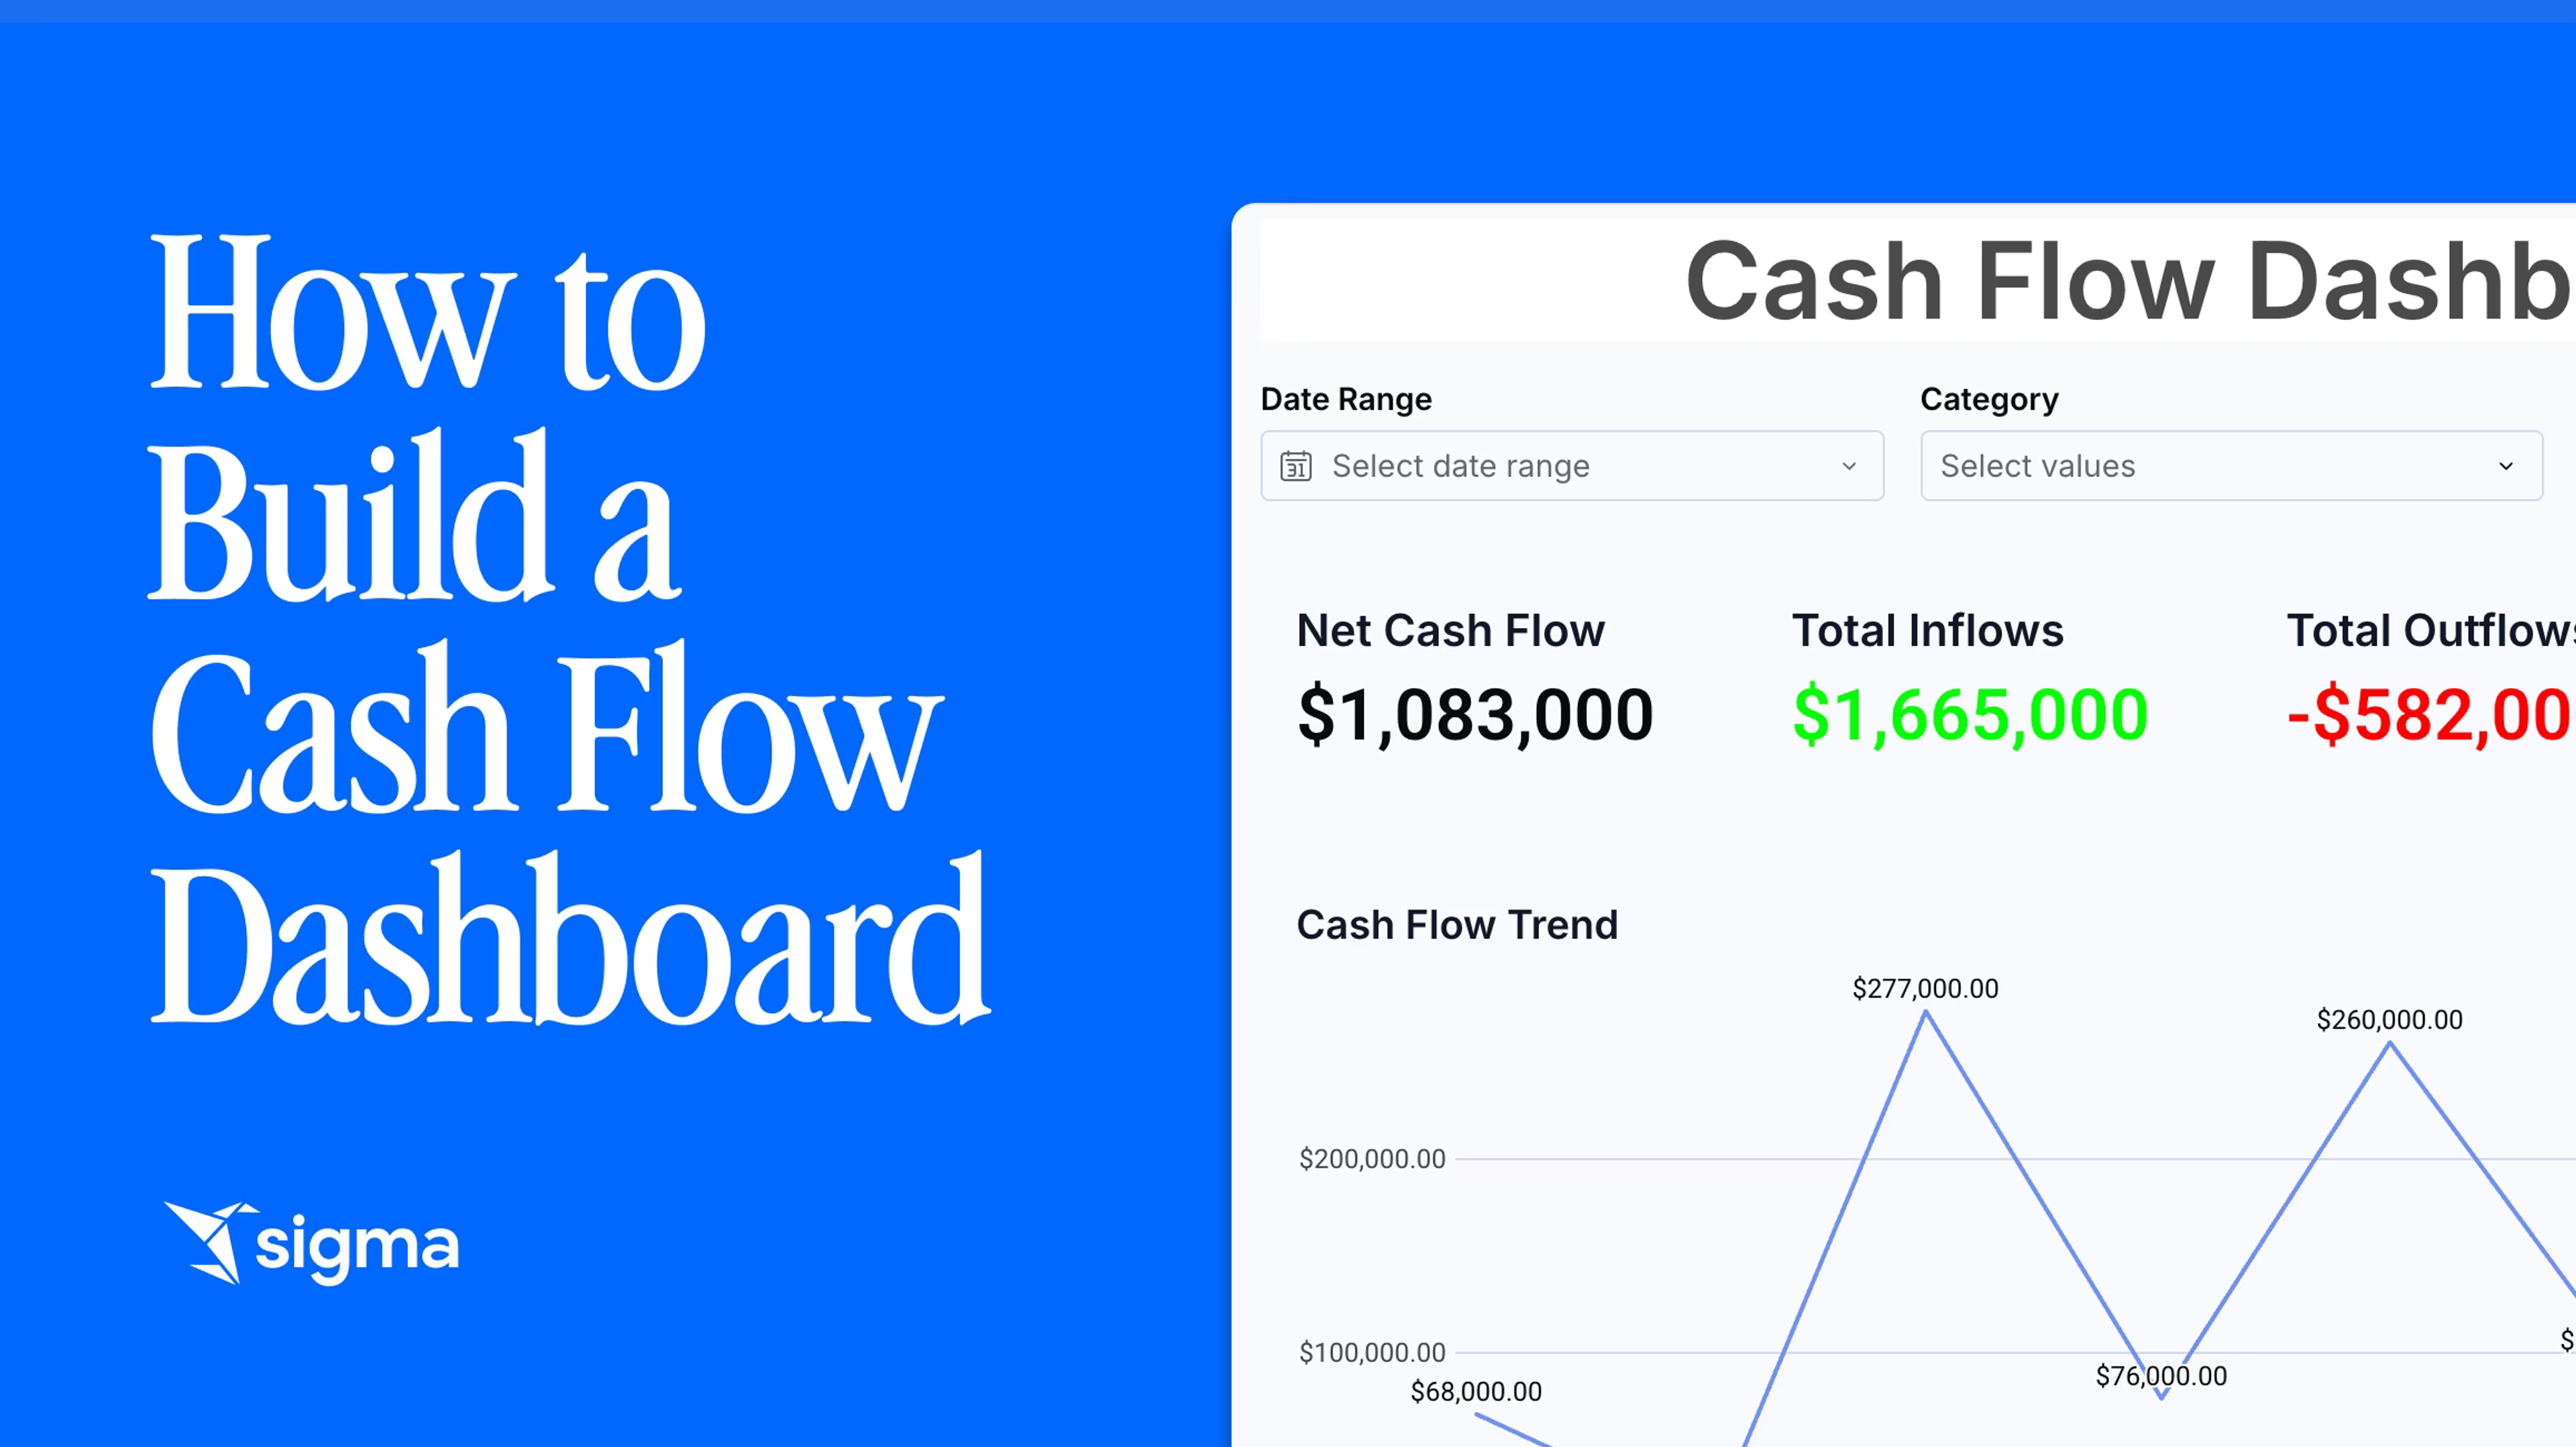
A cash flow dashboard answers a question every finance team fields on repeat: how much cash do we have, where is it going, and what will the balance look like next week, next month, or next quarter?
The raw data to answer that question already exists, but it’s scattered across bank exports, an accounting system, and a two-week-old rolling forecast. Delivering the answer as a single number that leadership can act on means manually consolidating the numbers from those sources. By the time the answer is ready, the underlying data has changed, and the cash flow number no longer reflects where cash actually stands.
A well-built cash flow dashboard replaces that scramble with a single, current view.
Key takeaways
- A cash flow dashboard is only as reliable as the data feeding it, so connect bank feeds, the enterprise resource planning (ERP) system, accounts receivable (AR), accounts payable (AP), and payroll into a cloud data warehouse before building anything on top.
- Pick the forecasting method for the cash flow dashboard by horizon: the direct method for short-term liquidity and the indirect method for longer-range planning.
- Design the cash flow dashboard for upkeep, not just launch, because new data sources, drifting formulas, and spreadsheet governance quietly erode accuracy within months of the initial build.
What is a cash flow dashboard?
A cash flow dashboard is a live view of cash inflows, outflows, and projected balances that gives finance teams and leadership a single, up-to-date answer on where the business stands with cash. It consolidates the liquidity position, forecast versus actuals, and forward projections so decisions run on current numbers rather than last week’s export.
A cash flow dashboard usually contains four components:
- Actual cash position is the current, consolidated cash level across all accounts, ideally normalized to a single reporting currency.
- Cash inflows include customer payments, interest income, investment returns, and loan proceeds.
- Cash outflows include payroll, supplier payments, debt service, and taxes.
- Forward projections estimate inflows and outflows over a future period, allowing the team to anticipate what happens next.
Everything else in the dashboard, from KPIs to scenario overlays, extends from the foundation of these four components.
Prerequisites for building a cash flow dashboard
Building a cash flow dashboard starts with the data sources that feed it. Each of the following has to be in place before the build begins, because weaknesses at this stage compound downstream:
- Connected data sources. A complete cash flow dashboard pulls from banking platforms, the ERP or general ledger, AR, AP, and payroll. Banks show settled positions. The ERP holds booked activity. AR and AP show what is coming in and going out. Payroll is one of the largest recurring outflows in any period.
- A forecasting method. Many teams use the direct method for short-term forecasting because it works with actual receipts and payments and produces the day-by-day detail that treasury needs. The indirect method, which starts from net income and adjusts for non-cash items, tends to fit longer-range planning.
- A list of what the source systems won’t capture. Connected feeds only show cash that has already been transacted or booked, so anything that hasn’t entered a system yet has to be forecasted by hand. Before building, make a standing list of these manual items:
- Outflows with no purchase order. Anything not raised on a PO, like one-off vendor payments, contractor invoices, tax payments, legal settlements, or ad-hoc capital expenditures, never shows up as a committed cash outflow in the ERP or AP.
- Expected inflows that aren’t transactions yet. A planned drawdown on a credit line, a new loan or bond, an equity raise, or a large customer payment you’ve been promised. None of these exist in the bank feed or AR until they land.
- Timing the systems don’t know. A booked invoice tells you the amount, not the day cash will actually move. Payment-timing assumptions are a manual input.
Writeback is what makes this work: these manual items live alongside the system data, governed and auditable, not in a stray spreadsheet.
- Clear ownership. Someone has to own the model: updating the dashboard, reconciling actuals, refreshing assumptions, and making the call when a source system changes. In large enterprises, treasury typically owns liquidity management, while capital decisions are made cross-functionally and led by the CFO.
With those four in place, every downstream question has a single point of accountability, and the build can proceed without waiting on data that never showed up.
How to build a cash flow dashboard step by step
Building a cash flow dashboard follows a sequence: connect, structure, model, visualize, and validate. Each step has judgment calls that shape how useful the finished dashboard is.
1. Connect and centralize the cash data sources
Start by bringing bank feeds, the ERP, AR, AP, and payroll into one location. Removing the manual download-reformat-upload cycle eliminates the stale data introduced at the aggregation step and the fragility the dashboard is meant to prevent.
In practice, connecting and centralizing data sources usually means loading each source into a cloud data warehouse on a scheduled cadence, so downstream tools can query a single reconciled dataset instead of chasing exports across systems.
Manual data collection is still common at scale. Among large companies, 38% of those with revenue above $10 billion and 52% of those with revenue between $1 billion and $10 billion still manually collect and consolidate forecasting data.
Automated integration reduces reconciliation errors by eliminating repeated handoffs and allowing treasury to focus on strategic work. Where direct integration isn’t available, standard formats such as BAI2 or MT940 for bank data provide the pipeline with a stable structure to build against.
2. Structure the cash flow model
Organize transactions into three activity types: operating, investing, and financing. Then track five structural elements for each period:
- Beginning cash balance
- Cash inflows
- Cash outflows
- Net cash flow
- Ending cash balance.
The identity every period must satisfy is: Beginning cash + Inflows − Outflows = Ending cash.
The ending balance in each period must tie back to the cash account on the balance sheet. If it doesn’t reconcile, the model is broken before it has produced a single projection.
A workable layout keeps time across the columns and categories down the rows, grouped by operating, investing, and financing activity. The ending balance rolls forward to become the next period’s beginning balance, so a break in the sequence is easy to spot.
Keep assumptions in a dedicated inputs section and avoid hard-coding forecast values. Explicit drivers should drive everything to the right of historical results. That separation makes the model auditable later, when someone asks why a forecast changed.
3. Choose your forecasting method and horizon
The forecasting method must match the forecasting horizon and the decision the dashboard supports. The direct method records actual receipts and payments and is well-suited to short-term cash forecasting, because the model needs receipt and payment timing at a granular level. The indirect method starts with net income and adjusts for non-cash items, which suits longer-term projections driven by operating performance and working capital.
A 13-week rolling direct forecast is a common short-term structure: it gives the team a near-term view that updates weekly, so the horizon never drifts more than a week behind. Longer horizons, such as a quarterly or annual forecast, usually pair the indirect method with driver-based assumptions for revenue, margins, and working capital days.
Many finance teams run both the direct and indirect forecasts in parallel. If the dashboard has to answer both, decide upfront how the two reconcile at the end of each period, so the reader isn’t left comparing numbers built on incompatible assumptions.
4. Build the visualization layer
Present balances, trends, and runway in a way the reader can act on. Start with a focused set of KPIs relevant to your business model and expand as tracking matures. A crowded dashboard obscures the signal. A strong core includes the current cash balance, net cash flow, burn rate, cash runway, and forecast-versus-actuals variance.
Match data visualizations to the question each answers. Line charts show cash balance and burn rate over time. A waterfall chart shows how each category moved the balance from one period to the next. A forecast-versus-actuals overlay presents variance at a glance. KPI cards place runway and current cash at the top of the view.
Threshold alerts close the loop: get pinged if cash drops below the minimum runway threshold you set, or if a major receivable becomes overdue. The finished layer should let a reader answer the three most common questions (where are we, where are we going, and where is the risk) without scrolling.
5. Set a refresh and validation process
Match refresh cadence to the horizon. Cash positioning runs daily, the near-term rolling forecast updates weekly, and FP&A models refresh during period-end close. Each cadence needs a named owner and a defined checklist, so the refresh doesn’t become dependent on one person’s memory.
Each cycle also needs validation. A useful checklist to run at every refresh covers:
- Bank balance tie-out: the forecast opening balance matches the actual bank balance across every account and currency.
- Prior-period roll-forward: last period’s ending balance is this period’s beginning balance, with no unexplained deltas.
- AR and AP aging: aging buckets reconcile to the ERP subledgers, and large or overdue items are flagged.
- FX rates: multi-currency positions use the current period’s rates, and rate changes are documented.
- Trial balance reconciliation: consolidated cash ties to the cash account on the balance sheet in the general ledger.
- Variance thresholds: line items outside the variance threshold you set (for example, ±10% versus forecast) are investigated before publishing.
A forecast that can’t be reconciled with a verified cash position quickly loses credibility with treasury leadership, and rebuilding that credibility takes far longer than preventing the drift in the first place.
Best practices for a reliable cash flow dashboard
Building the cash flow dashboard is the easy part. Keeping it accurate is where most teams lose ground, because accuracy starts to decay the moment manual upkeep slips:
- New data sources keep arriving. New banks, entities, and billing systems require reworking connections and mappings tuned to the earlier configuration.
- Calculation methods drift. Revenue definitions change, working capital assumptions get refined, and one-time items become recurring, until forecasts no longer tie back to the financial statements.
- Short-term forecasts demand constant refresh. Weekly updates still require manual reconciliation when receivables, payables, and payroll sit in disconnected systems.
- Spreadsheet governance splinters. Files get copied, emailed, and renamed, and the version of truth quietly fragments across inboxes.
The practices below counter those forces and keep the dashboard trustworthy well after the first release.
- Reconcile actuals against the accounting system on a fixed cadence, even when the numbers look normal. Review accounting journals and one-time entries first, since items that don’t reflect underlying business activity can distort forecast inputs.
- Keep assumptions separate from historical data so projections stay auditable. Group inputs in one section, color-code them distinctly from formulas, and document where each assumption comes from.
- Refresh assumptions as actuals diverge from the forecast. Collection rates, payment timing, and growth drivers quickly go stale. Update them on variance analysis at regular intervals, not only when the variance becomes uncomfortable.
- Limit who can edit the underlying model to prevent version conflicts. Operational spreadsheets need controls such as versioning, change tracking, and access control.
- Revisit the forecasting method as the business changes. An approach that worked at one growth stage may not hold at the next.
Taken together, these practices convert upkeep from a heroic monthly effort into a routine one. The cash flow dashboards that stay reliable over the long term treat reconciliation, assumption hygiene, access control, and source onboarding as standing habits rather than fire drills.
How Sigma supports building and maintaining a cash flow dashboard
For a cash flow dashboard to give leadership a current, trustworthy answer on where cash stands, it needs to stay tied to live, governed data from the moment it’s built through every subsequent refresh. That single requirement is what most builds fail to sustain.
In practice, cash data sits in a cloud data warehouse, but the dashboard lives in a spreadsheet or a legacy BI tool that has to be re-fed by hand. Every refresh, every new source, and every assumption change becomes manual work, and manual work is where accuracy, governance, and trust quietly erode. Closing that gap between where the data lives and where the dashboard runs is where Sigma fits in.
Sigma is the runtime layer to build and scale analytics, apps, and agents on live cloud data warehouse data. It sits between the warehouse and the tools querying it. The workbooks, dashboards, AI Apps, and agents finance teams build inherit the warehouse’s existing governance from the moment they are built.
Live queries on warehouse data
Sigma queries the warehouse directly. Formulas, filters, pivot tables, and sorts compile to SQL and execute inside the connected warehouse, with no download-reformat-upload cycle in between. Sigma runs live against cloud data warehouses such as Amazon Redshift, BigQuery, Databricks, and Snowflake, so the cash position reflects the latest reconciled data every time the dashboard is opened.
New bank accounts, entities, and subsidiaries flow into the dashboard once they are loaded, mapped, and governed in the warehouse, without rebuilding export-based aggregation steps.
Writeback for assumptions and forecasts through Input Tables
A cash flow model is only as good as the assumptions behind it, and those assumptions must be editable without breaking the model. Through Input Tables, a finance user edits collection rates, discount scenarios, or payment timing directly in a familiar spreadsheet grid. The change is written back to the warehouse with a record-level audit trail that covers the original record, the new record, who changed it, and when. Adjusting a scenario means editing a cell while the formula dependencies and downstream calculations stay intact.
AI for variance analysis and forecast narratives
Sigma’s AI features run on the customer’s warehouse compute, inherit row-level security and column masking, and produce traceable outputs. Three surfaces are available to finance on the cash flow dashboard:
- Sigma Assistant answers plain-language questions about cash position, variance, and trend, with every answer verifiable back to the underlying table.
- AI Column brings LLM calls into the spreadsheet grid, so a builder can generate variance commentary or parse an uploaded bank statement inside the model.
- Sigma Agents are configured within a workbook context after a builder defines the goal, instructions, and allowed actions. They run recurring finance workflows such as diagnosing a variance, summarizing what changed overnight, or routing a threshold breach to the treasurer.
One shared workspace instead of scattered spreadsheets
A shared workspace keeps the whole finance team on a single, up-to-date version of the model. Everyone works from the same workbook against the same warehouse data, instead of spreadsheet copies emailed between treasury, FP&A, and the CFO’s office. Row-level security is inherited from the warehouse at query time, so each user sees only what they are entitled to. A regional controller sees their region, group treasury sees the consolidated view, and permissions are set once at the source rather than reconciled across files.
Build your cash flow dashboard on Sigma
The path from a cash flow question to a confident, current answer should run entirely on live, governed data, with no stale exports, no reconciled-by-hand spreadsheets, and no version-of-truth debates in between.
Sigma is the warehouse-native platform that makes that path possible: live queries against your cloud data warehouse, writeback for assumptions and scenarios through Input Tables, governed AI running on the same warehouse compute, and one shared workspace for the whole finance team.
Get a Sigma demo or try Sigma free to build a cash flow dashboard that stays connected to live warehouse data.