Visualize Location Data with Sigma Maps

Geographic data can tell a powerful story. Whether analyzing regional trends or plotting sites, maps are packed with insights generated from your location data. With Sigma, you can create interactive maps using latitude and longitude, or map paths and areas utilizing geoJSON.
Sigma Maps help contextualize geospatial information and provide greater understanding when analyzing data. Read on to see how customers use Sigma to share geographical insights and get a quick rundown on how to make your first map.
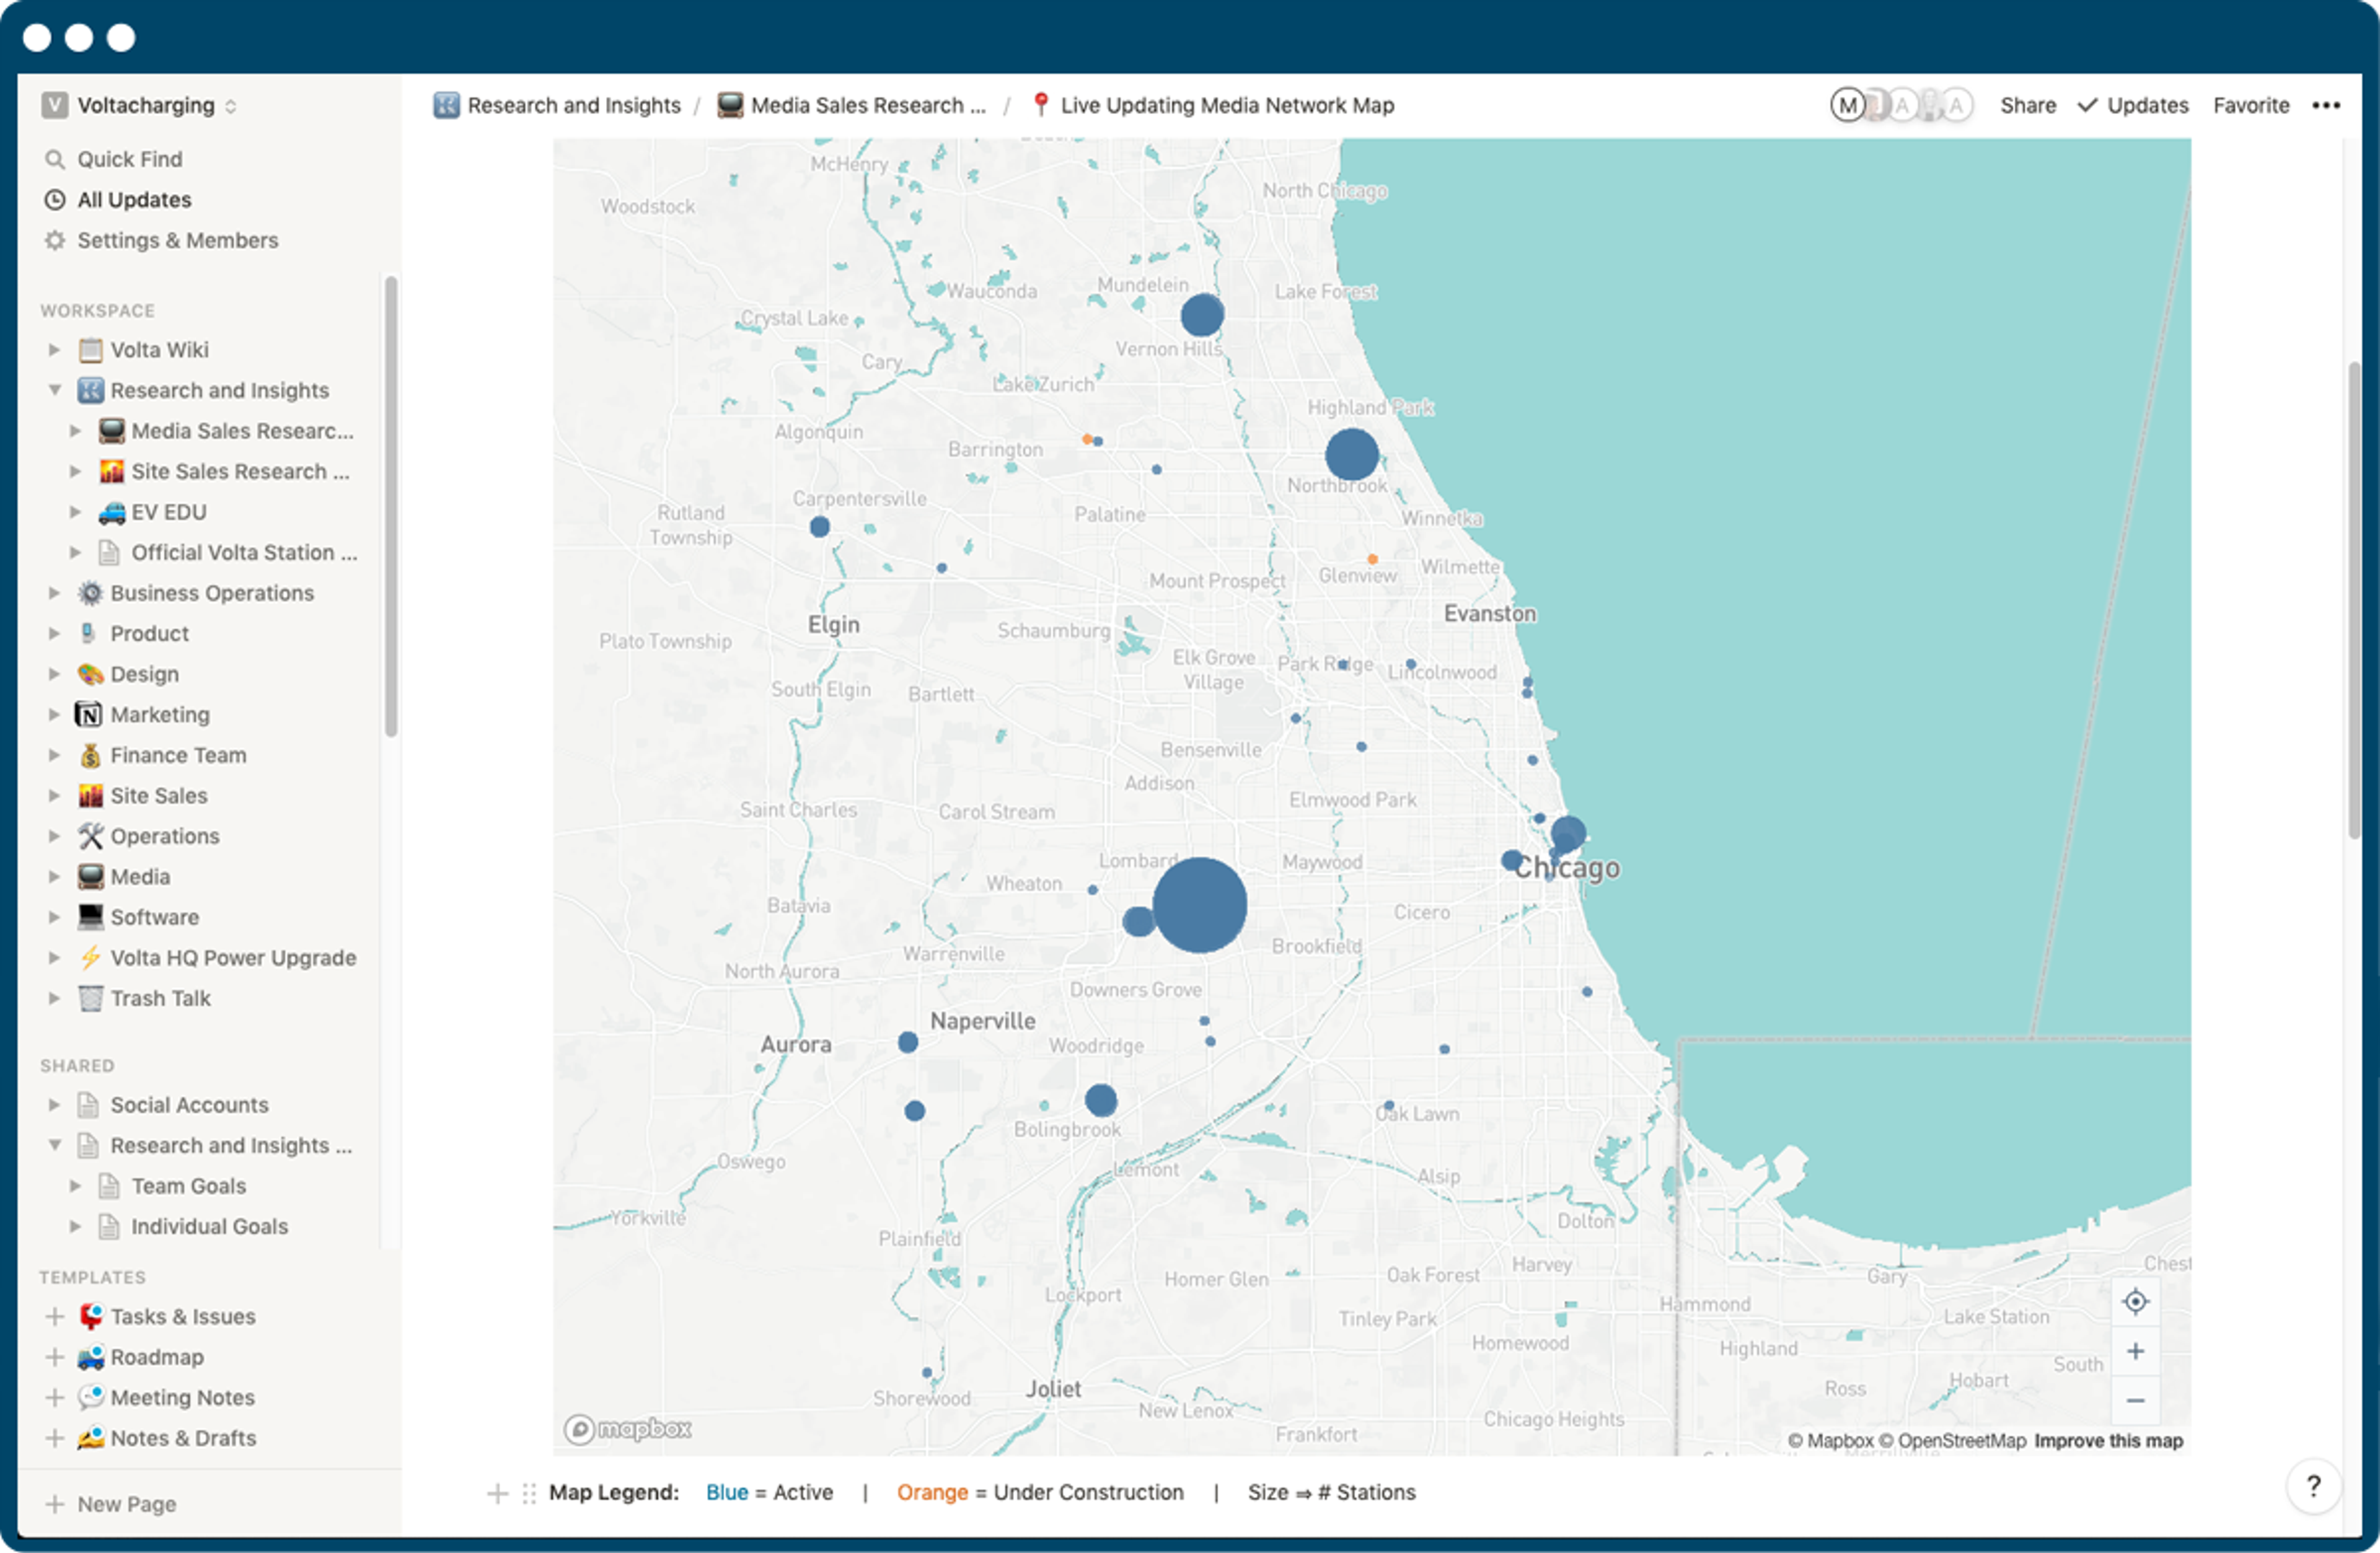
Mapping Charging Stations Across the US
Volta Charging uses Sigma to map their charging locations across the US. By adjusting the size of location points, they can quickly see which charging stations and regions are the most popular with customers, and which stations are active vs under construction. These maps are then embedded in their internal wiki for easy access, and custom styling is applied to match existing maps from other applications.
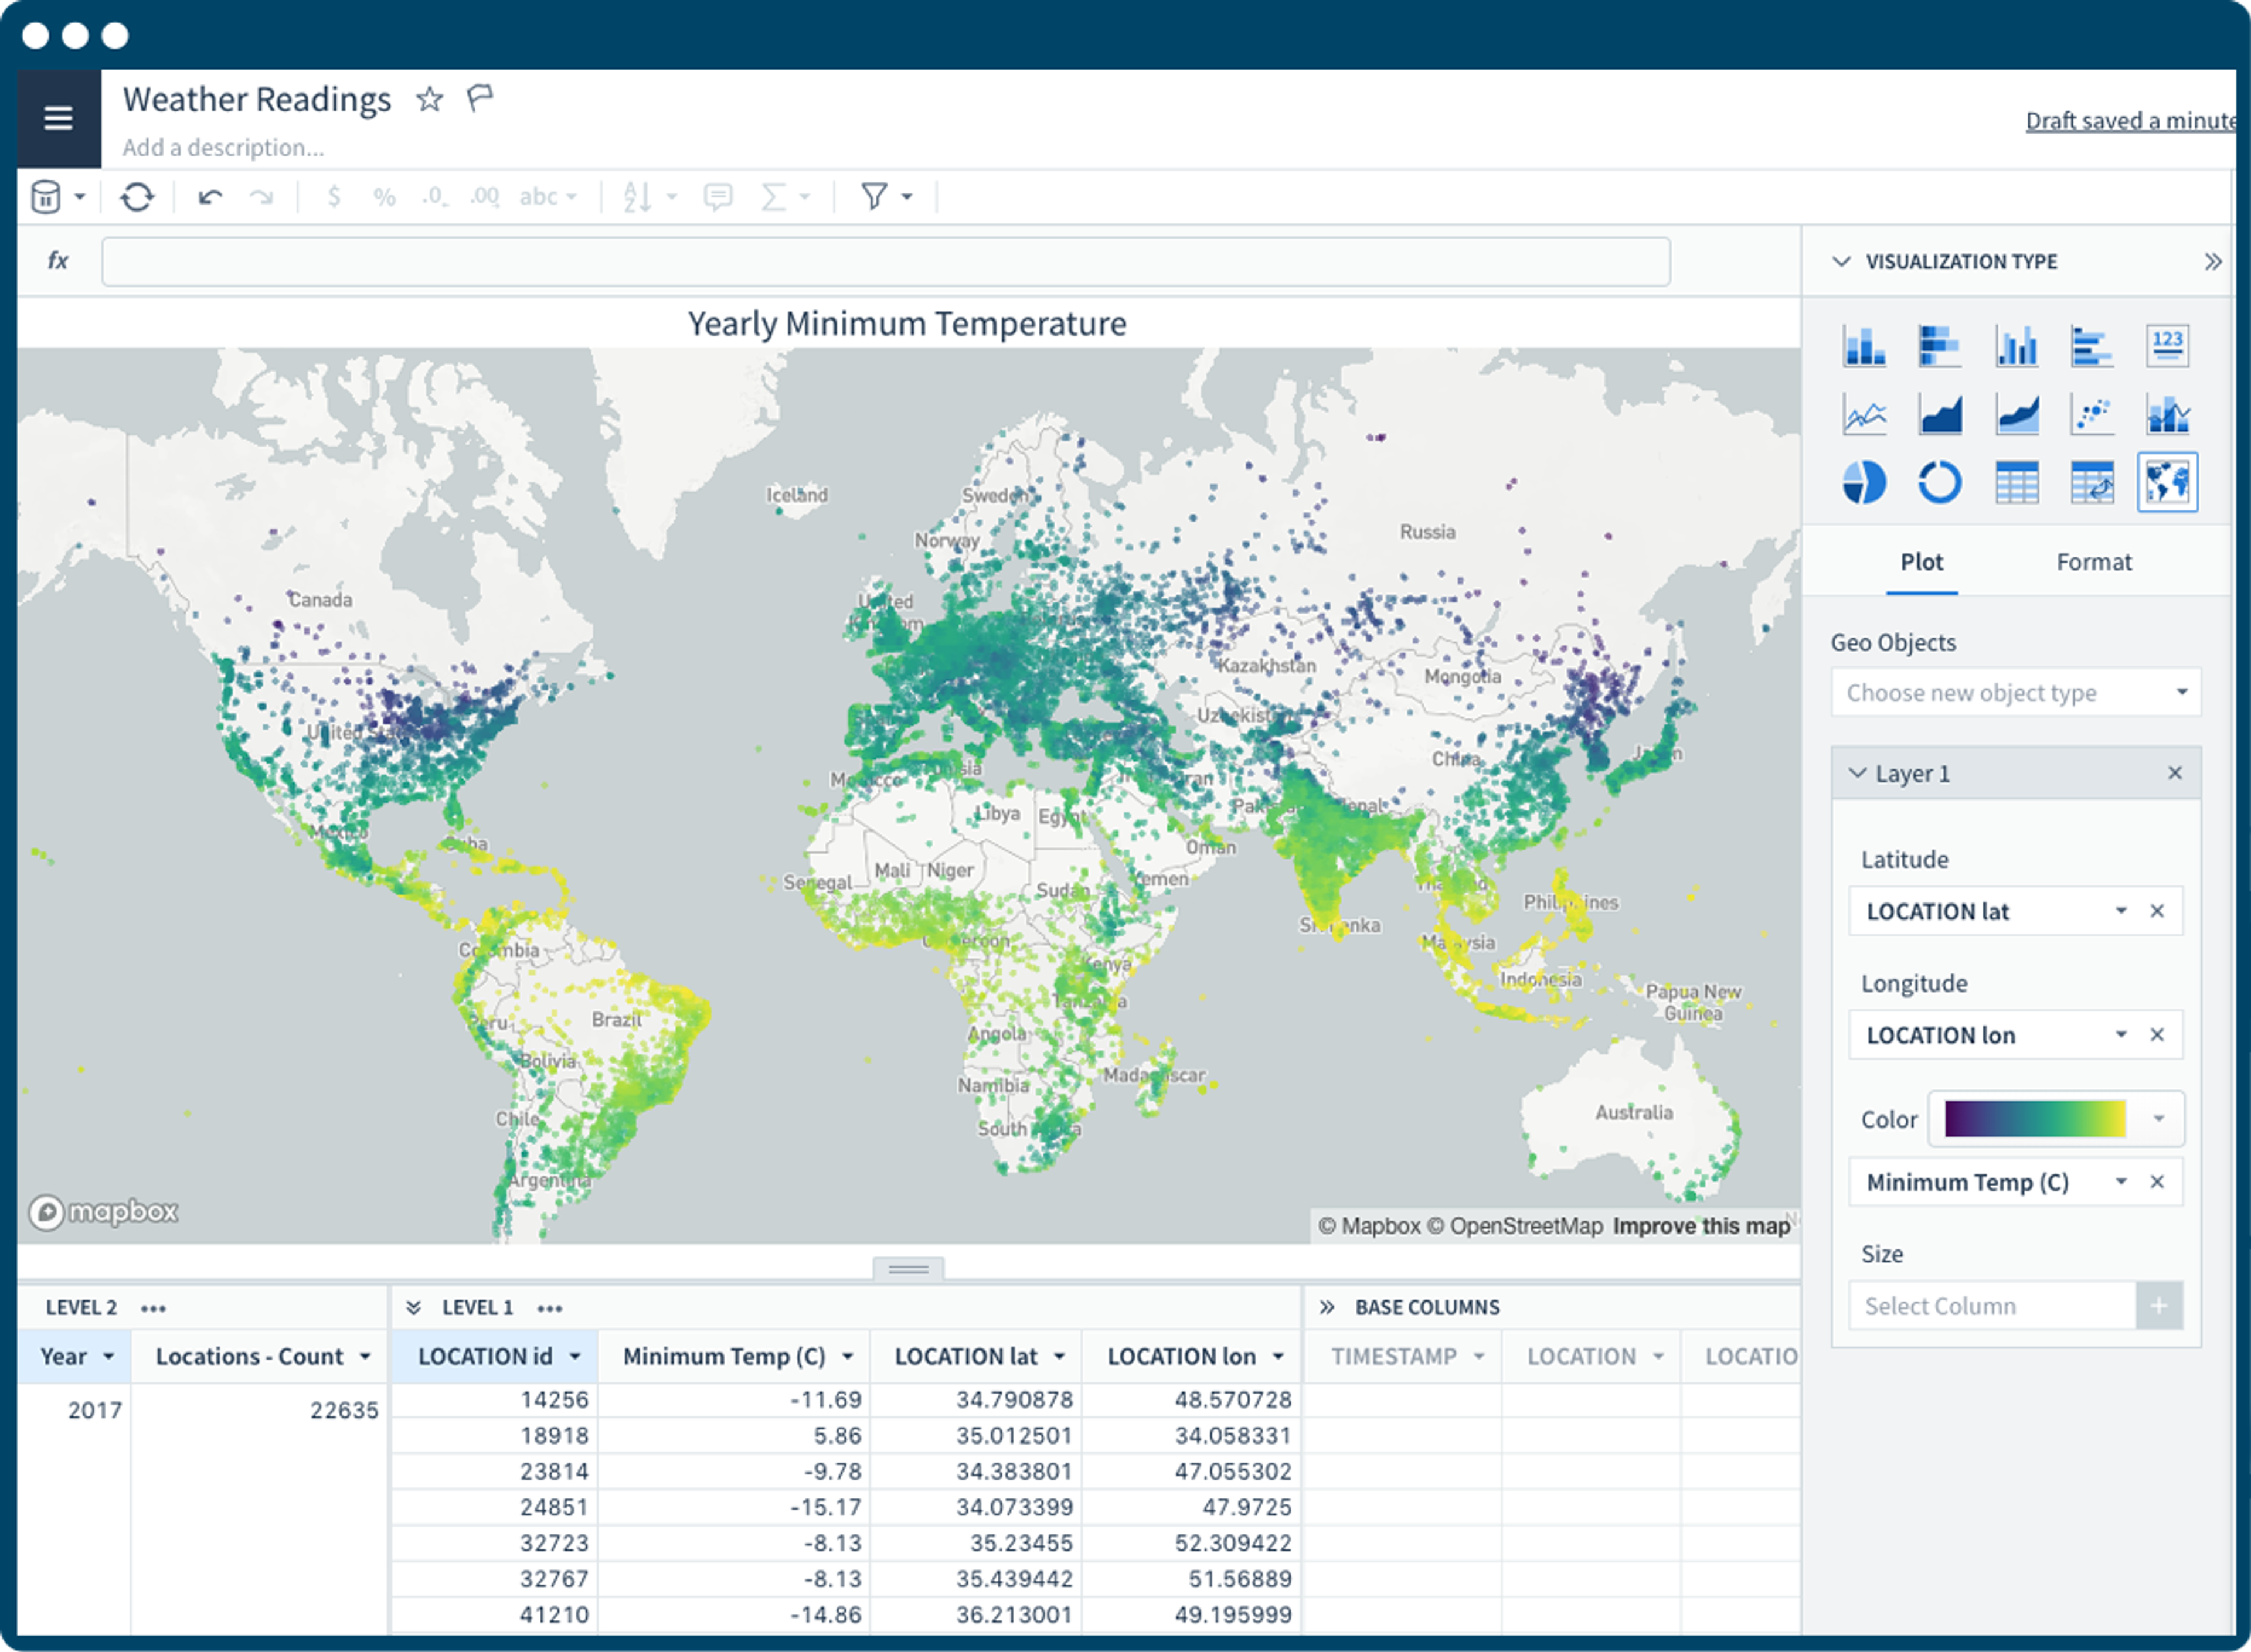
Visualizing Worldwide Temperatures
Using annual temperature data from cities around the world, it’s easy to visualize minimum temperatures and better understand weather patterns. By coloring the points by average temperature, you can see the temperature range with a quick glance.
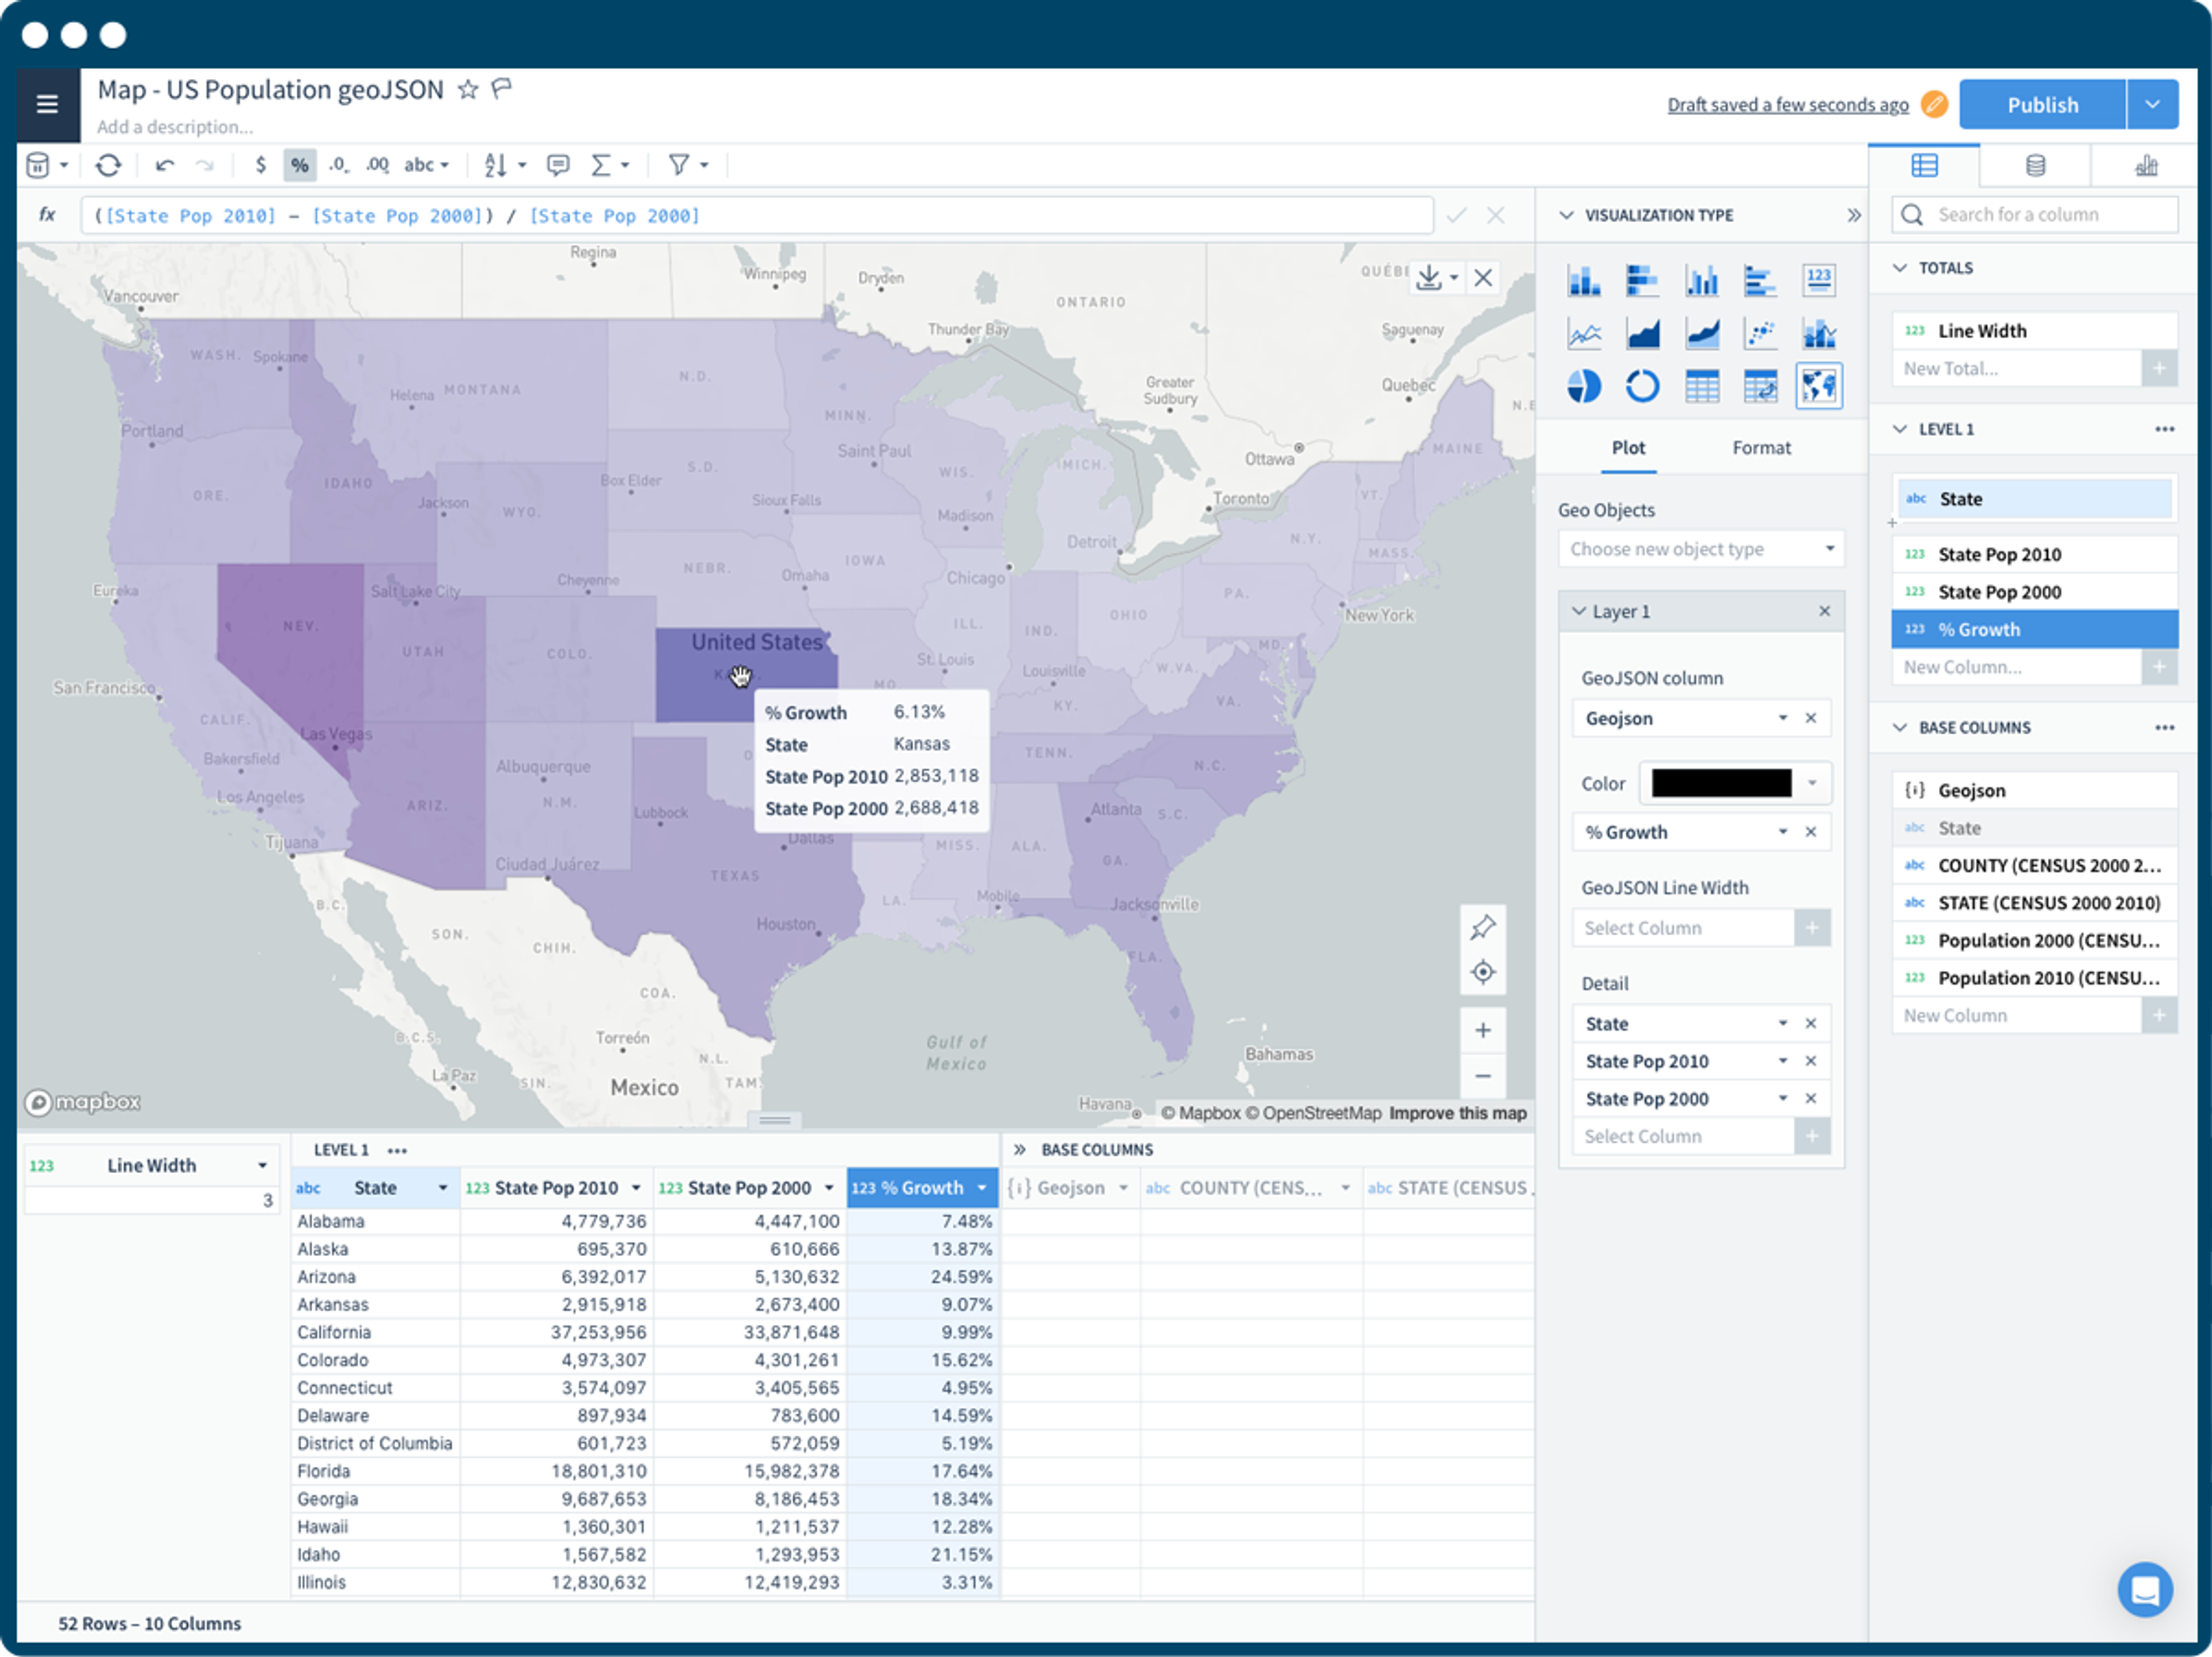
Comparing US Population Growth by State
Combining US Census data with geoJSON state outlines, it’s easy to compare population growth by state. Additional information in the detail field provides more information about the individual states.
Start Making Maps
Creating a map in Sigma is as simple as generating any other chart or visualization. Once your map is created, you can further customize the map styles, add additional field details, color and size points, and pin the default view.
Learn more by reading our documentation.


