Technical Series: Streamlining GeoJSON Integration into Sigma
Introduction
Have you ever found yourself tangled in lines of Python code, attempting to parse a GeoJSON file, only to end up with a headache and wasted hours? Well, you're not alone. In my recent project, I discovered a quicker, less painful method to handle GeoJSON files for use in Sigma. Let me guide you through a hassle-free process that might just save your day.
Step-by-Step Guide
Step 1: Starting with the Right GeoJSON File
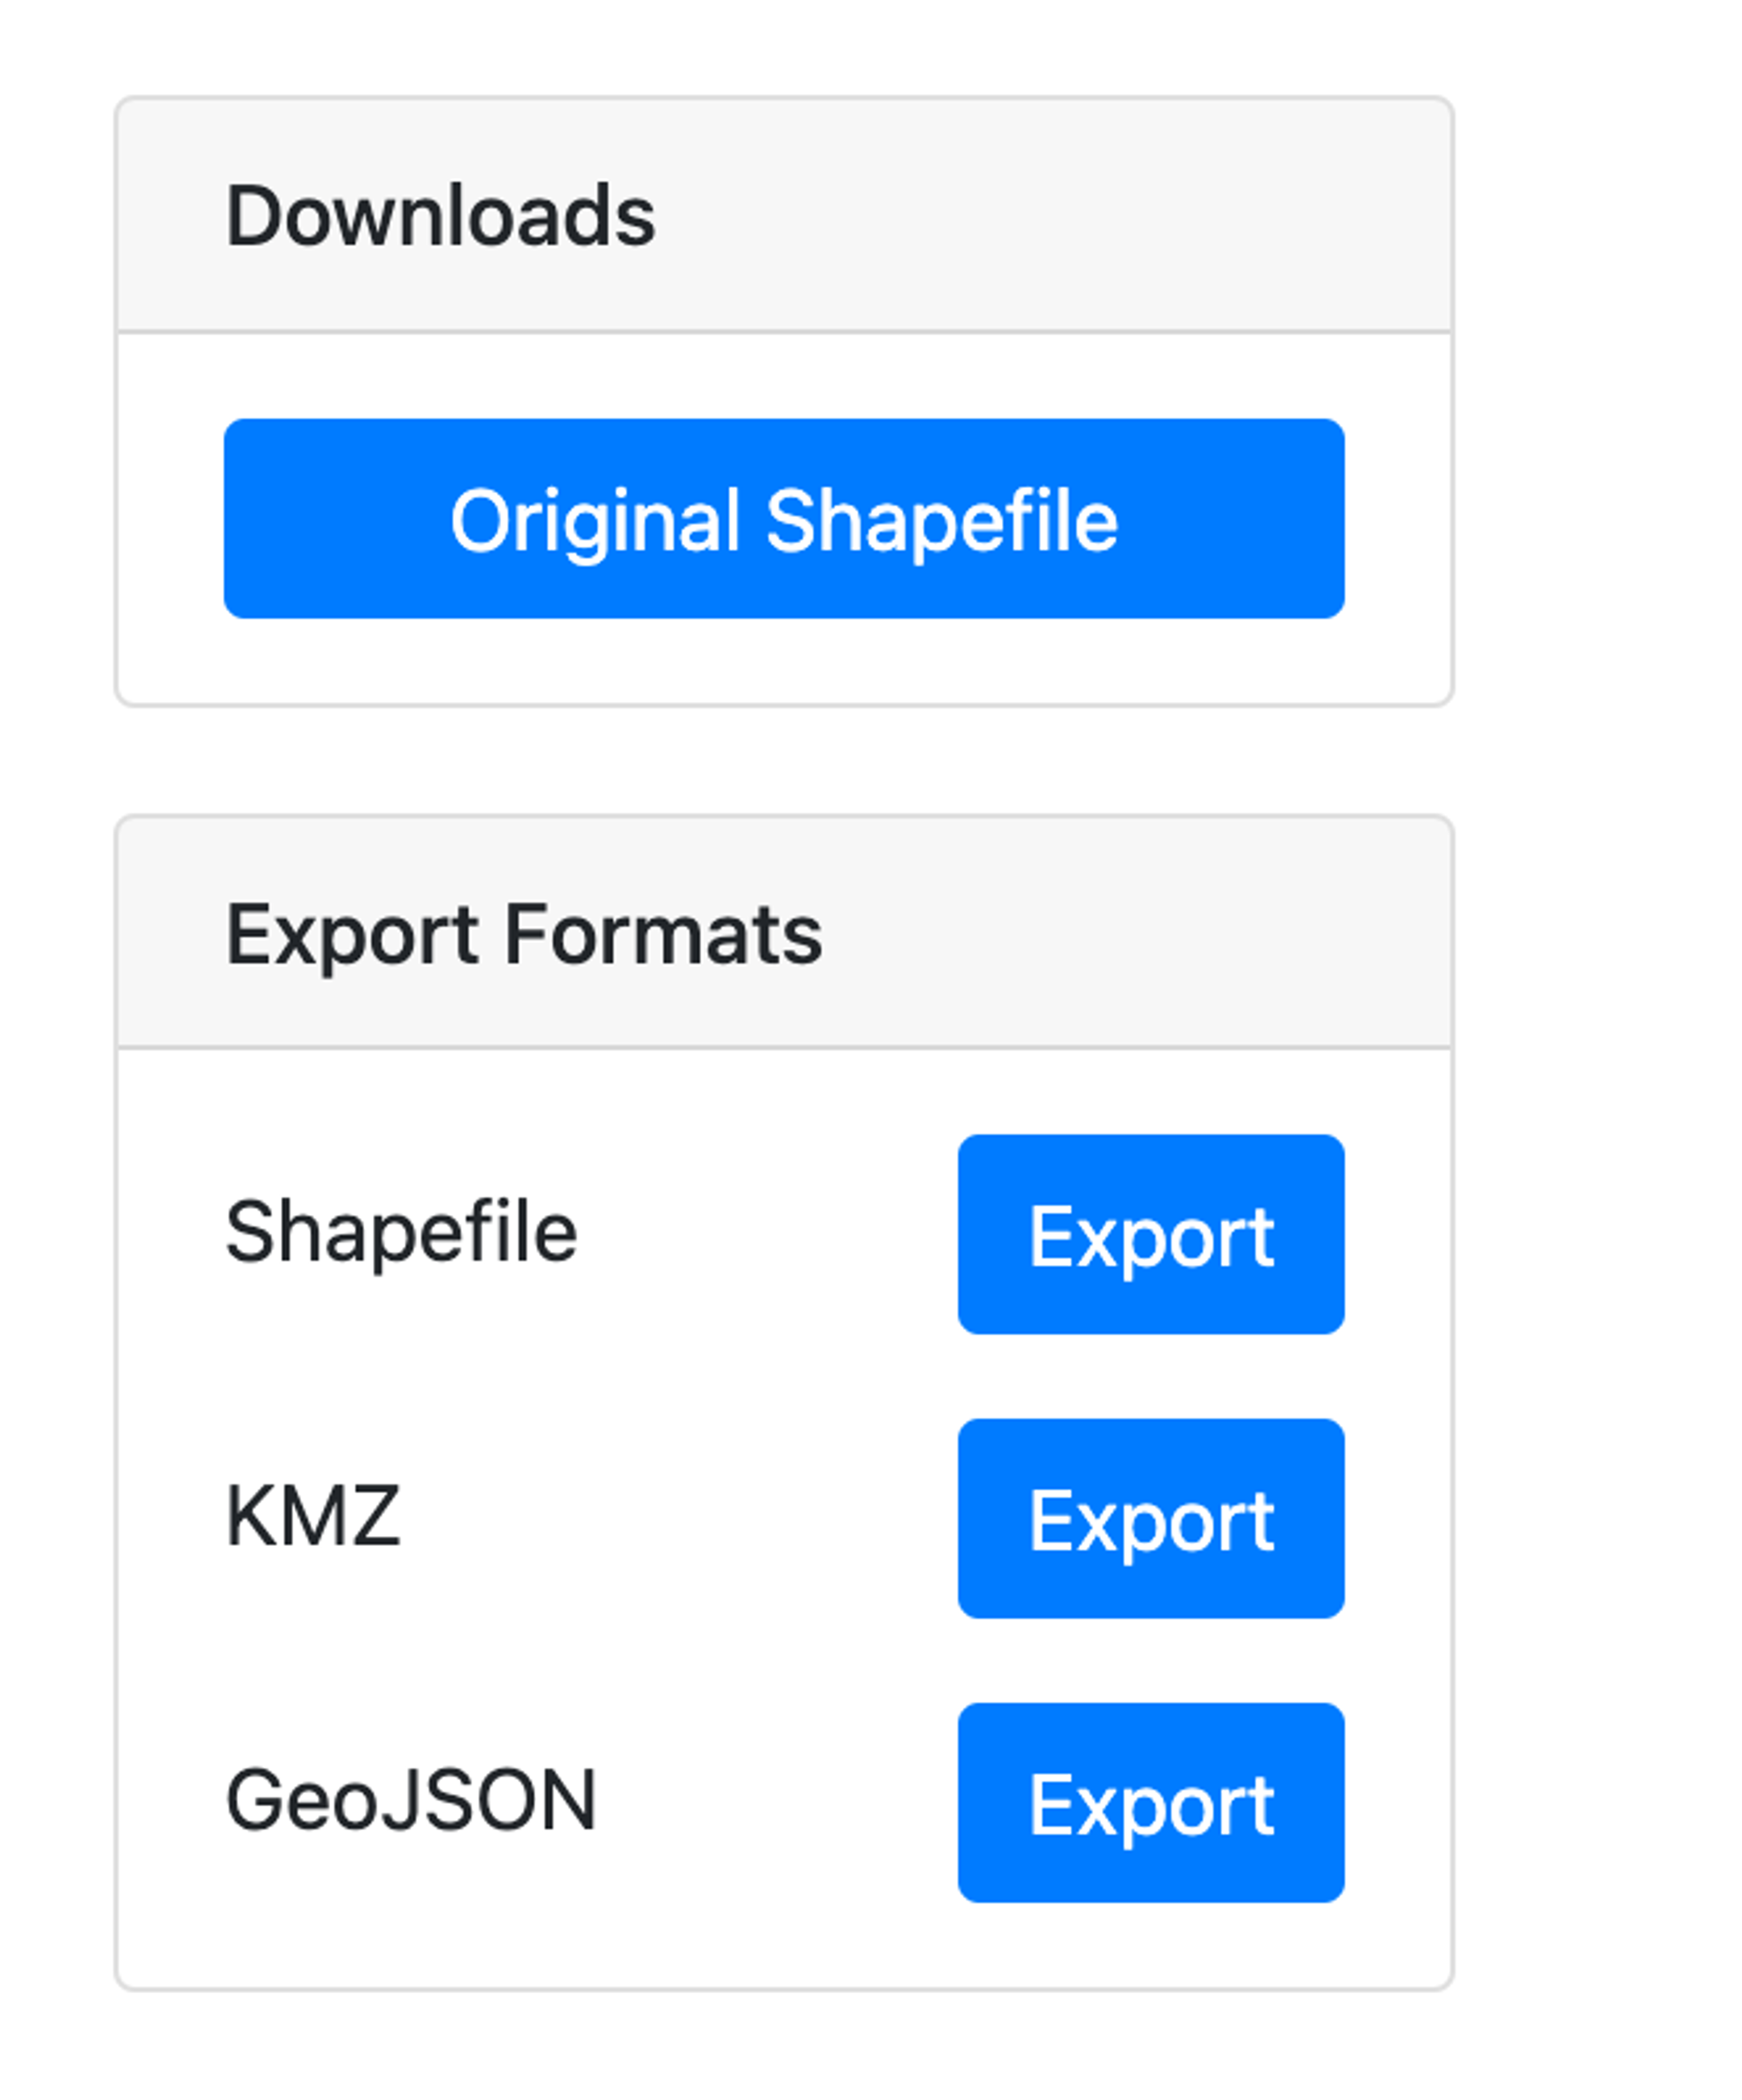
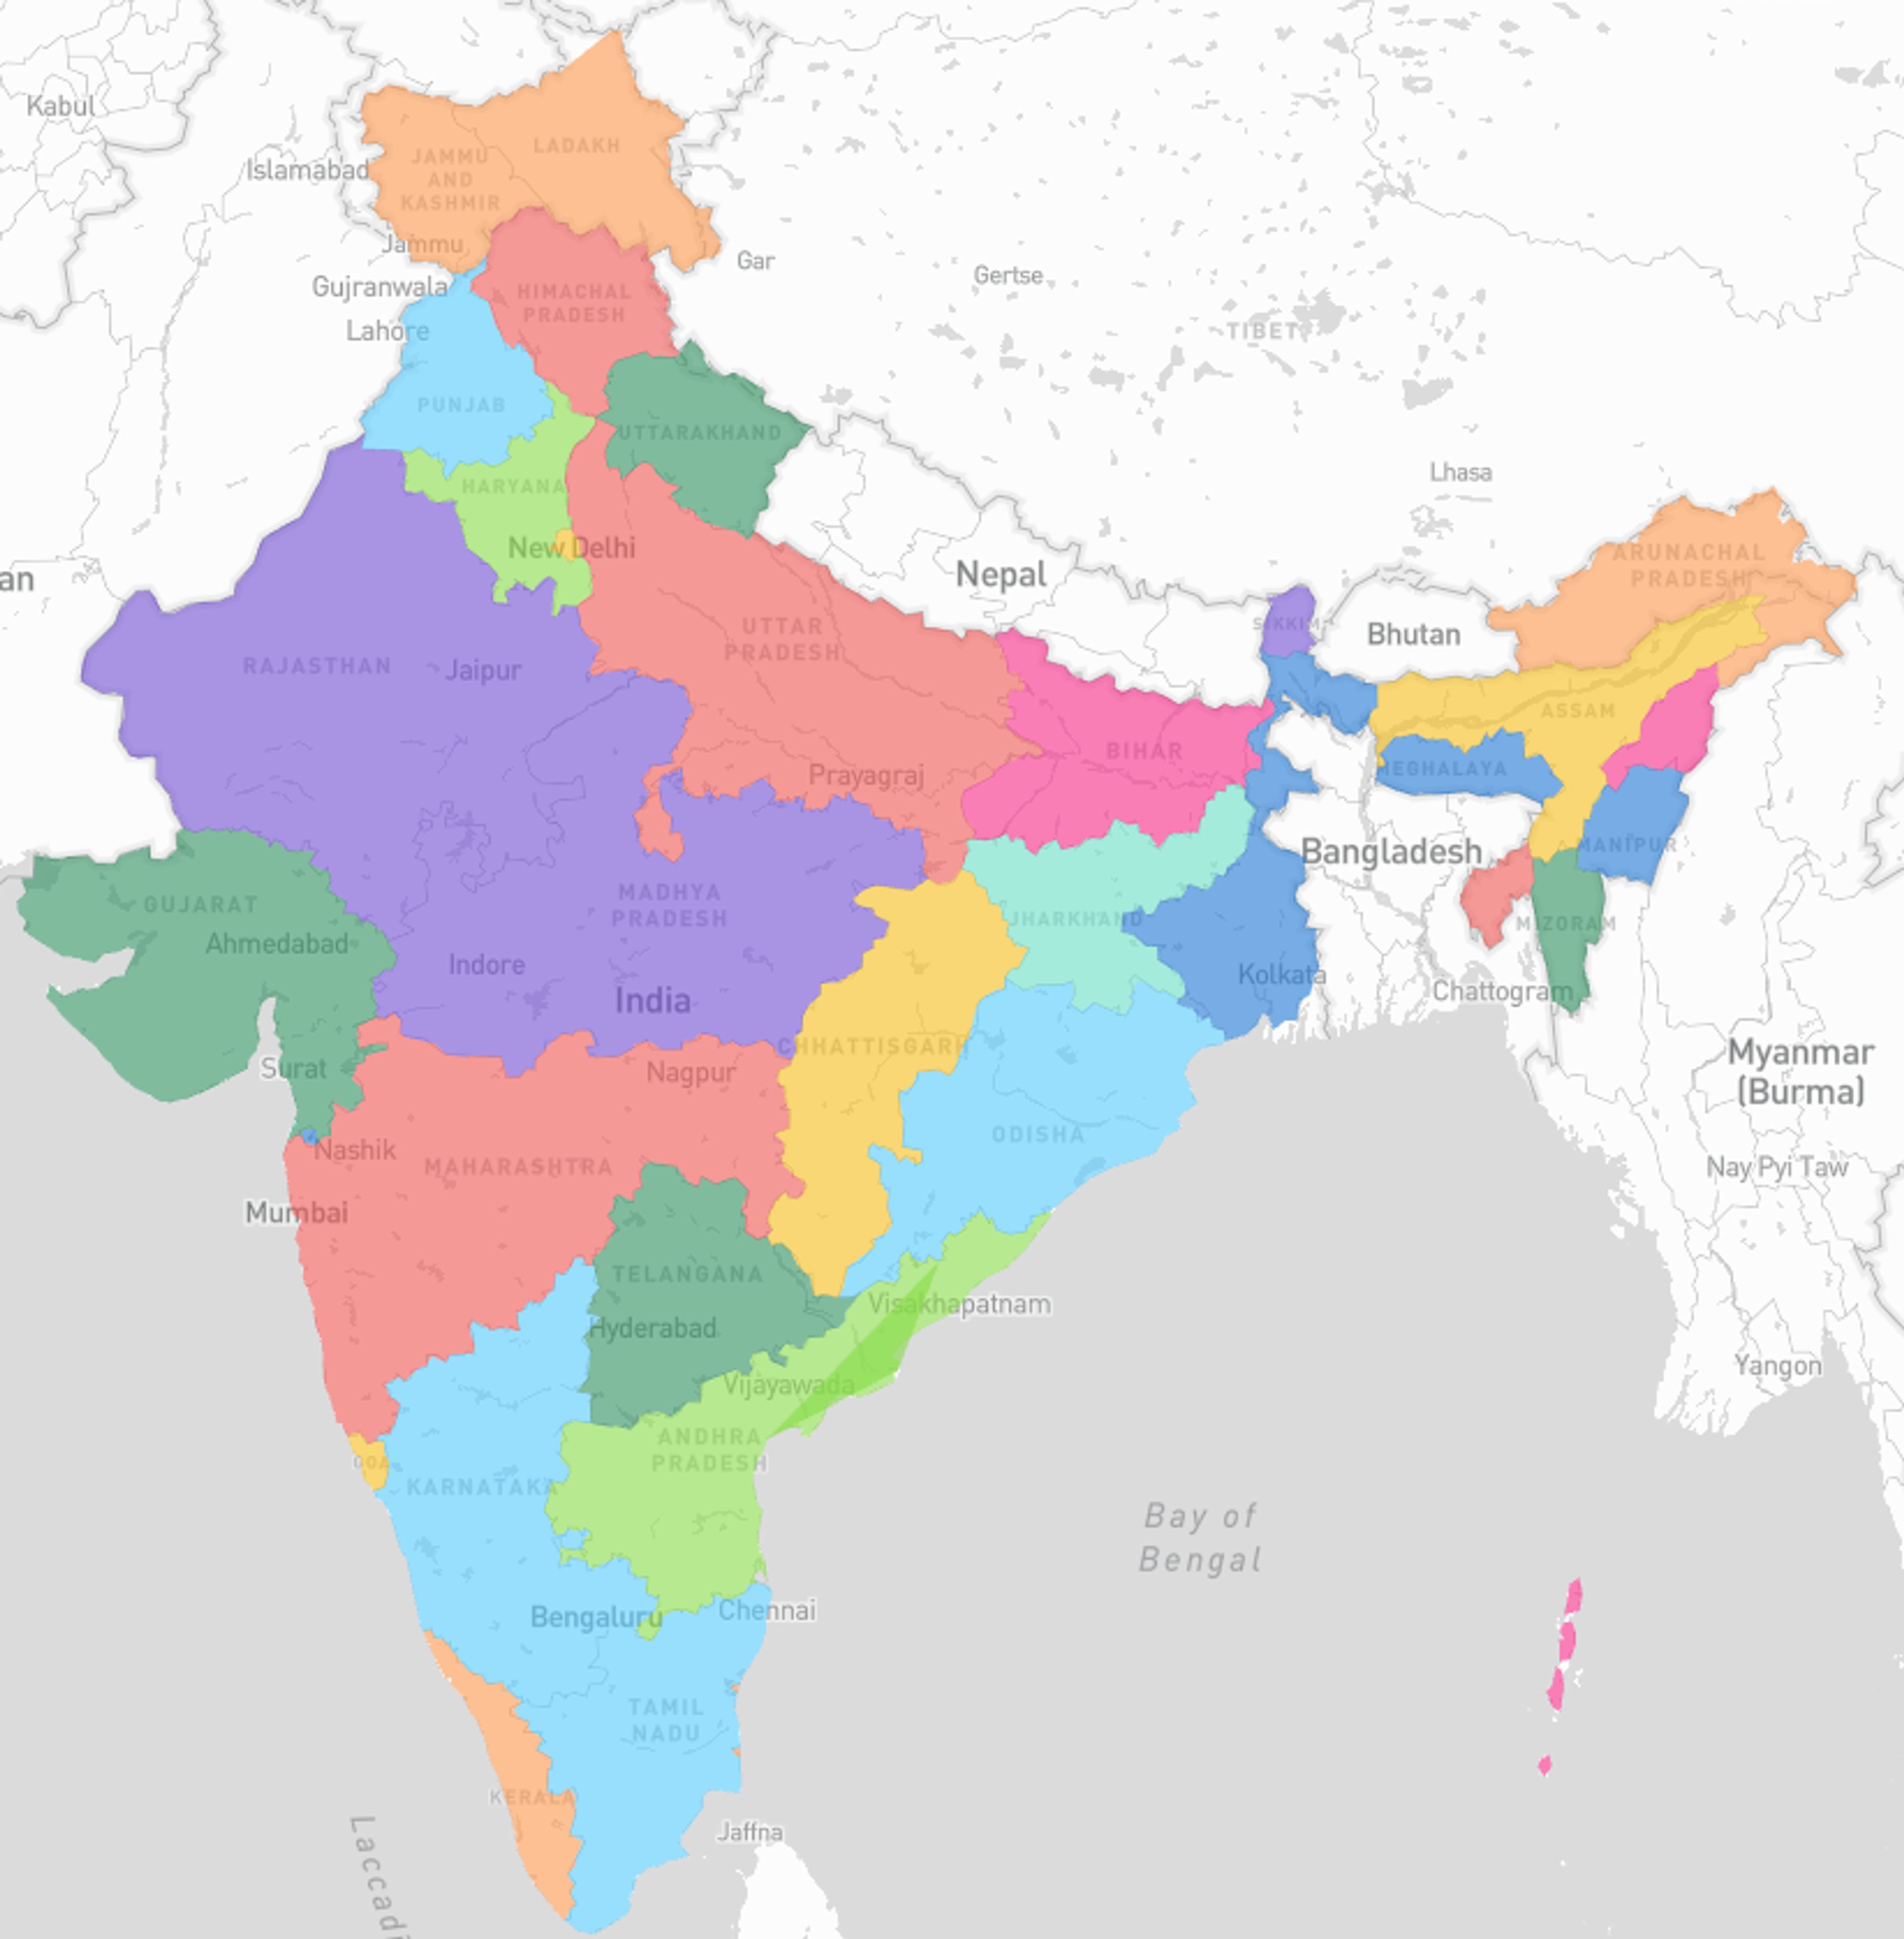
Begin your journey by selecting a quality GeoJSON file. For instance, if you need administrative divisions of India, the University of Texas Libraries GeoData is an excellent source. You’ll want to download the GeoJSON file by hitting Export.
Next, head over to MapShaper. It's a user-friendly public web tool where you can upload your GeoJSON or shapefiles directly. Click import and you'll get a neat preview of how your data looks mapped out.
Step 3: Optimizing Your Shapefiles (Optional)
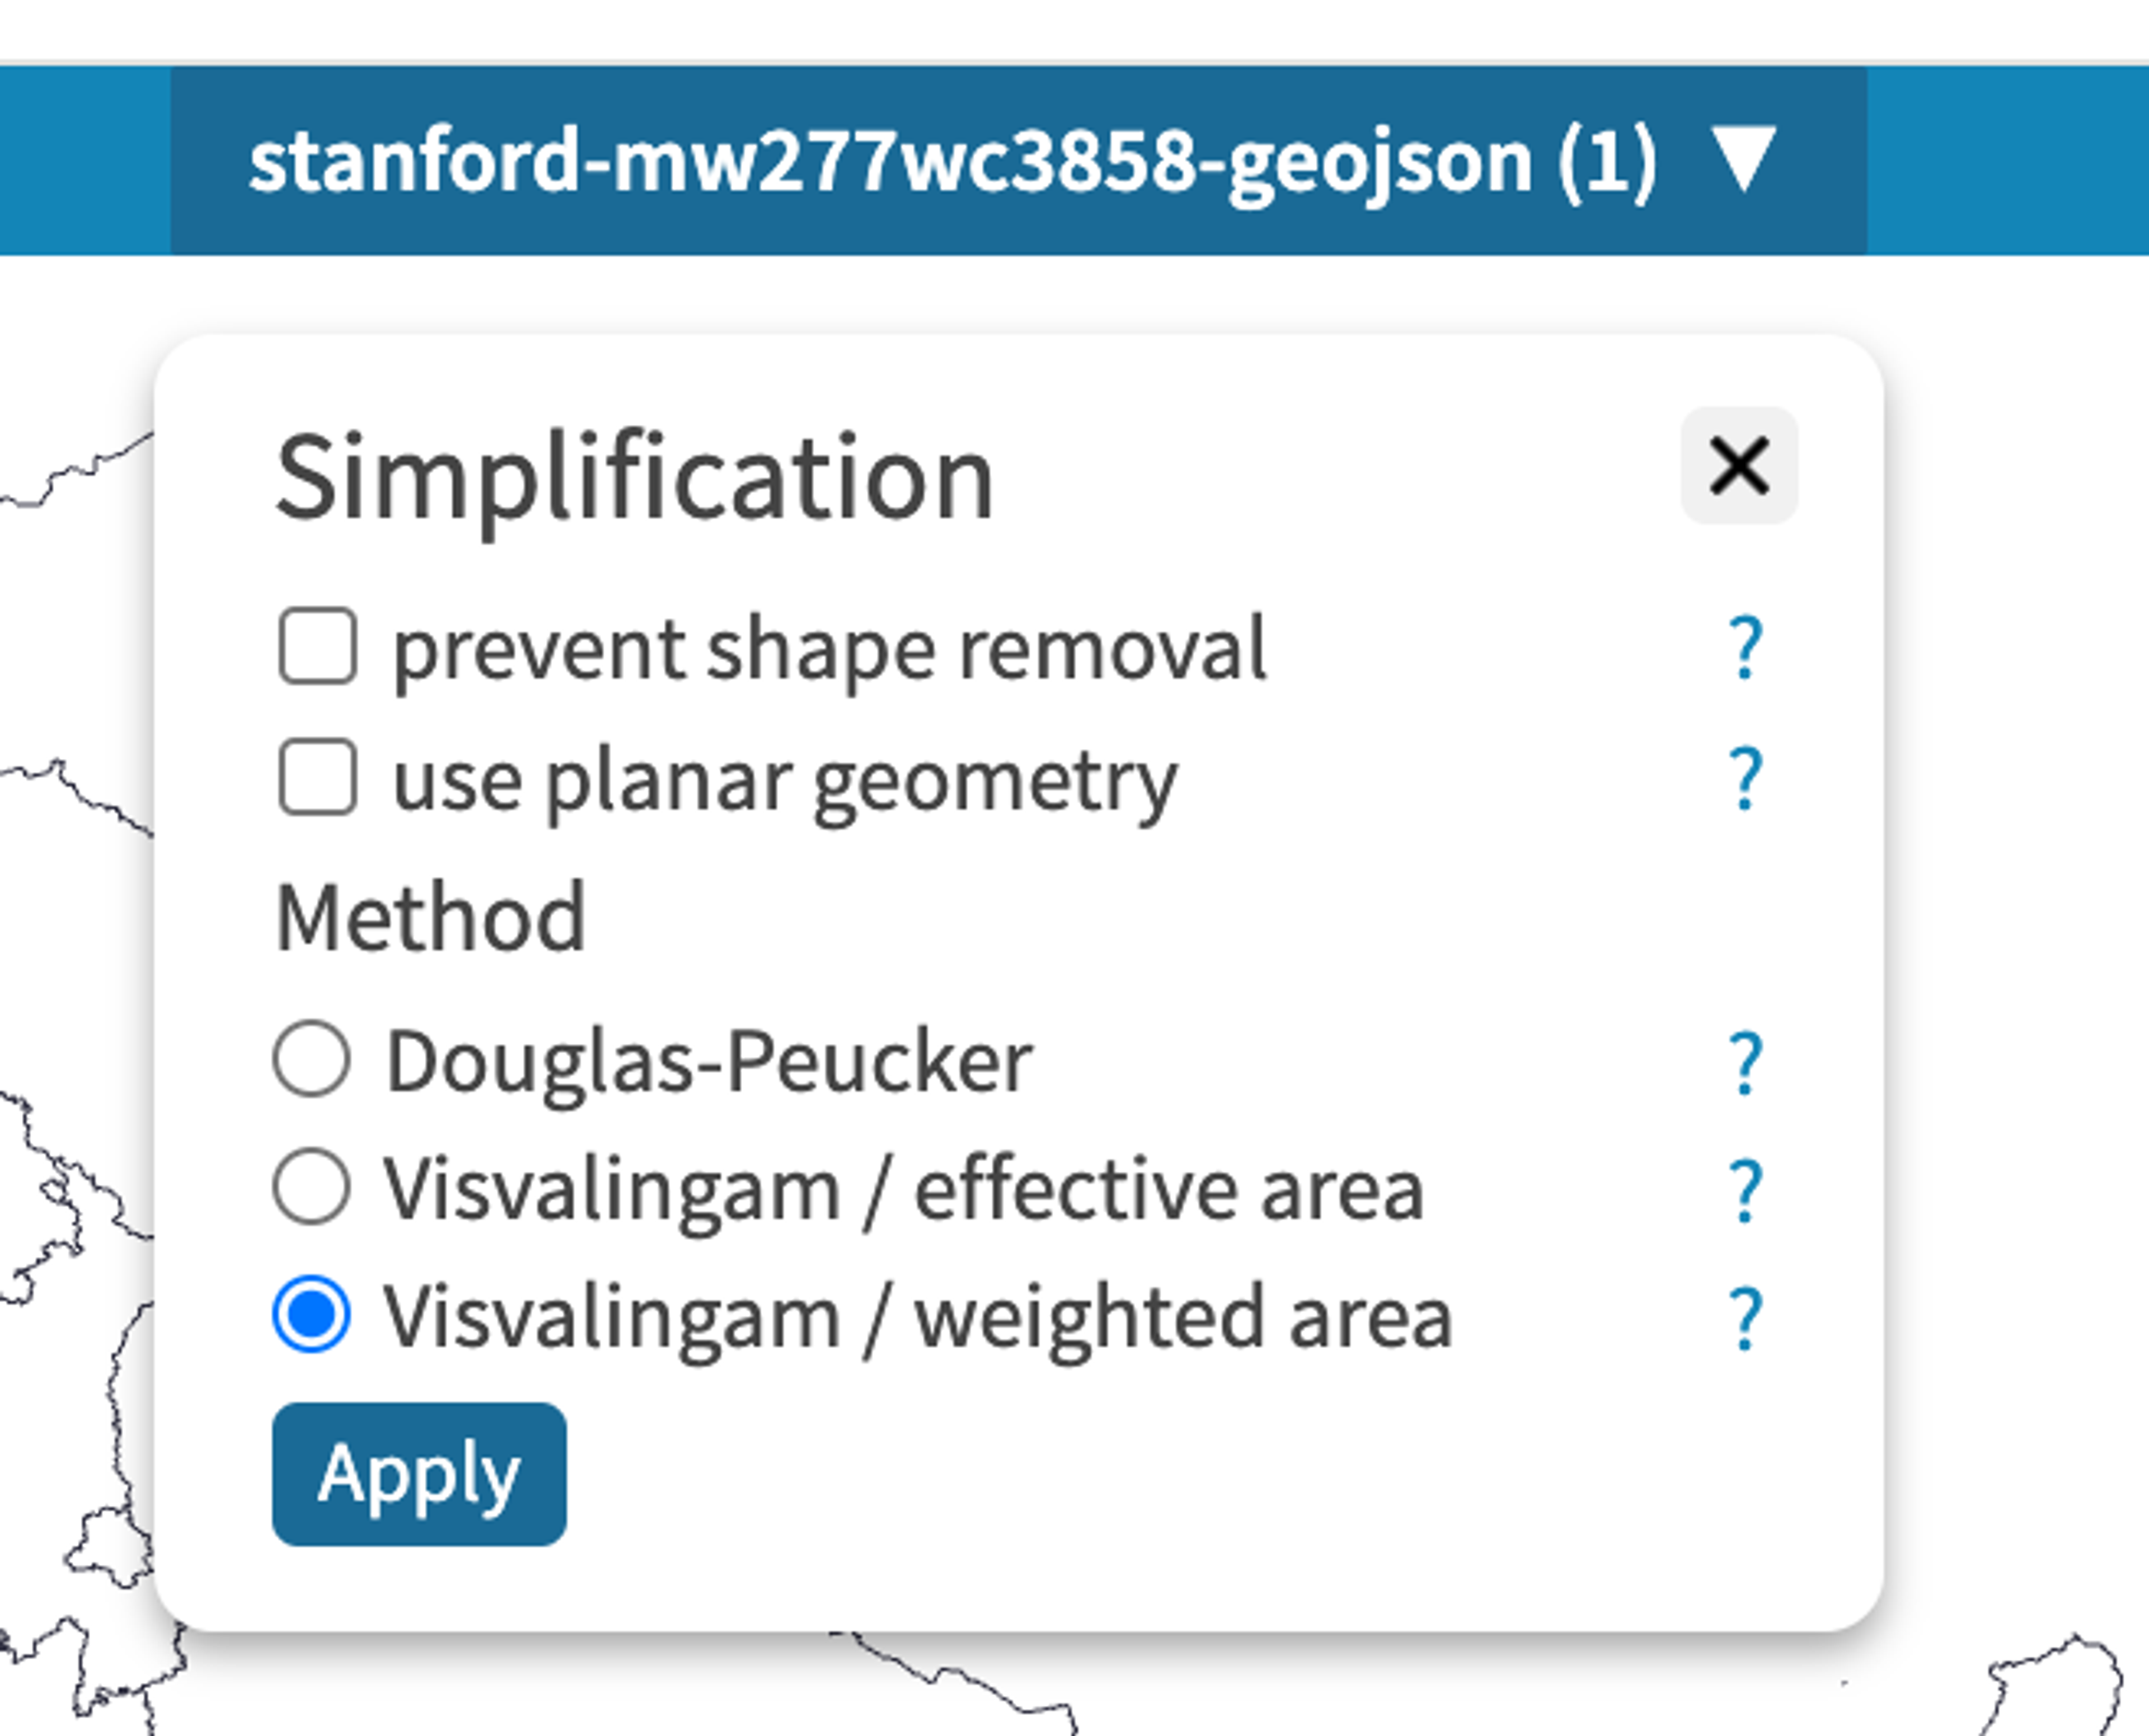
If you're feeling adventurous, MapShaper offers tools to simplify your shapefiles. Simplifying the data can speed up uploads without compromising the essential contours of your maps. Plus, it's equipped with editing features for any additional fine-tuning.
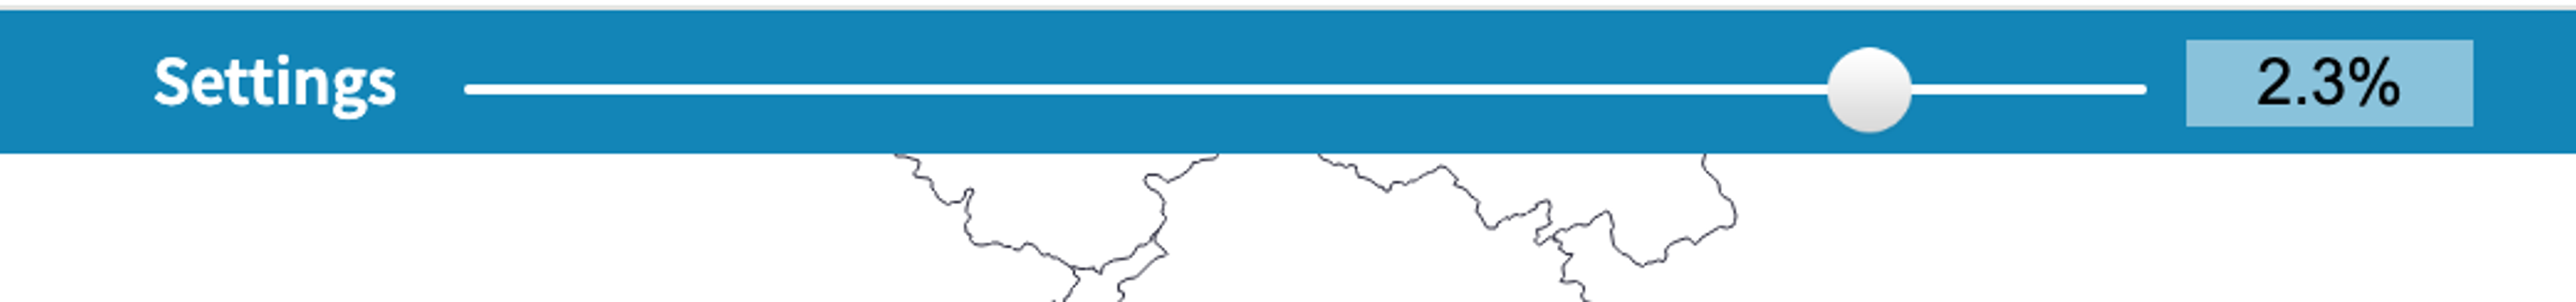
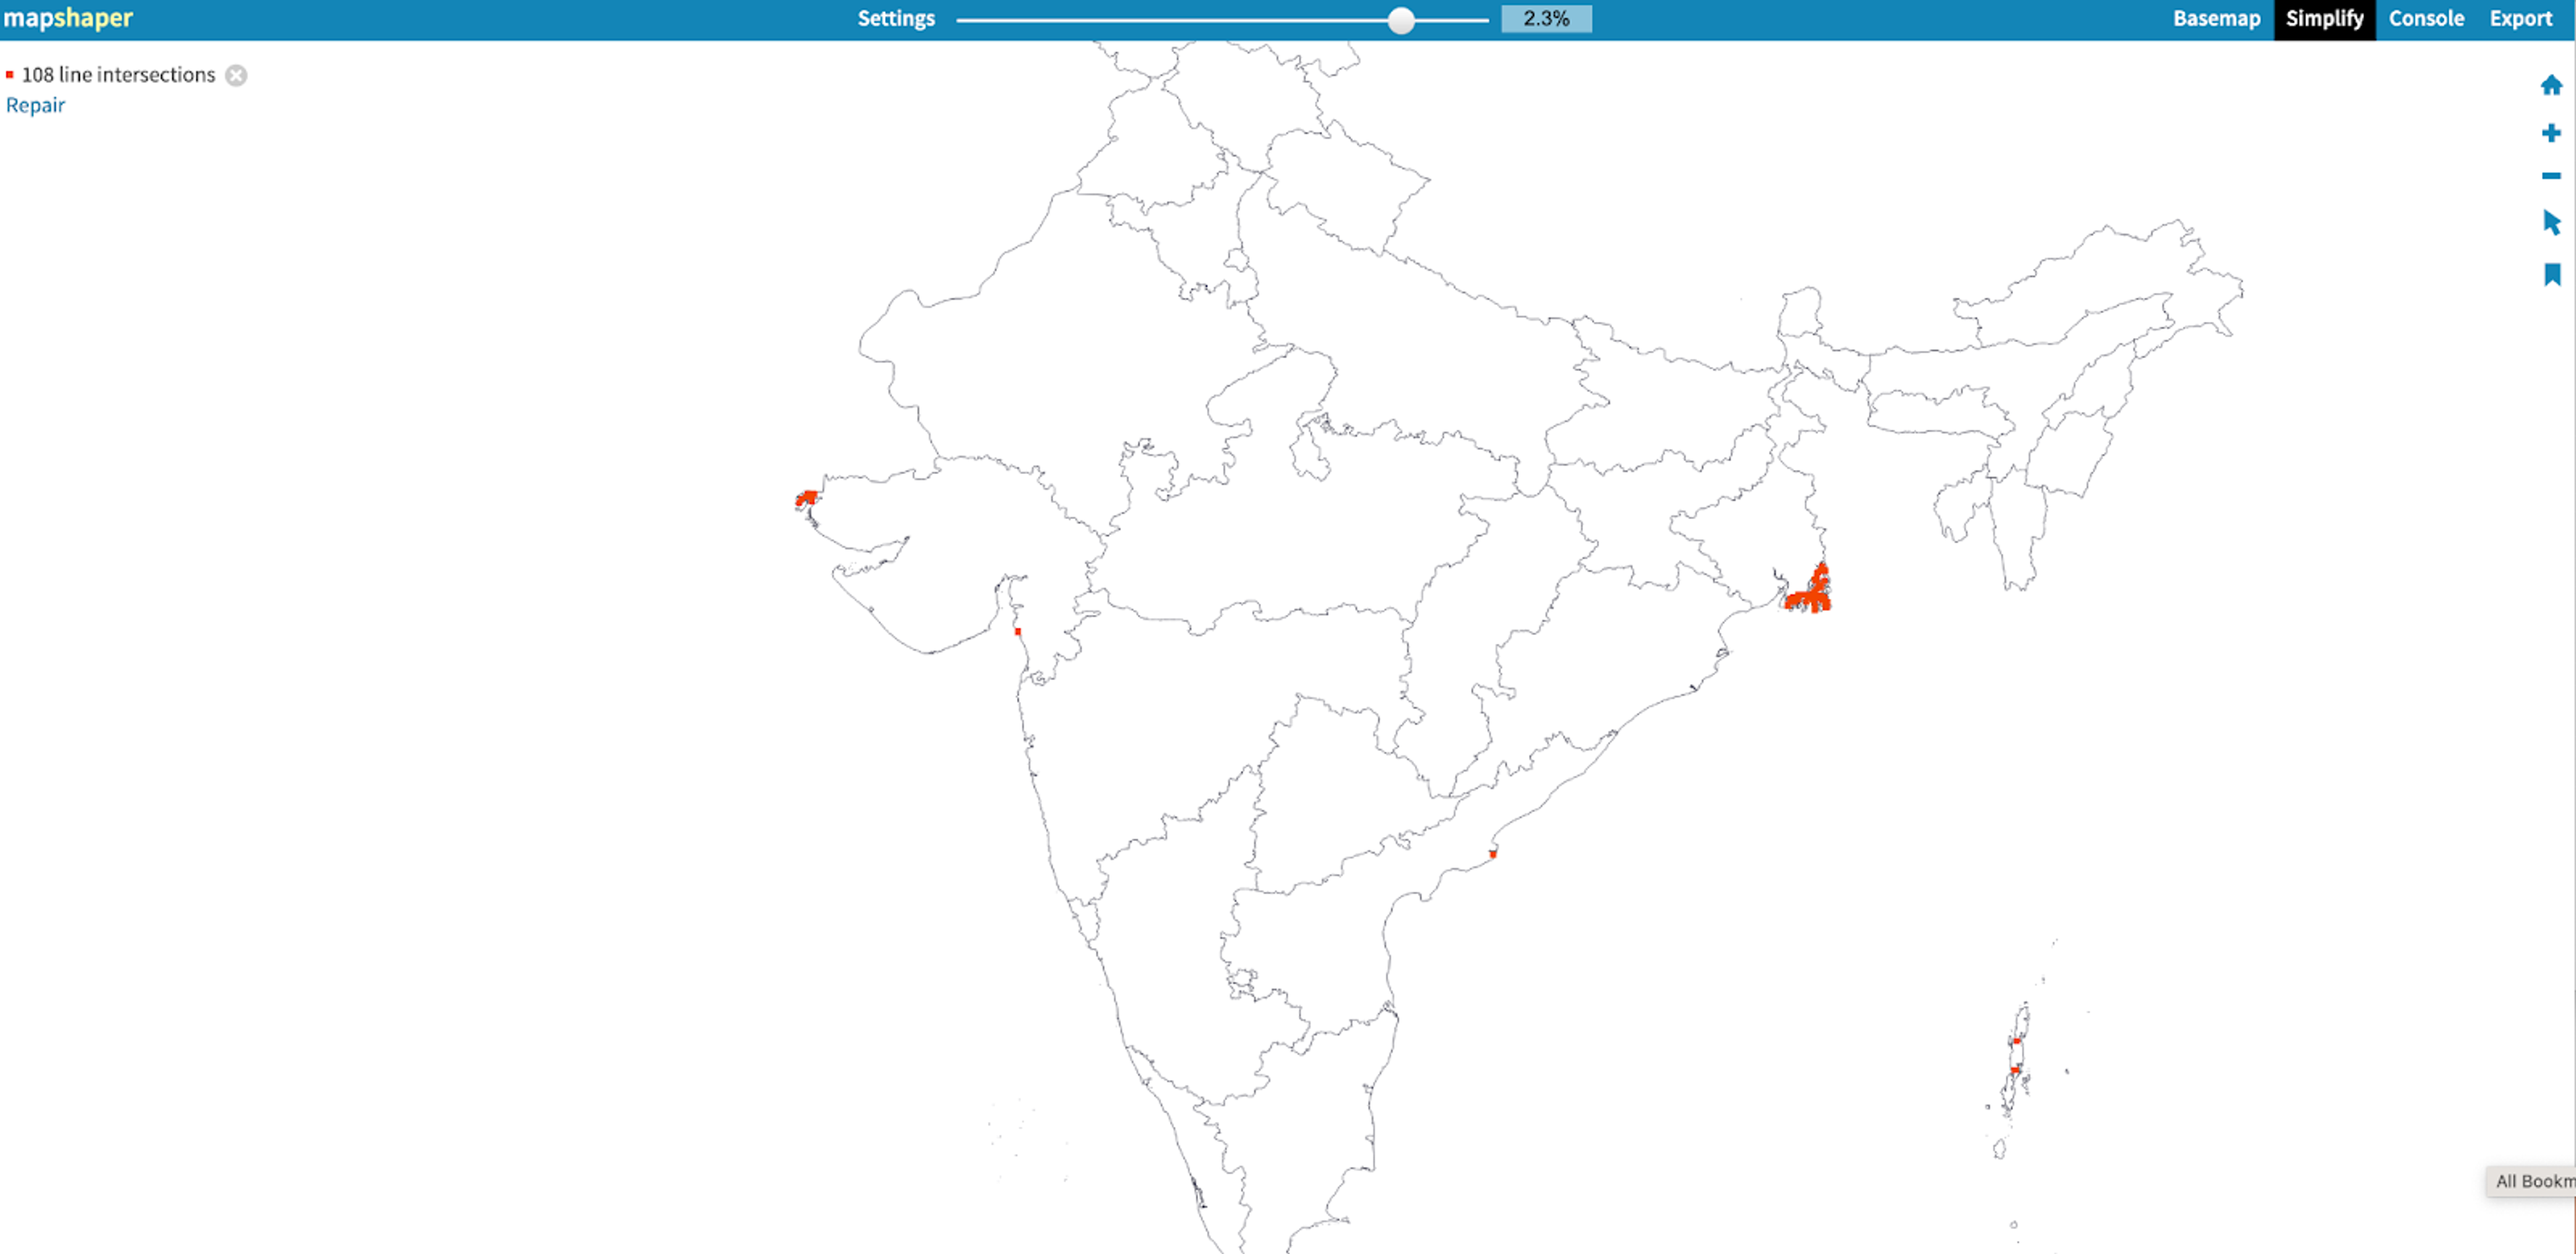
If you’re not familiar with these kinds of files, the dataset is essentially giving you one datapoint for each time the line changes shape. That results in a very large number of map coordinates. To reduce the number of coordinates, and thus the size of the file, you can change your settings in MapShaper to simplify the GeoJSON file.
For example, if I compress the map to 2%, I still see a basic map of India - even though I removed many of the coordinates. Why would I do this? It makes the file much more compact without losing critical information.
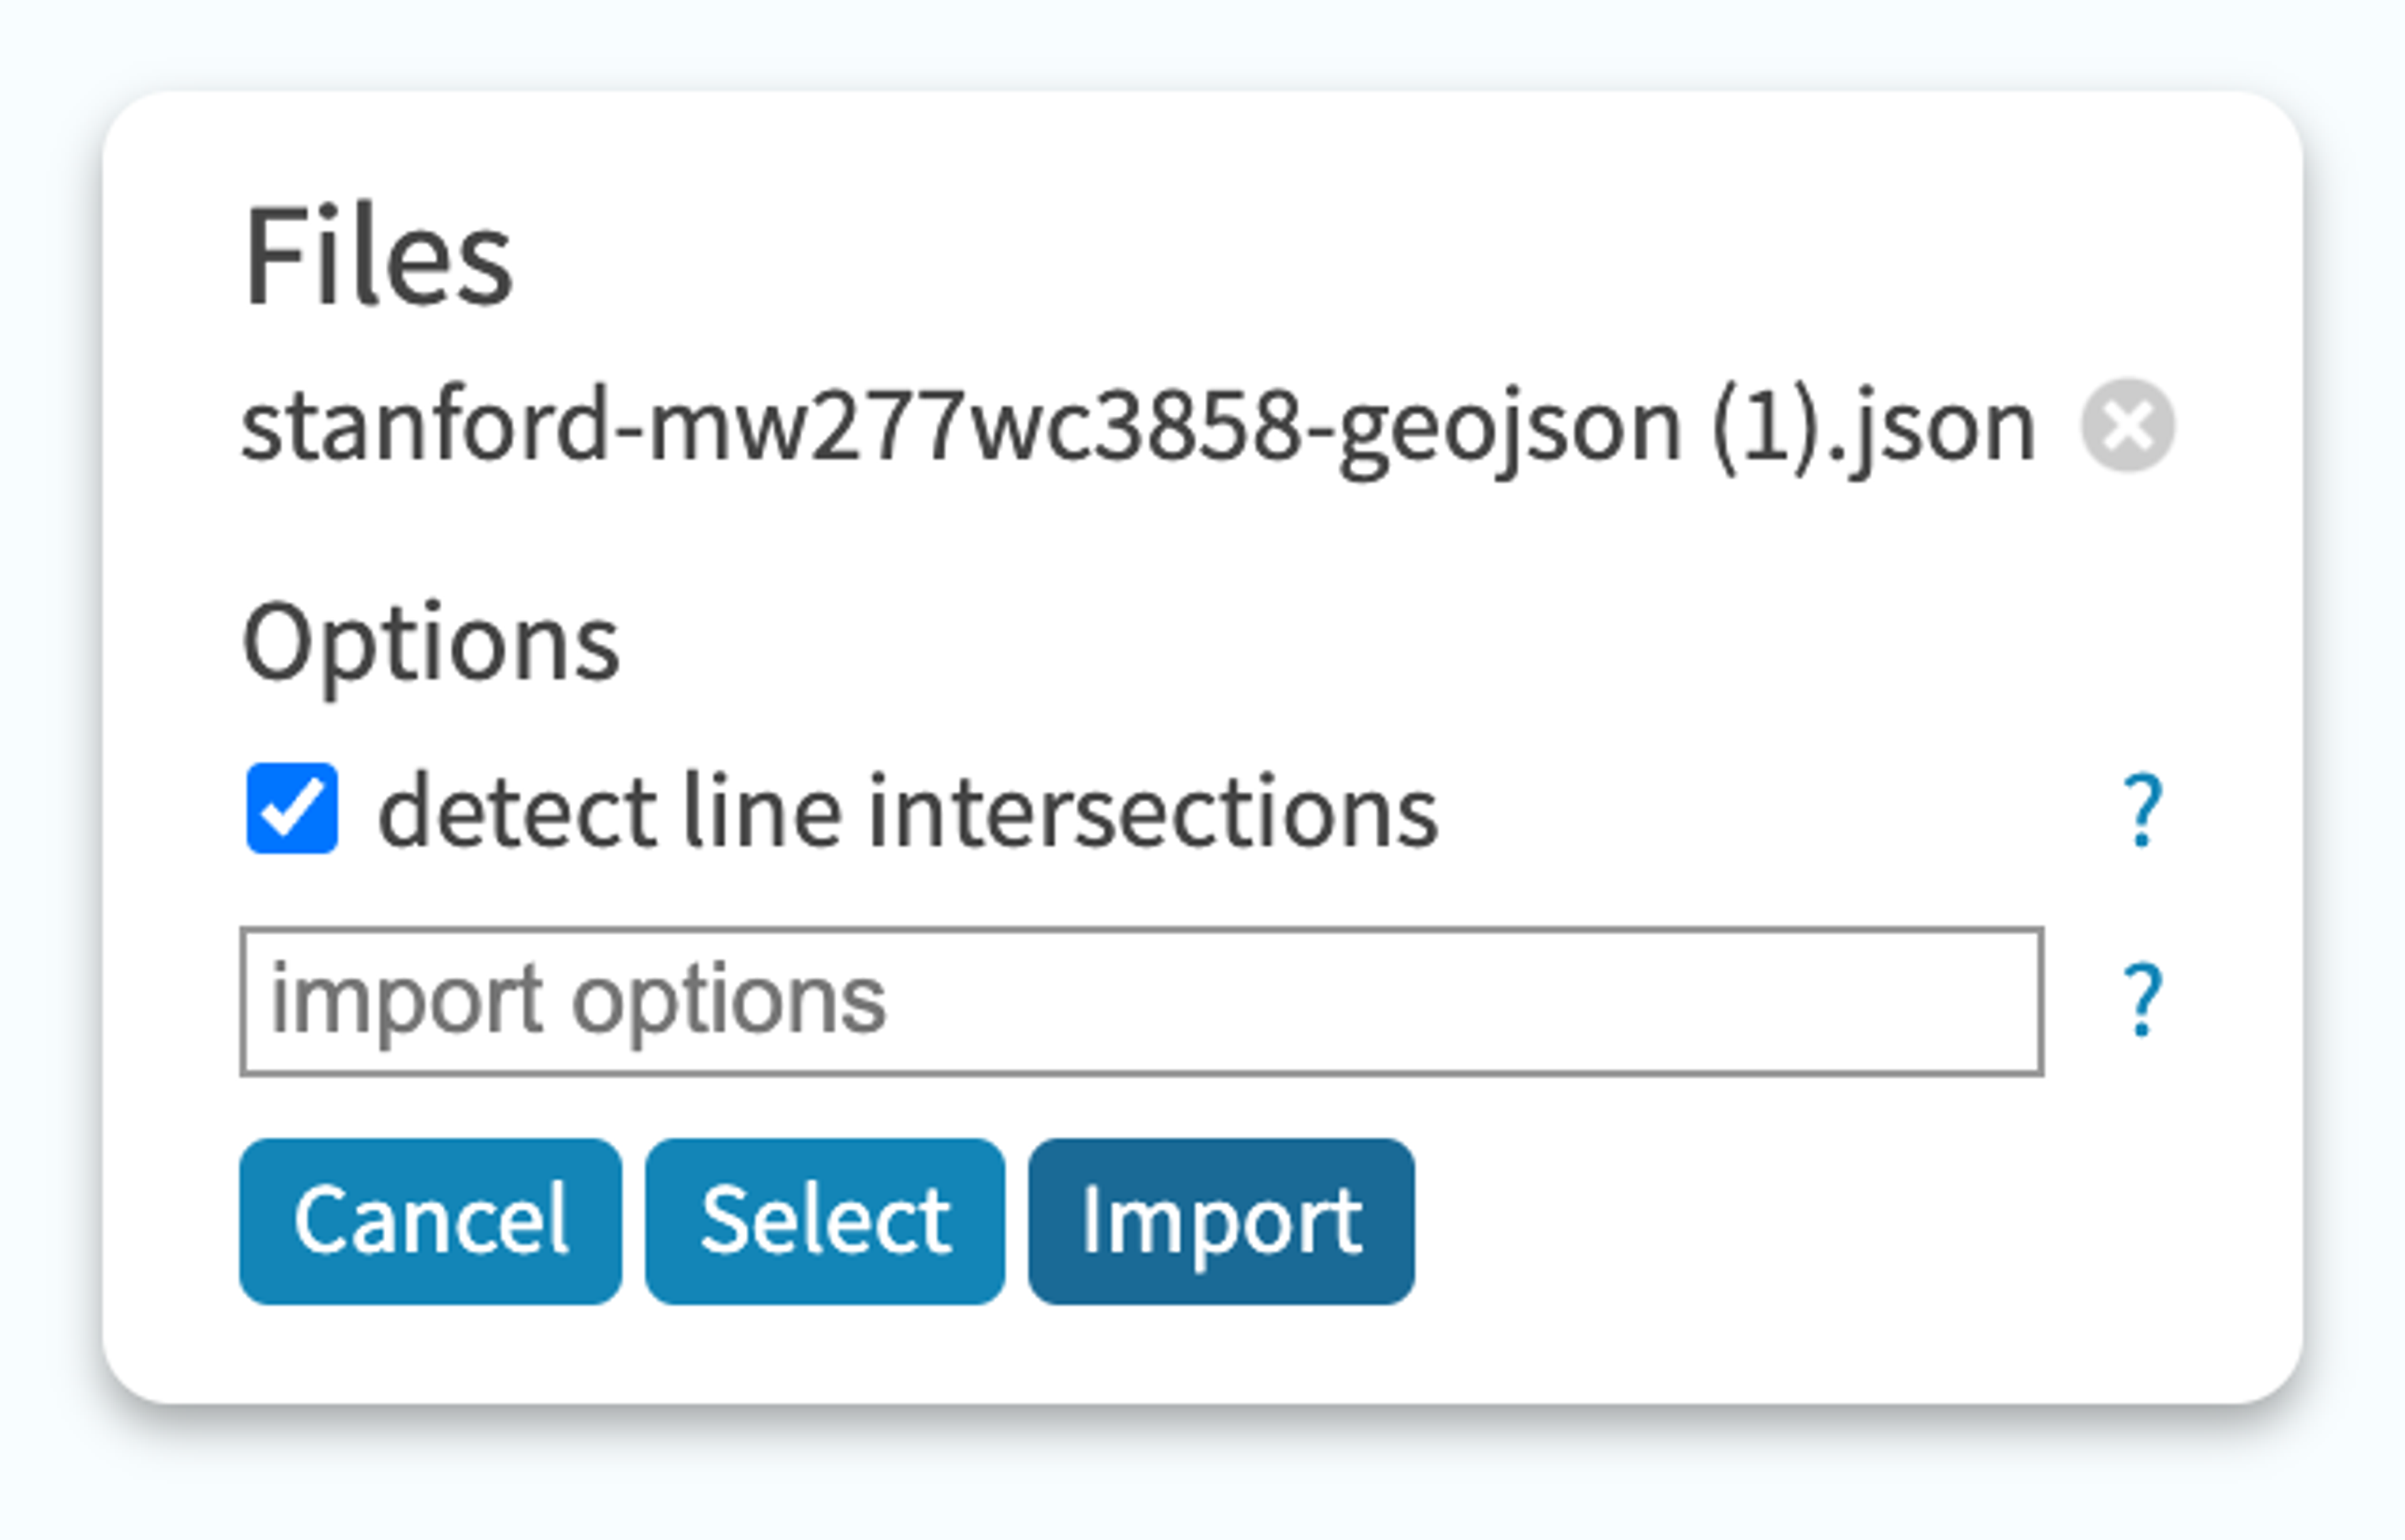
Once your file is looking sharp, export it as a GeoJSON.
Next, simply change the file extension of your exported file to .csv from your file explorer. It's that straightforward.
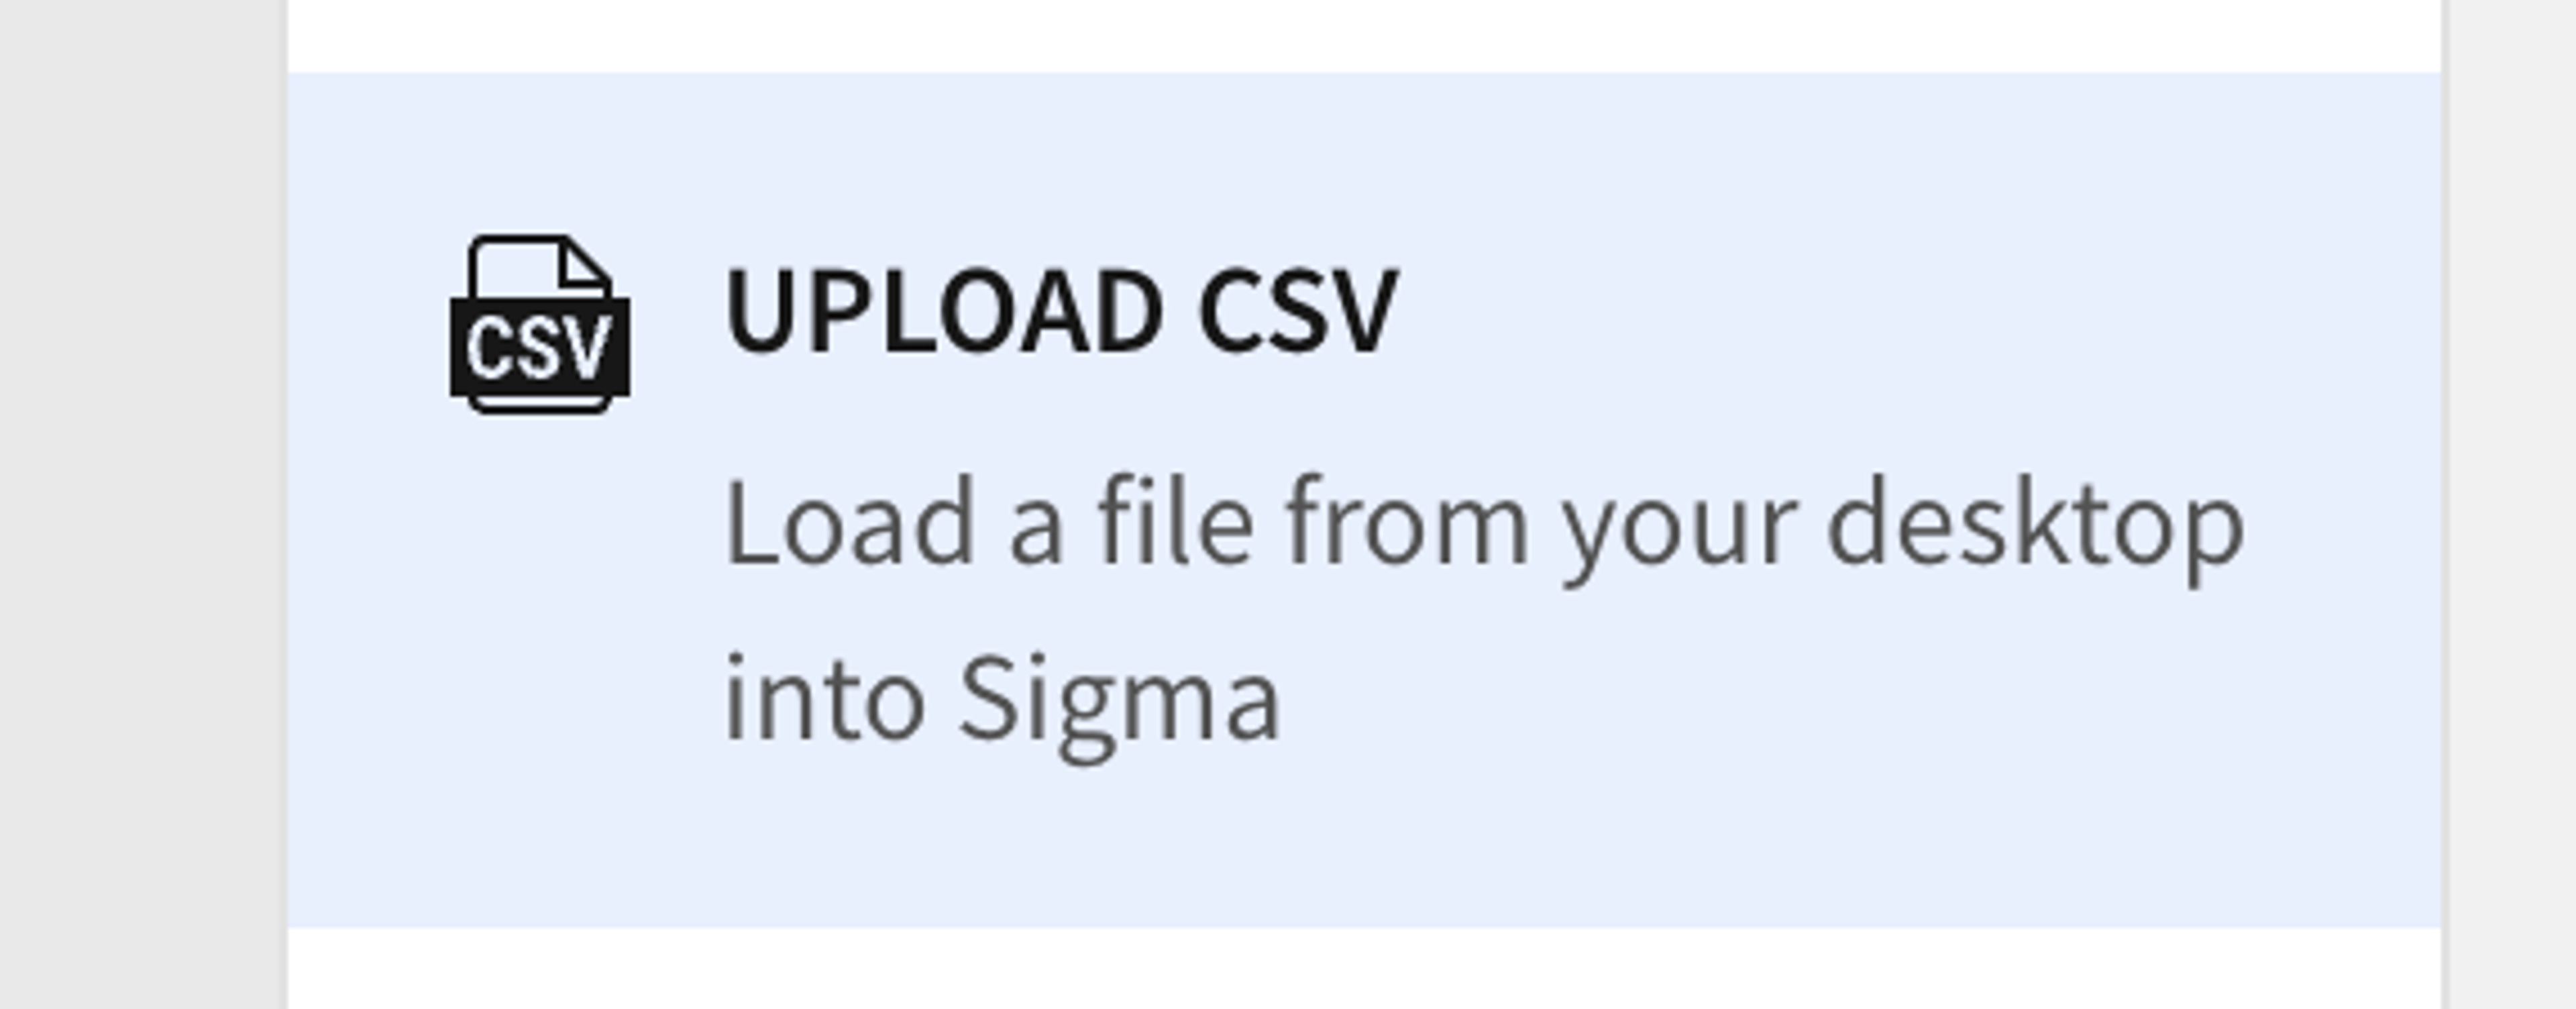
Step 6: Bring It All into Sigma
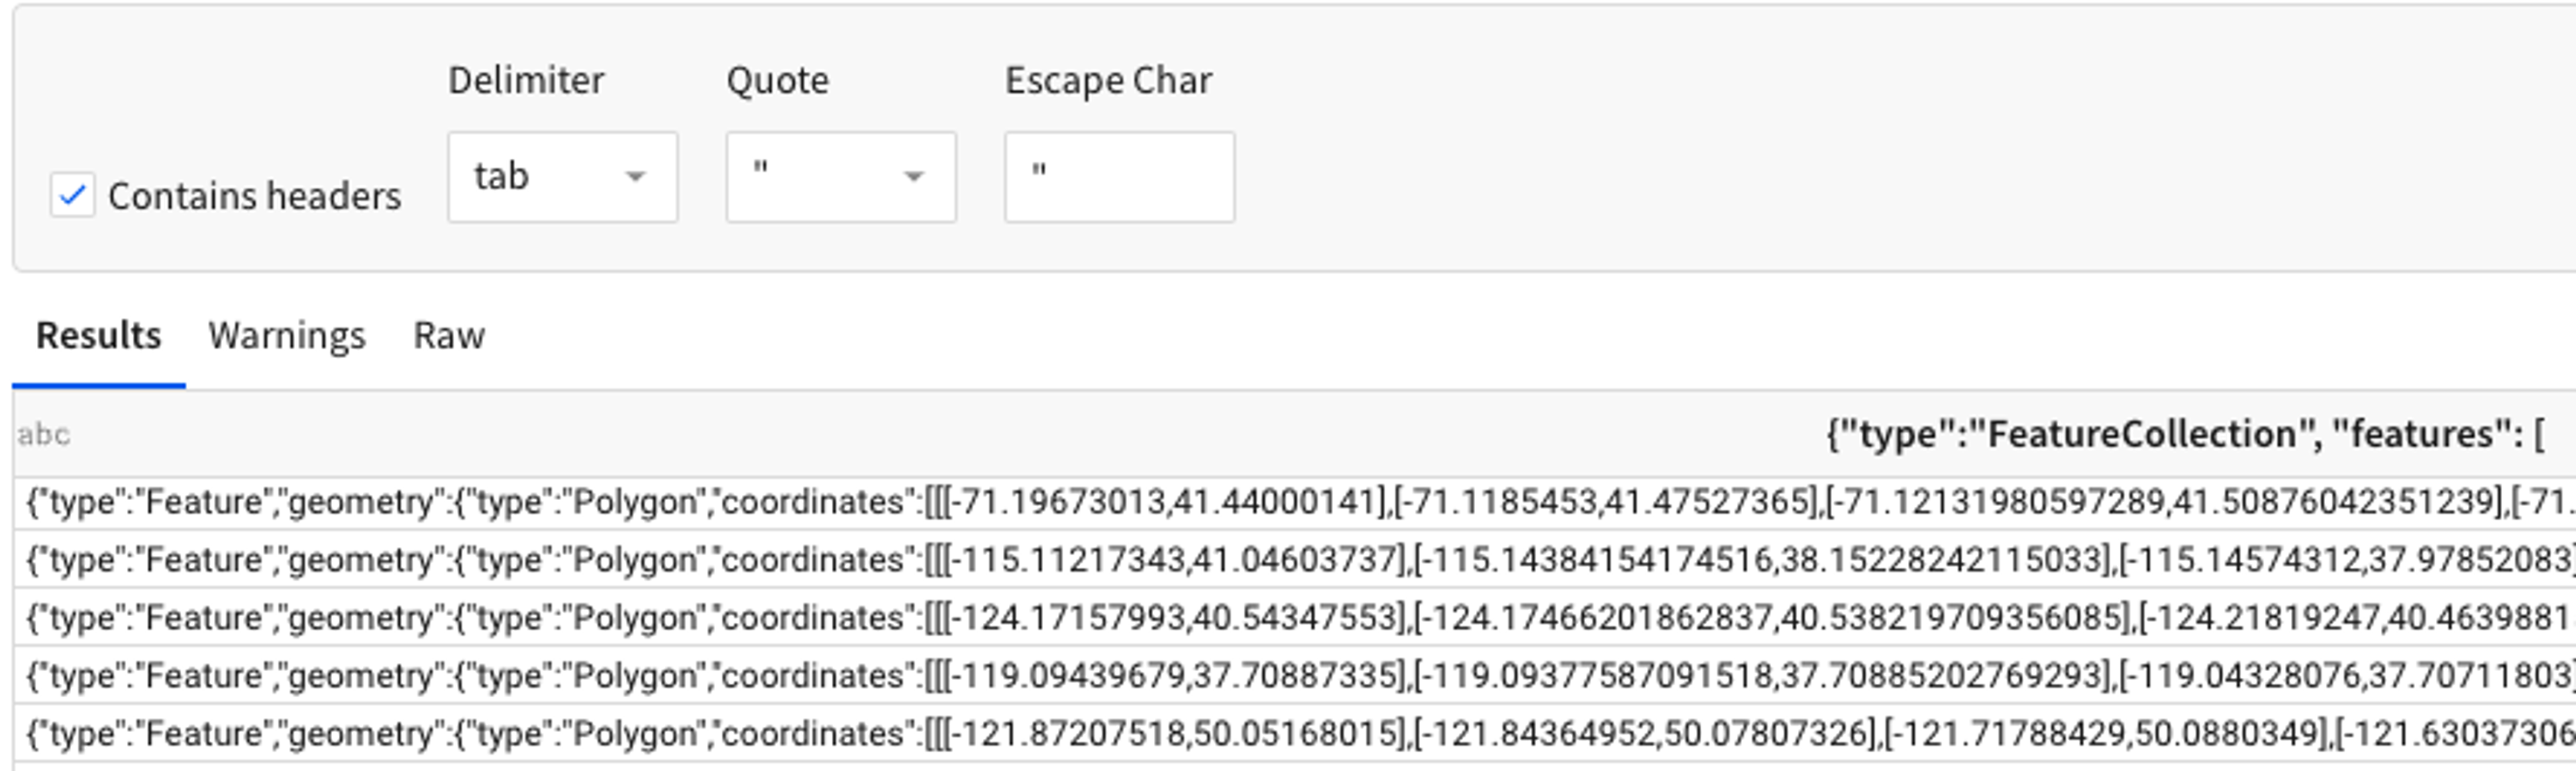
Using Sigma’s CSV upload feature, upload the file from your desktop into Sigma, ensuring it's parsed with the "tab" delimiter. This will read in the file as a single column.
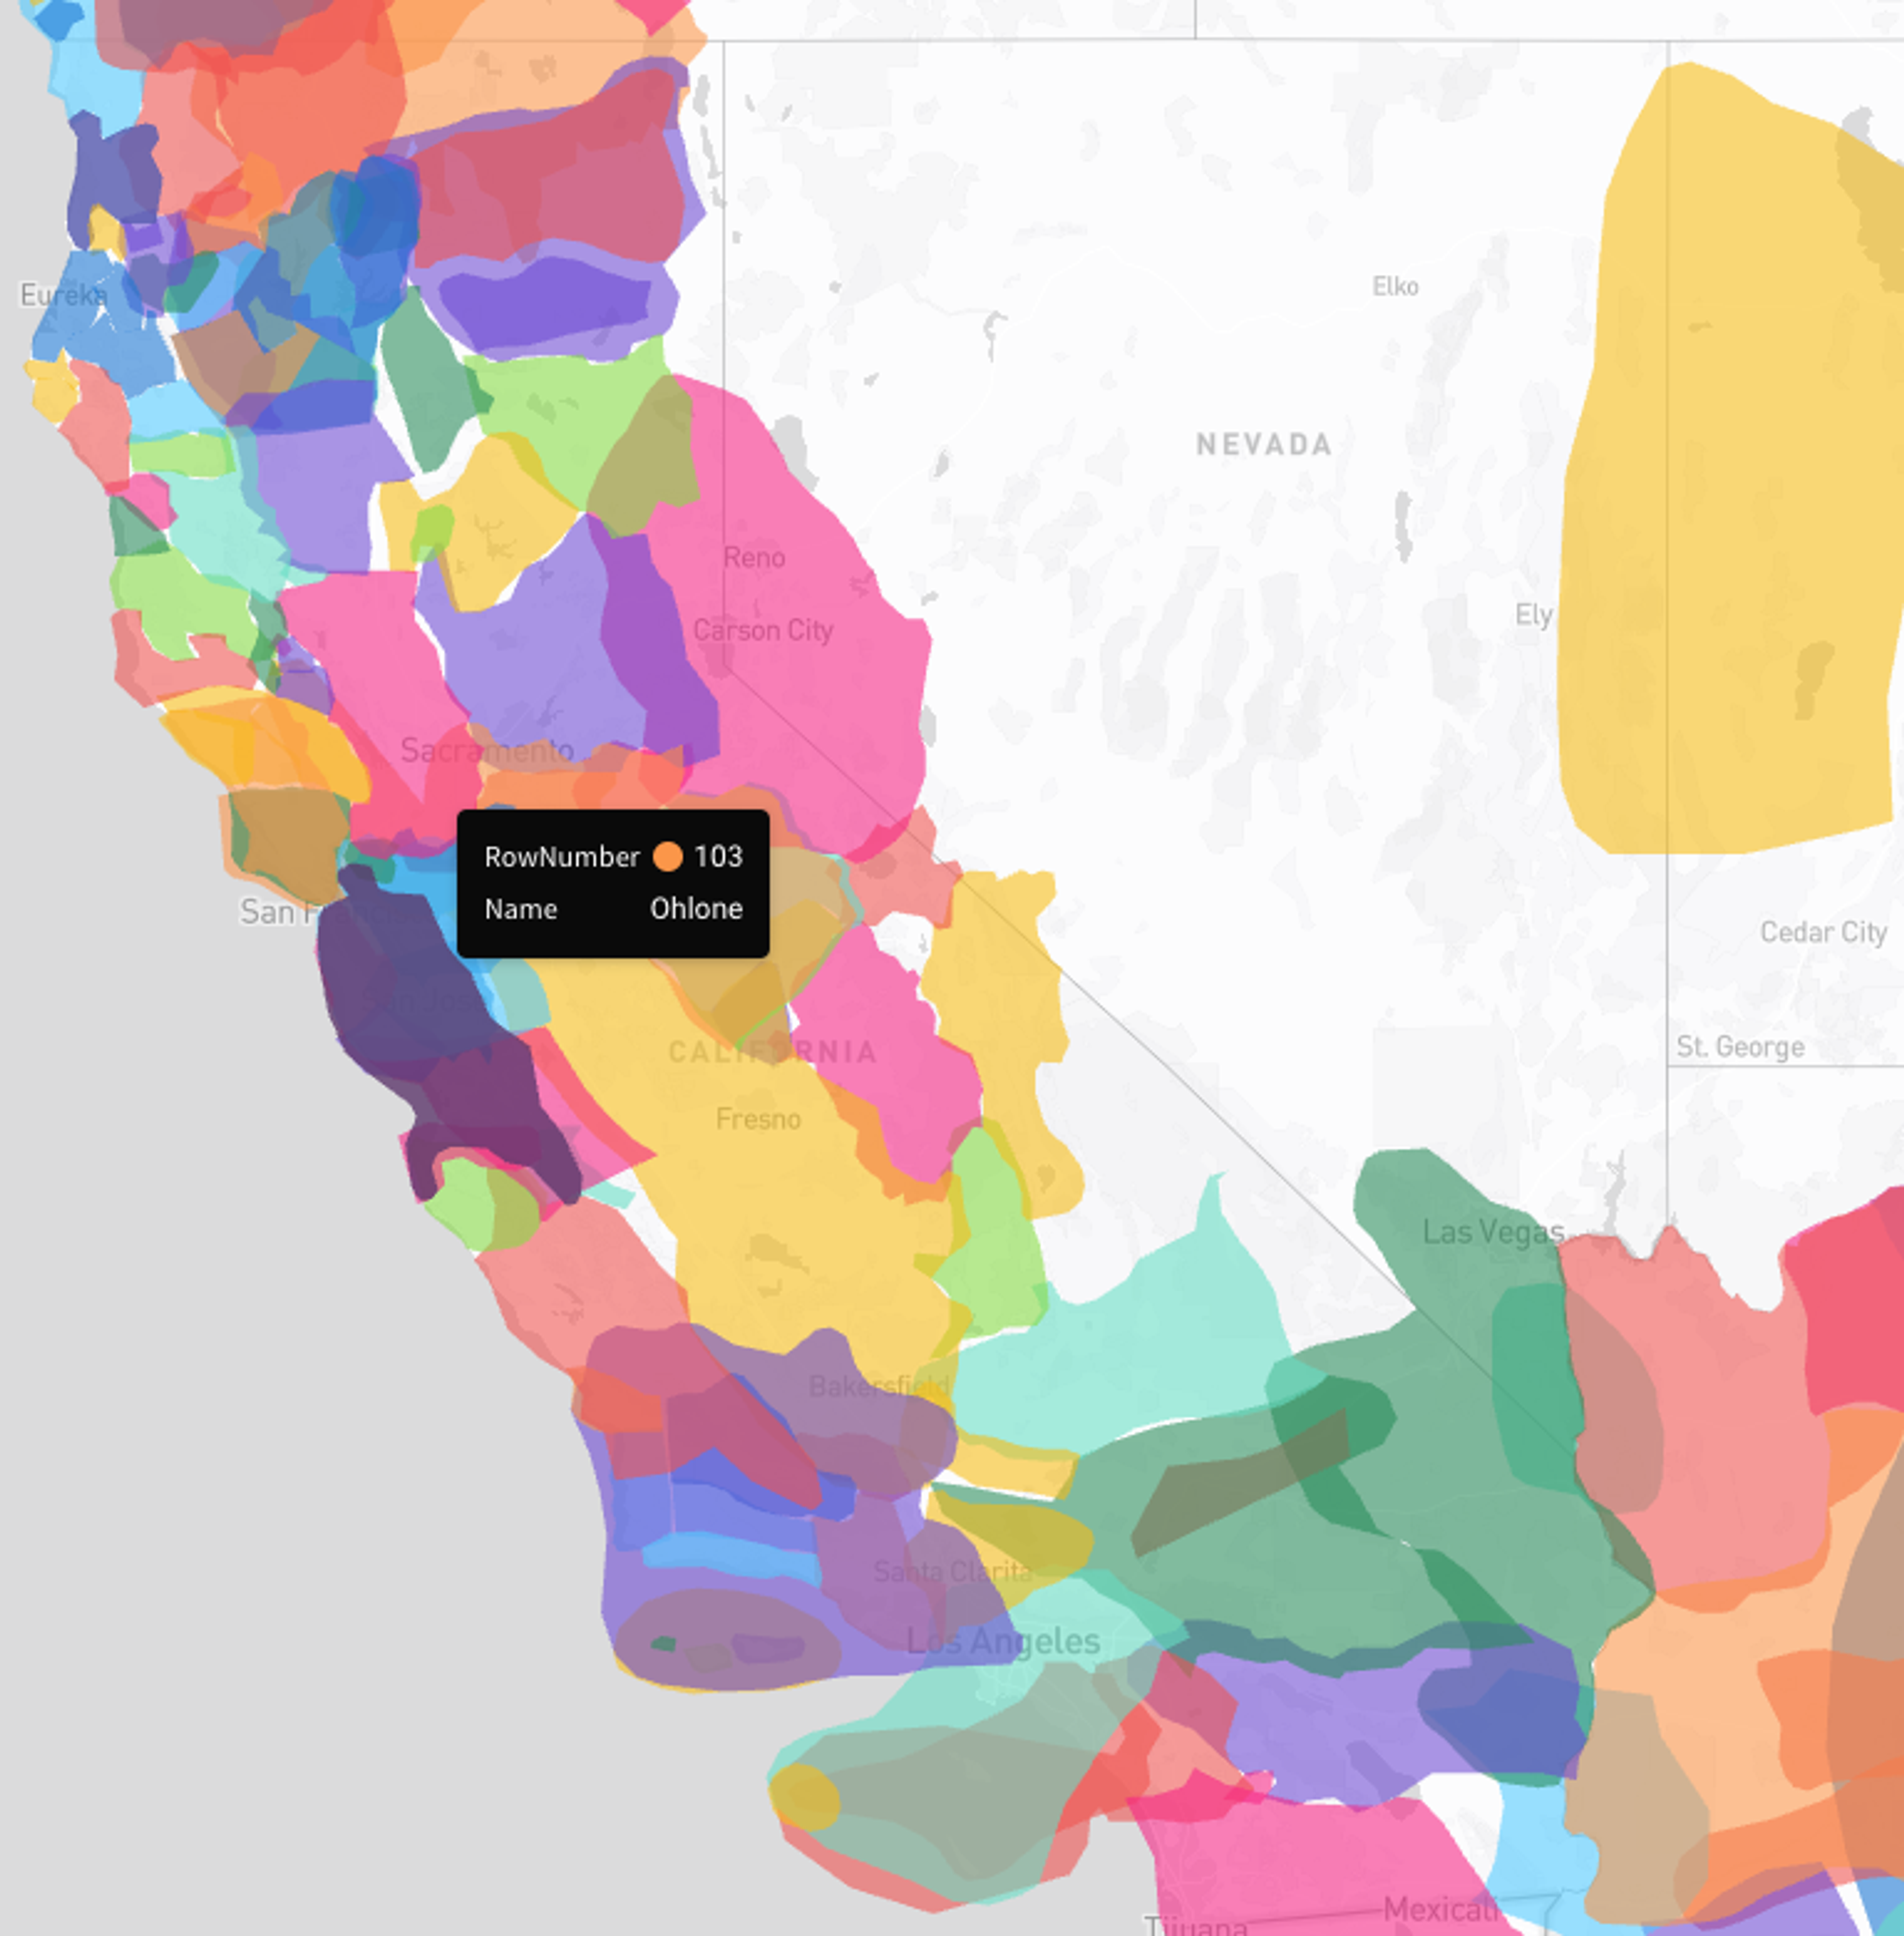
In Sigma, right-click the column header and choose Convert to JSON. Then, use the Extract Columns feature to isolate the Geometry Column from the JSON field. Finally, convert this new Geometry column to a Geography type by right-clicking and selecting Convert to Geography, ready for plotting in a Map-Geography element.
Embracing Geo-Analytics in Sigma
No more battling with complex scripts or cumbersome conversions. This method saves time and opens up a world of possibilities within Sigma for geo-analytical tasks. So, why not give your data the spatial context it deserves? With a few simple steps, you can integrate comprehensive geo-mapping into your data analysis, making your insights more visual and intuitive.
GeoJSON integration into Sigma doesn't have to be a daunting task. By leveraging tools like MapShaper, you can ensure that your geographic data is accurate and optimized for Sigma's powerful analytical features. After all, looking at maps is how you relate to a space. Whether you're tracking regional sales, monitoring logistics, or analyzing demographic trends, combining GeoJSON with Sigma’s computing prowess can provide a seamless and insightful experience.