Taking BI to the Next Level with the AI Toolkit for Business, Data Applications & More
Forget the last 20 years of business intelligence. It’s been boring. Here at Sigma, we’re bringing you the future of analytics and BI. It’s all about amplifying productivity: building quicker with AI, taking direct action on data, and enabling users of every skill set to work together.
Introducing the latest Sigma innovations
Today, we’re excited to announce new features and functionality you can only get from Sigma, allowing you to do much more with your data. Only with Sigma can you get:
- The AI Toolkit for Business
- Consisting of AI Functions, AI Forecasting and the Sigma Copilot
- With more AI functionality to come
- Capabilities to build scalable Data Applications
- Including the new Sigma Actions that power forms, multi-user workflows and interactivity—all without writing any code
- Plus, secure write-back functionality that allows users to write new data back to their warehouse alongside the original data
- A collaborative environment that makes advanced data science approachable to the business with Python support and a refined SQL experience in Sigma
- So that advanced users can leverage the full power of Sigma’s UI to build experiences around their analysis
- And teams of all skill levels can collaborate together in real-time, using and referencing whichever method of analysis works best for their use case
- The most robust Embedded Analytics experience on the market
- So that your end users can go beyond viewing their data and actually engage with it through Explore mode, comments and sharing
- Opening up new opportunities for you to monetize your data and offer additional license options to your customers
But that’s not all.
We’re also adding new enhancements to the Sigma user experience so that your teams—developers, data scientists, executives, analysts, business stakeholders, marketers, engineers and more—can work with data in precisely the way that suits their use cases and technical proficiency.
These new enhancements include:
- Custom table styling
- Workbook containers
- Waterfall charts
- Dynamic reporting (AKA “bursting”)
- More options for exporting workbooks
- Microsecond reporting
With these new features and functionality, we’re taking enterprise BI to the next level and reinventing what you can do with your data—all from the simplicity of a spreadsheet interface.
Read on below or watch the full launch video to learn more about the new features and functionality we introduced today. You can explore these updates and learn more about Sigma by:
- Signing up for a free trial or requesting a custom Sigma demo
- Tuning in to our Embedded Analytics webinar on May 21
- Meeting with the Sigma team atSnowflake’s Data Cloud Summit or theDatabricks Data+AI Summit
This is the future of BI, and we’re just getting started. Here’s an overview of everything that’s new in Sigma:
The AI Toolkit for Business
First, we’re introducing the AI Toolkit for Business.
You don’t know what AI will look like 3-5 years from now. But you know you want your business to benefit from it. That’s why we’re building the AI Toolkit for Business, which brings the latest and greatest innovations from the cloud data ecosystem into Sigma.
This way, you’re always getting access to the best AI features to work with data, but within an intuitive interface that has security guardrails baked into the user experience.
We’ll keep adding to the AI Toolkit as AI use cases evolve within the data space. But to begin, we’re adding AI Functions, AI Forecasting and the Sigma Copilot to the toolkit.
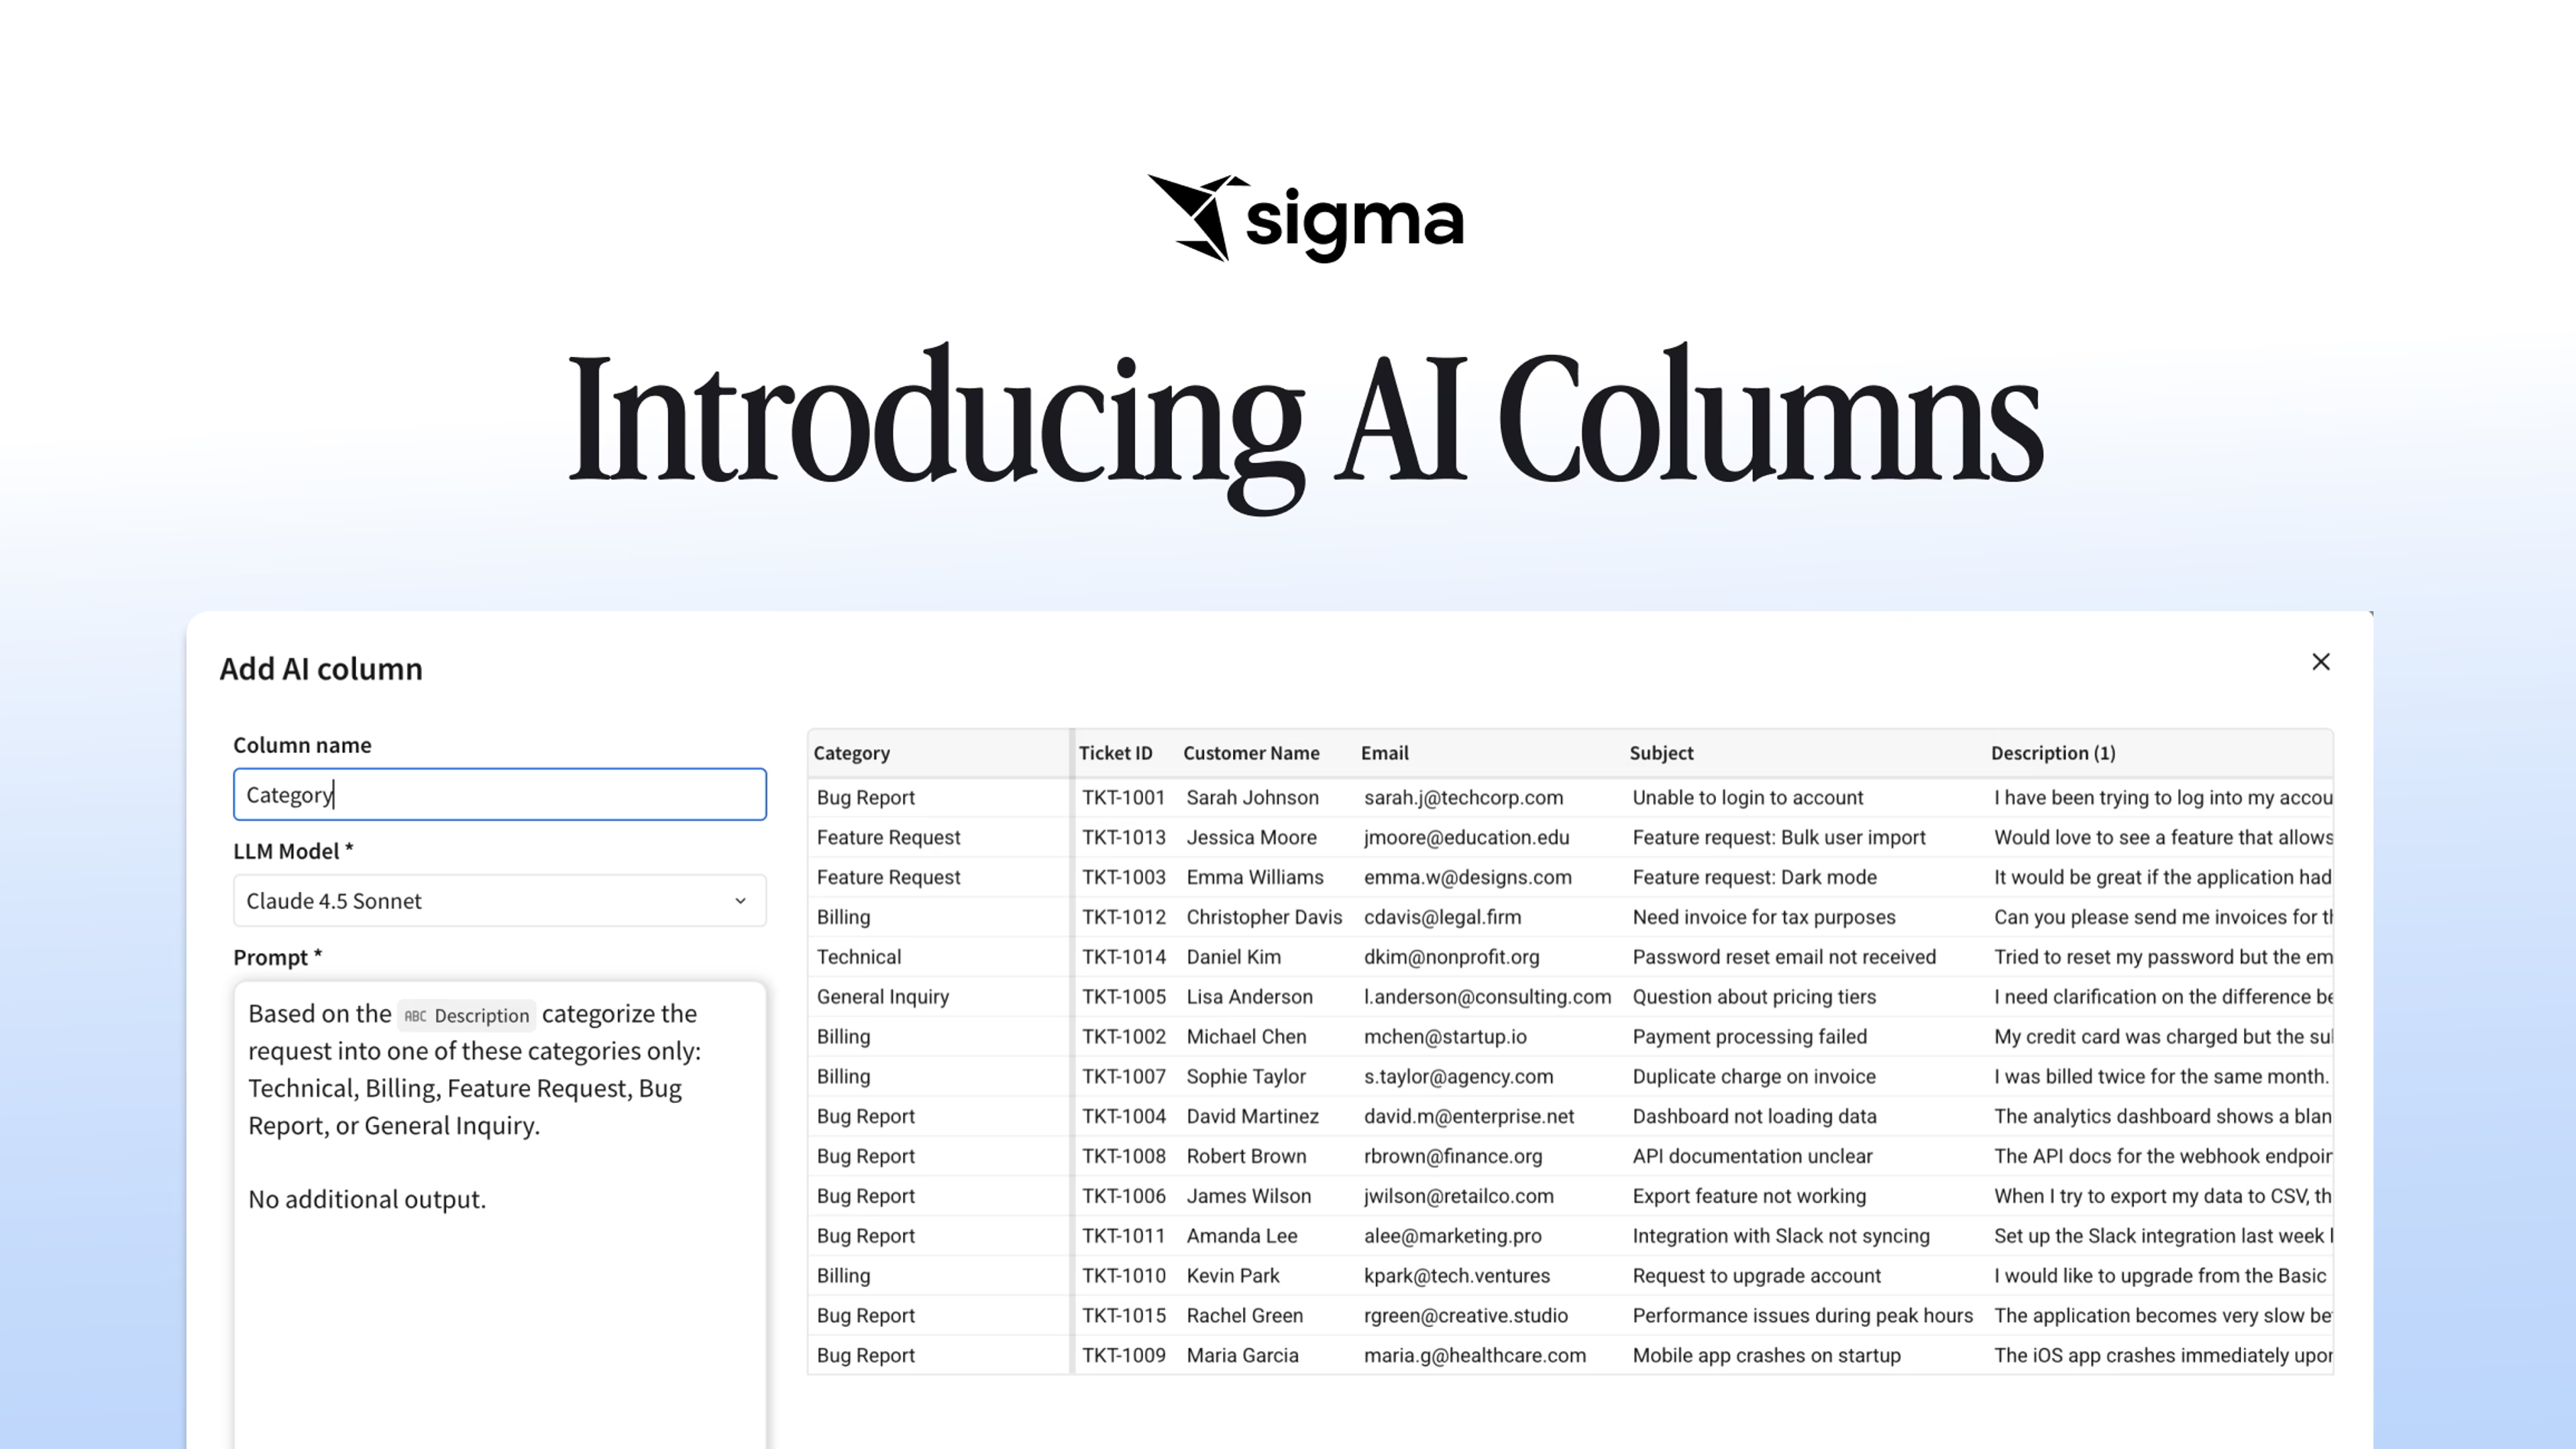
AI Functions
Last year, we added the ability to write custom functions in Sigma. And the next evolution of custom functions is AI Functions.
AI Functions are a governed way for your team to leverage the power of LLMs to enrich your data. This capability allows you to add new columns into tables populated with the most popular LLM technologies—and the first one we’re bringing in is OpenAI.
With AI Functions, Sigma administrators govern who can opt into working with AI, and you can even use Azure OpenAI endpoints for extra security. (Keep in mind that your own API key will be used here with OpenAI or AzureOpenAI. You have full control over whether you connect your data to the LLM provider.)
AI Functions automate work that would otherwise need to be done by hand. They can also reference other columns in your table to build the prompt, and you can use the result of that AI Function in other columns, too.
You can also write back this information into your cloud data platform—adding extra context to your existing data.
AI Forecasting
At the end of last year, Snowflake launched Snowflake Cortex, an intelligent service that offers machine learning and AI solutions to Snowflake users. And now, we’re connecting Sigma with the power of Snowflake Cortex.
In Sigma, you don’t need to know SQL or Python to use Snowflake Cortex's forecasting functionality. We’ve built the UI that allows Snowflake customers to access these features from a spreadsheet-like interface.
So, instead of writing a stored procedures call, you can simply click a button in Sigma to forecast your data with Snowflake Cortex. You could also call a custom model that you built, and that lives in Snowflake. You can click a button in Sigma to train that model at any set cadence, like once a week.
Sigma Copilot
With Sigma Copilot, new and advanced Sigma users can quickly ask their data questions using natural language.
In other BI tools, natural language gets translated into large blocks of SQL or Python. That makes it nearly impossible for end users to understand what AI did, validate the work behind a solution, or modify it further.
Sigma Copilot takes a different approach.
Everything in Sigma Copilot is built for end users. The copilot shows its work in formulas and explains its actions in language everyone can understand.
Sigma Copilot won’t go rogue. You are in complete control. You can choose whether to enable it and what is accessible to AI, and you can feel confident that it’s all protected by Sigma’s enterprise permissions model.
---
AI Functions, AI Forecasting and Sigma Copilot are coming soon.
Data applications
Last year, we released scalable write-back capabilities via our Input Tables feature. With Input Tables, end users can easily write new data back to the cloud data platform, adding important human context to existing data. It’s fully secure too—Sigma appends the new data added via Input Tables back to the warehouse alongside the original dataset, so that you can maintain a robust data history.
With the release of Input Tables, we’ve seen many enterprise customers leverage this write-back capability to build applications on top of the data in their cloud data platform. For example, these data apps might:
- Track a marketing campaign
- Manage stock inventory
- Assess employee performance
- Report crucial compliance data
- And so much more
The options are endless. If you have a process related to data, a data app will help you streamline and scale out the work involved.
And now, with the release of Sigma Actions, we’re making it even easier to build data applications.
Sigma Actions
Sigma Actions let you define interactivity with elements of a workbook so that you can determine how inputs and user activities trigger your workflows. This might mean setting a button click to navigate users to an element in another workbook, or setting a click of a bar in a bar chart to add a filter onto a table element.
Actions create a rich, interactive, user experience around your data. And they can even go beyond Sigma workbooks to trigger activities such as interacting with external applications, notifying employees, or calling webhooks.
But that’s just the beginning. Sigma Actions also help teams to build forms and complete workflows.
Multi-user workflows
Sigma Actions enable team members to collaborate on disparate parts of an end-to-end workflow.
For example, think about building a payroll timestamp system in Sigma. Each user—perhaps an employee, in this case—should only be able to edit their own time log data, not their colleagues’ data, and their supervisor should only have approval access, perhaps not edit access.
These customizable access controls allow teams to curate the experience of data apps for different role types, so that different teams can work together around the same data, and even within a set of established workflows.
You can think of this like protecting ranges in a spreadsheet, but in a dynamic and easy to manage way.
Forms
Teams can also use Sigma Actions to build forms that collect data at scale.
Using forms creates a high fidelity data experience for users of all backgrounds and reduces human error associated with freeform data entry. They also enhance data privacy in the data collection process because each user only sees their own entry field.
All together, forms, multi-user workflows and Sigma Actions truly enhance what you can do with your data app.
---
Sigma Actions are available now. Additional functionality to power forms and multi-user workflows is coming soon.
Python & SQL in Sigma
With SQL and Python in Sigma workbooks, we’re bridging the gap between data science and the business—all within the same product, and even the same workbook.
Notebook-style Python experience
Anyone who's ever toyed with data and Python has used, or at least heard of, the Jupyter Notebook. With the new Python integration coming to Sigma, users will have all the benefits of a notebook-style Python experience with the flexibility of a Sigma workbook.
What does that mean?
When you’re writing Python in Sigma, you can build and execute your code incrementally. But more than that, you can leverage any of the other data and analysis within Sigma—even jumping between languages or the UI—to tell the story, and build the applications you need.
And because Sigma is built for teams, every team member contributes live—using the medium of their choice—to build a complete narrative together. Data science is no longer siloed away from the rest of the business.
With Python in Sigma, business stakeholders will have unfettered access to data science work that’s previously been inaccessible to them. And the data scientists building models can collaborate in real time with their business stakeholders to iterate quickly on the insights that mean the most for the business.
Enhanced SQL Editor
We’ve made exciting updates to our SQL editor that improve the developer experience and allow you to do more with SQL in Sigma.
Now, SQL users can collaborate directly on the same workbook at the same time, even when writing the SQL itself; non-technical and technical users can see each other's work and iterate in real time.
By integrating the SQL editor into the workbook, technical users can leverage the best of SQL and the best of Sigma at the same time. You can instantly go from SQL to visualization—and soon, you’ll even be able to reference complex queries from any other data elements in the workbook.
---
Python and the updated SQL editor are coming soon.
Embedded Analytics
With Embedded Analytics, you can bring Sigma dashboards and charts into your own product, so that you can show your customers important data.
And now, we’re taking Embedded Analytics further than any other BI tool by bringing Explore mode and collaboration to the user experience.
This means that your customers have even more ways to engage with the reports and charts you provide them, so that they can get more value out of analytics in your product.
Explore Mode
Sigma, in the native experience, has an Explore mode that allows users to play around with the data without making copies of the original workbook.
And now, Explore mode is available in your embedded application, so that your customers can add new elements to perform their own analysis and make better, more data-informed decisions.
For example, your customers can change groupings on existing elements or update a pivot table so that their analysis is tailored precisely to their evolving needs and insights.
With Explore mode, you can empower your users to explore worry-free. They aren’t changing the dashboard itself—they’re just doing an exploration on top of the dashboard.
And with Explore mode now available for Embedded Analytics, you can also offer additional customer license options in your product, which creates more flexible paths to monetize your data.
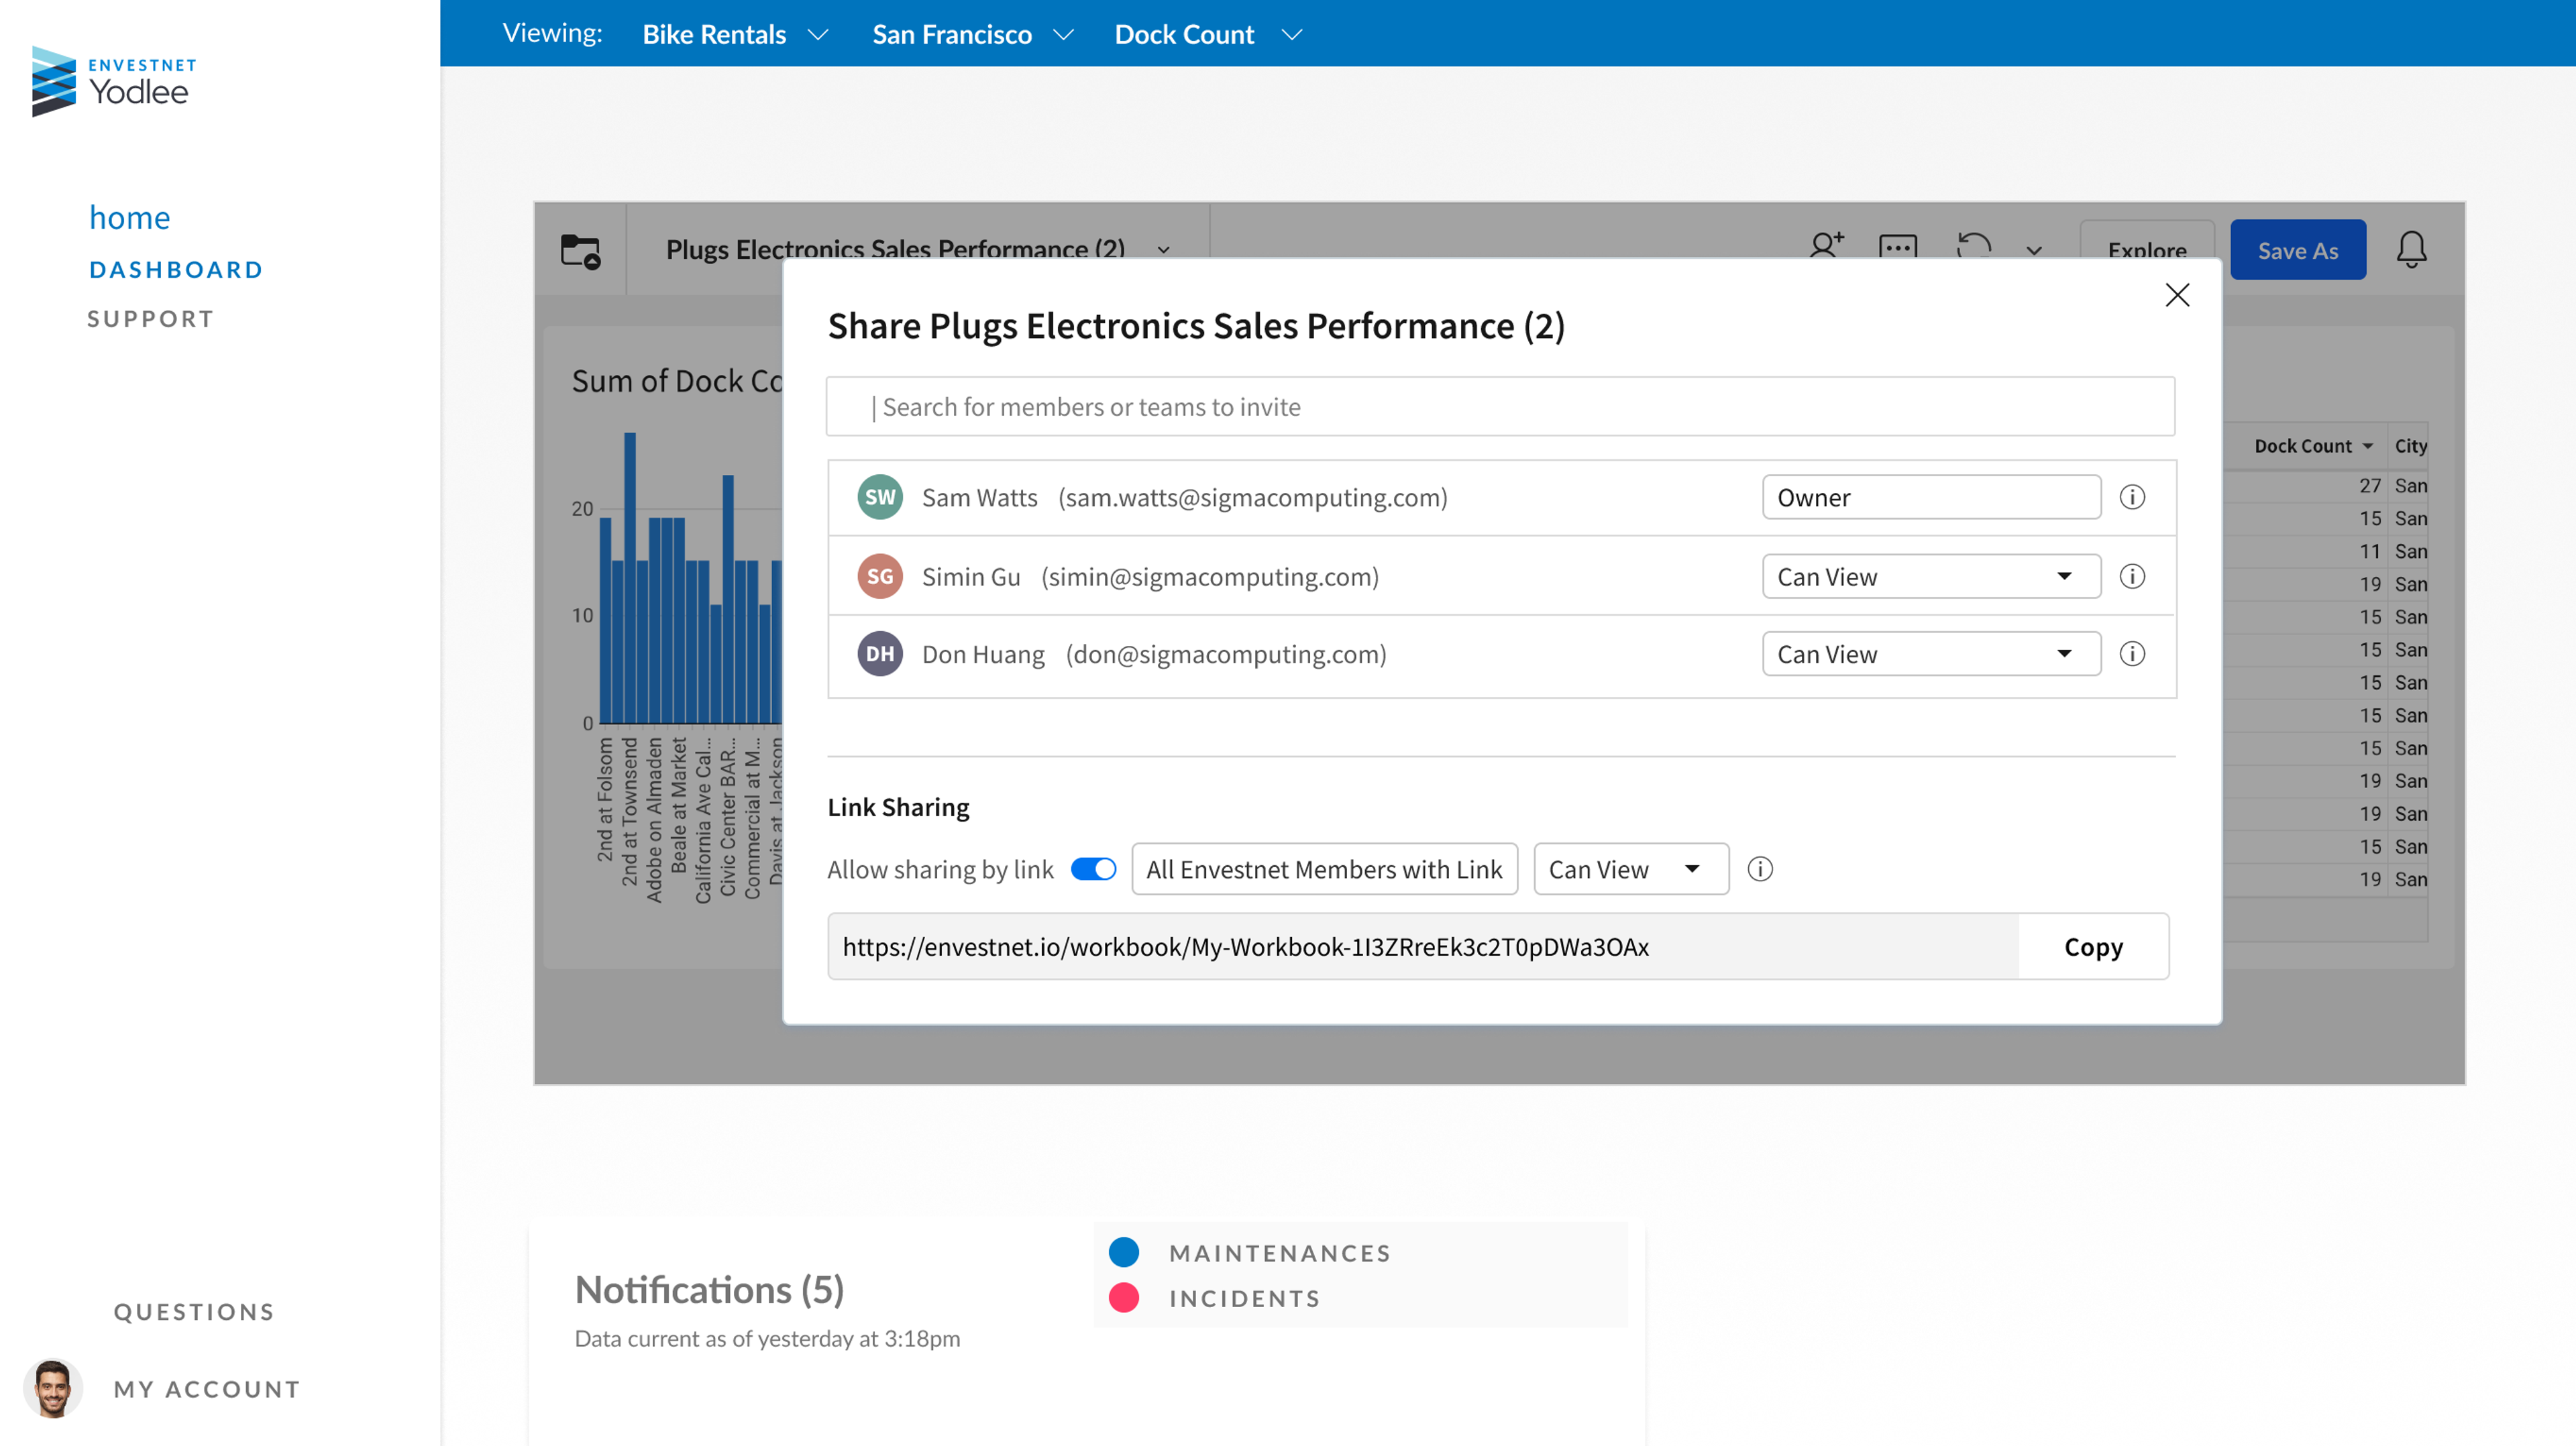
Collaboration
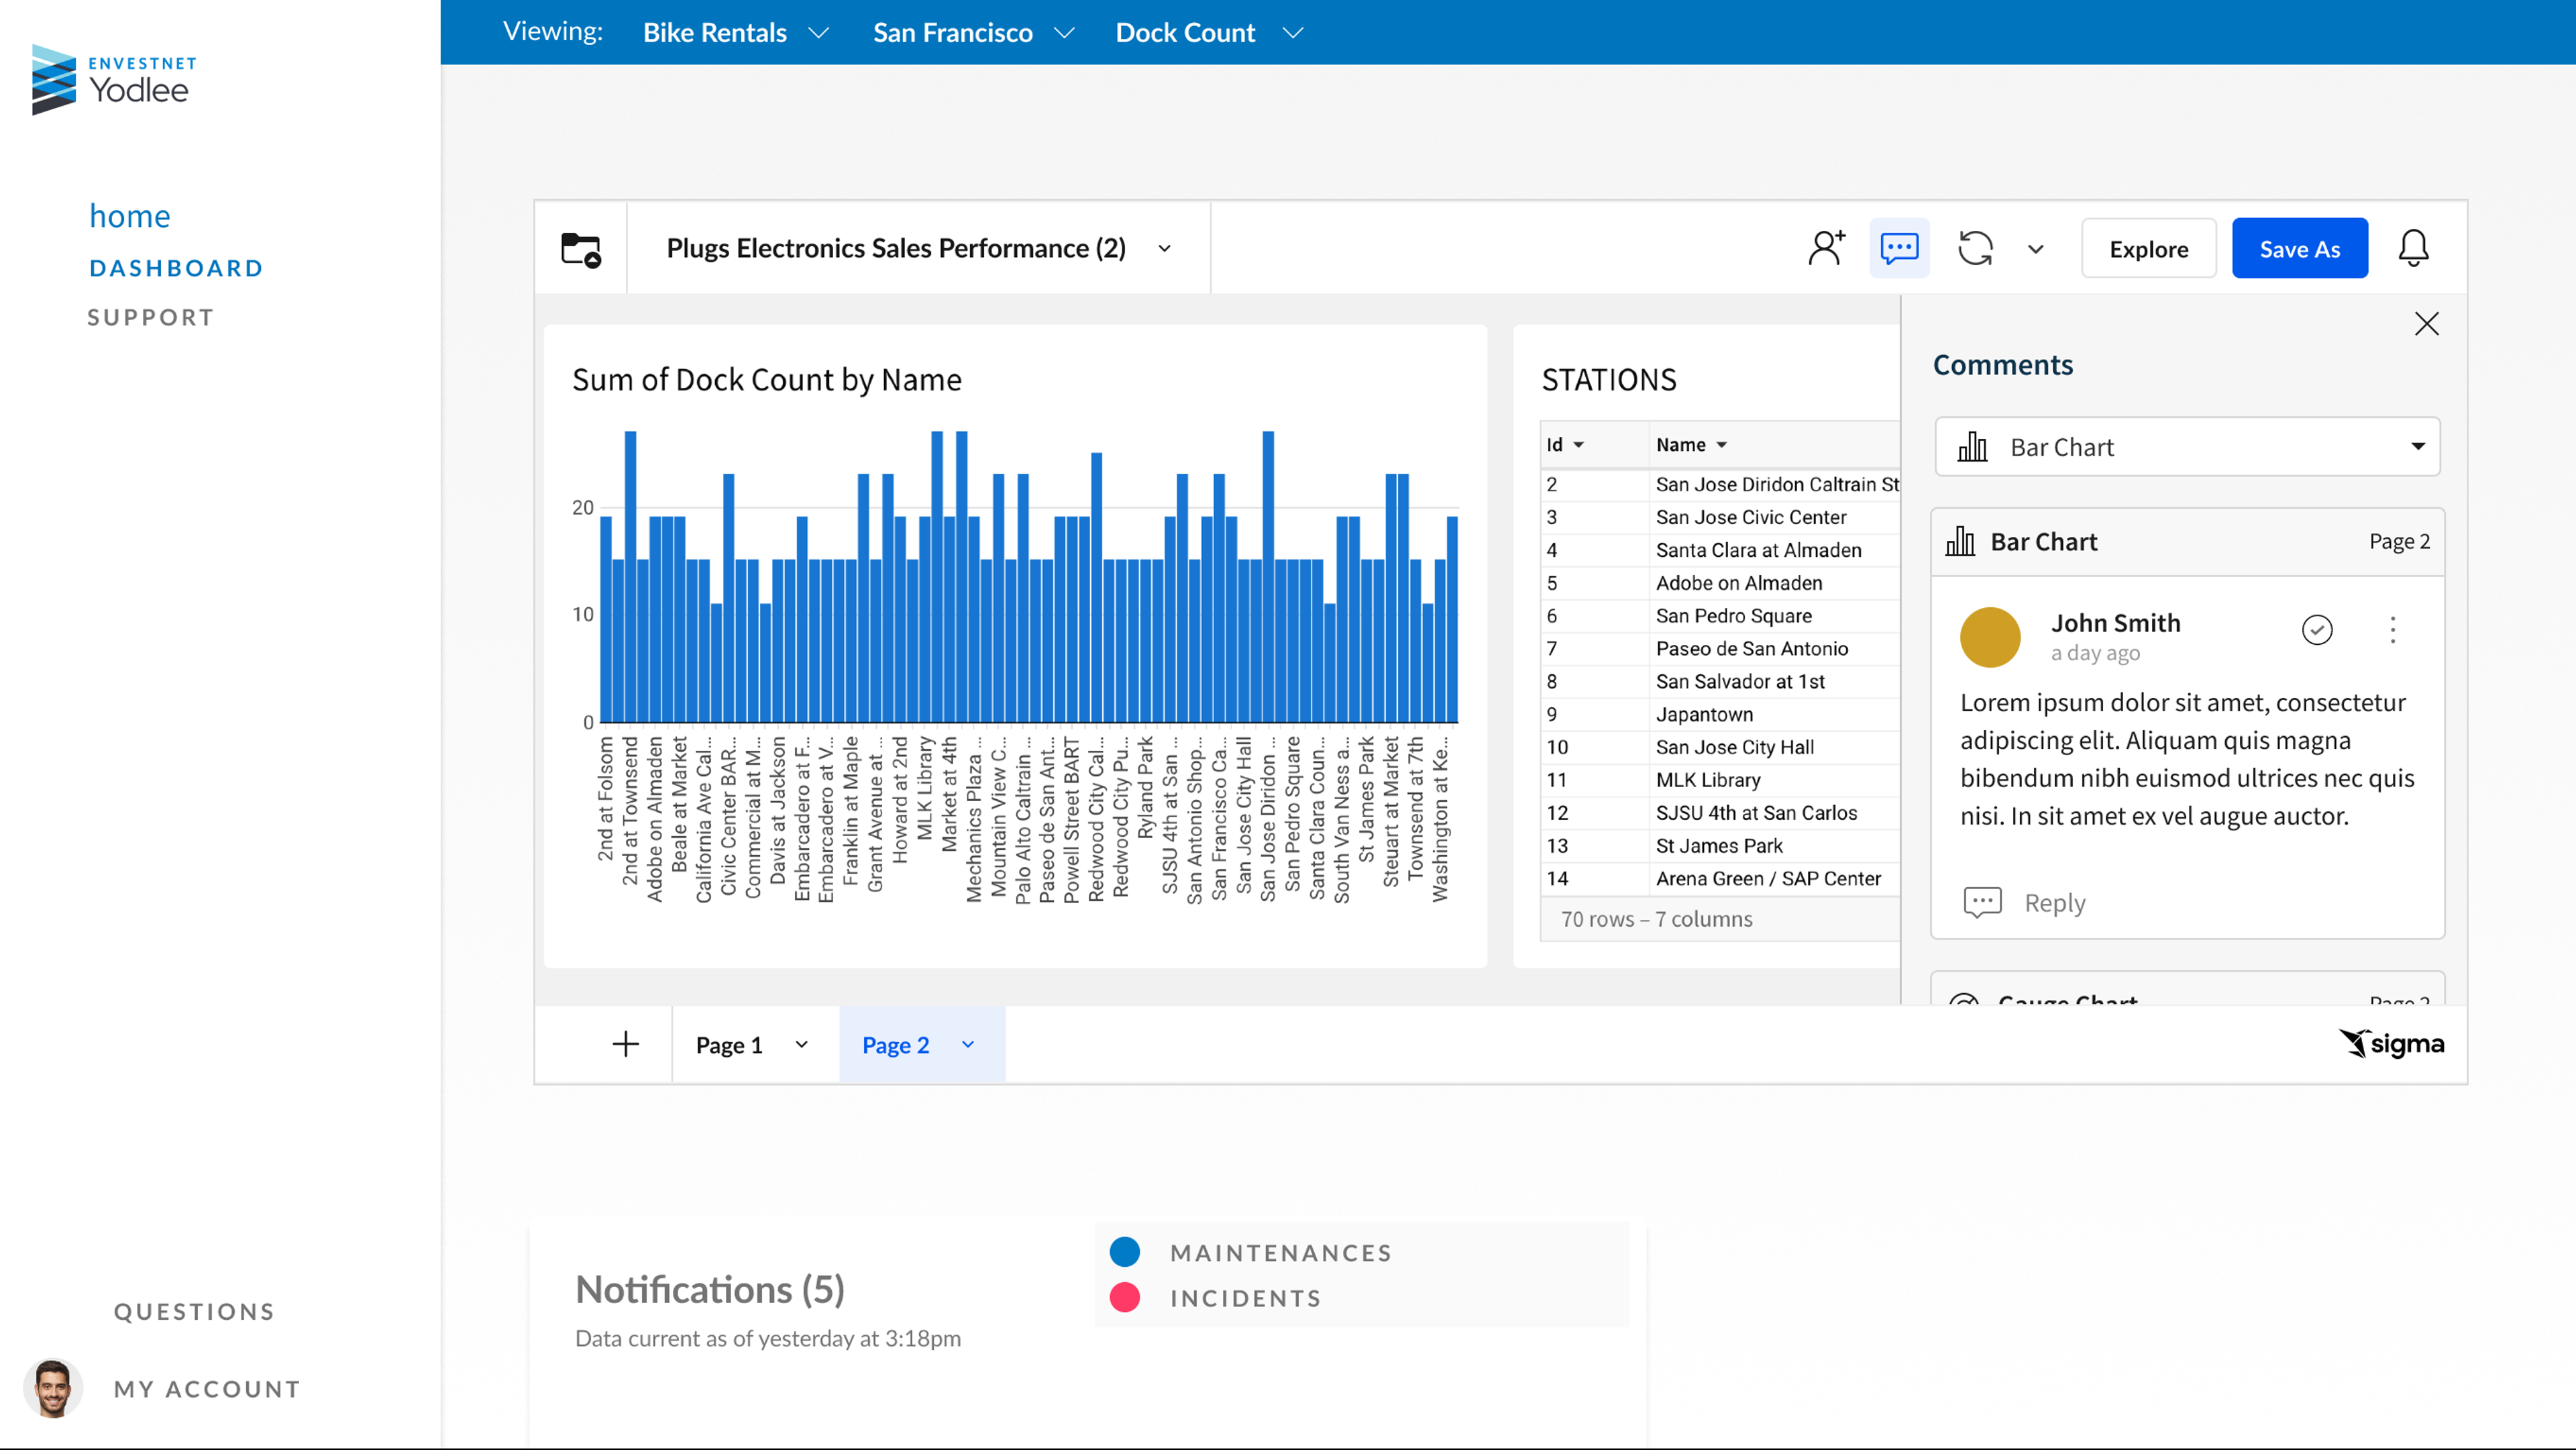
In Sigma, you can collaborate on data analysis in real-time across your entire business, ensuring immediate alignment and action. And now, your customers can collaborate on data with you. We make this possible with two key capabilities in the Embedded experience: sharing and comments.
Sharing
First we’re launching the ability to share in embedded environments. With sharing functionality, your customers can share the dashboards they create with other members of their organization and then collaborate on them, together in real-time.
Comments
Comments in Embedded Analytics allow your customers to provide context around visualizations or controls, solicit feedback and make requests. With the click of a button, they can add a quick comment or start a conversation about a workbook with their colleagues.
UI and UX enhancements
Finally, we’re adding new features to Sigma that make it even easier to present, share and analyze data.
Containers
Containers allow you to group any workbook elements together and make it very clear which visualizations, text, tables and more belong together. This way, anyone viewing a workbook can instantly understand which elements relate to each other.
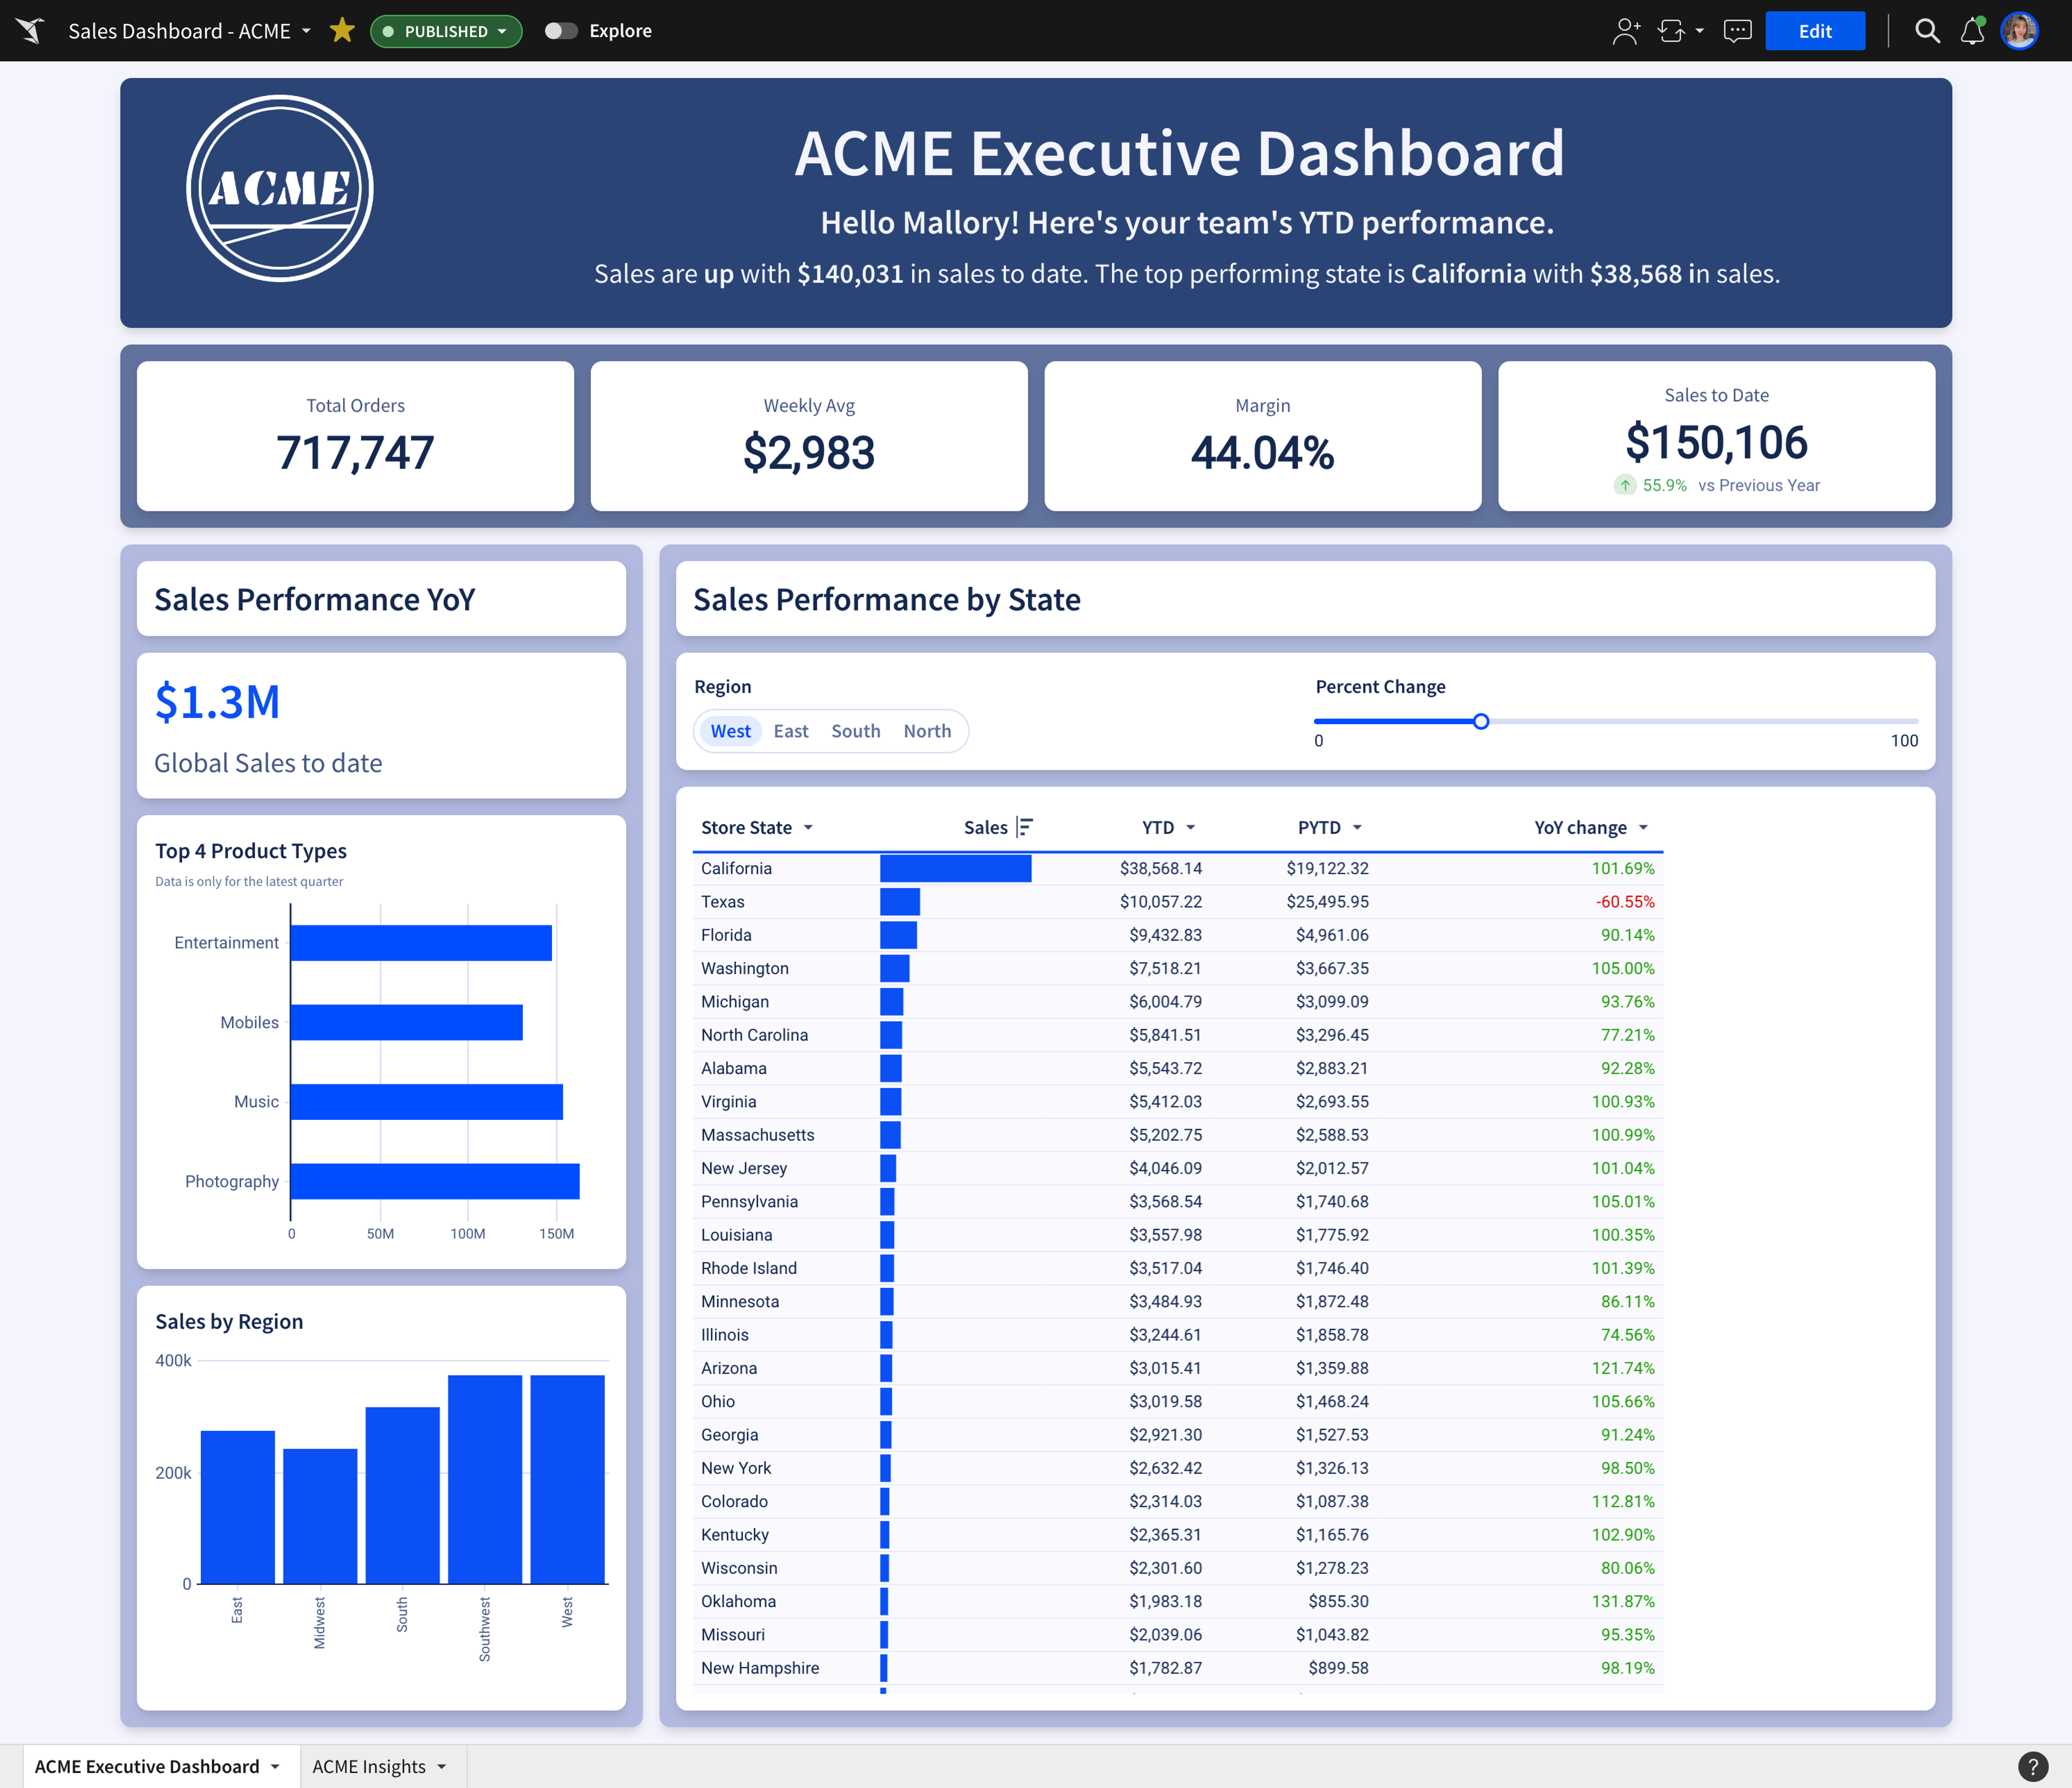
Table styling
New table styling in Sigma allows you to present data in an easy-to-understand format. You can go beyond the standard spreadsheet format to adjust cell spacing, choose whether to show grid lines, set background colors, customize headers and more.
Dynamic reports (AKA “bursting”)
Dynamic reports in Sigma allow you to send parameterized exports in bulk to your end users, whether they're internal stakeholders or your customers. You can create a single, standardized dashboard for all your customers or partners, and use bursting to send a separate copy with the right data to each recipient.
There’s no more creating unique dashboards for each customer, or manually creating hundreds of separate PDFs. You can think of this as mail-merge for your dashboards and reports. You may have heard of this referred to as “report bursting.”
New export functionality
We’re also adding more export options to Sigma. You can now export all tabs of a workbook into a single PDF download. You can also choose to export data in your preferred format to whatever destination you choose, from s3 to Excel to Google Drive.
Waterfall charts
Waterfall charts are a great tool for managing budgets, tracking inventory and analyzing financial performance. And now, you can use them in Sigma to quickly produce a chart that illustrates the differences between actual, planned and forecasted data.
You can display data in percent or absolute values, add clean data labels, include a reference line that separates present and future values, and decide whether an increase is displayed as a positive or negative on the waterfall chart.
For even more customization, add color formatting to indicate the start, end, total, positive and negative data points.
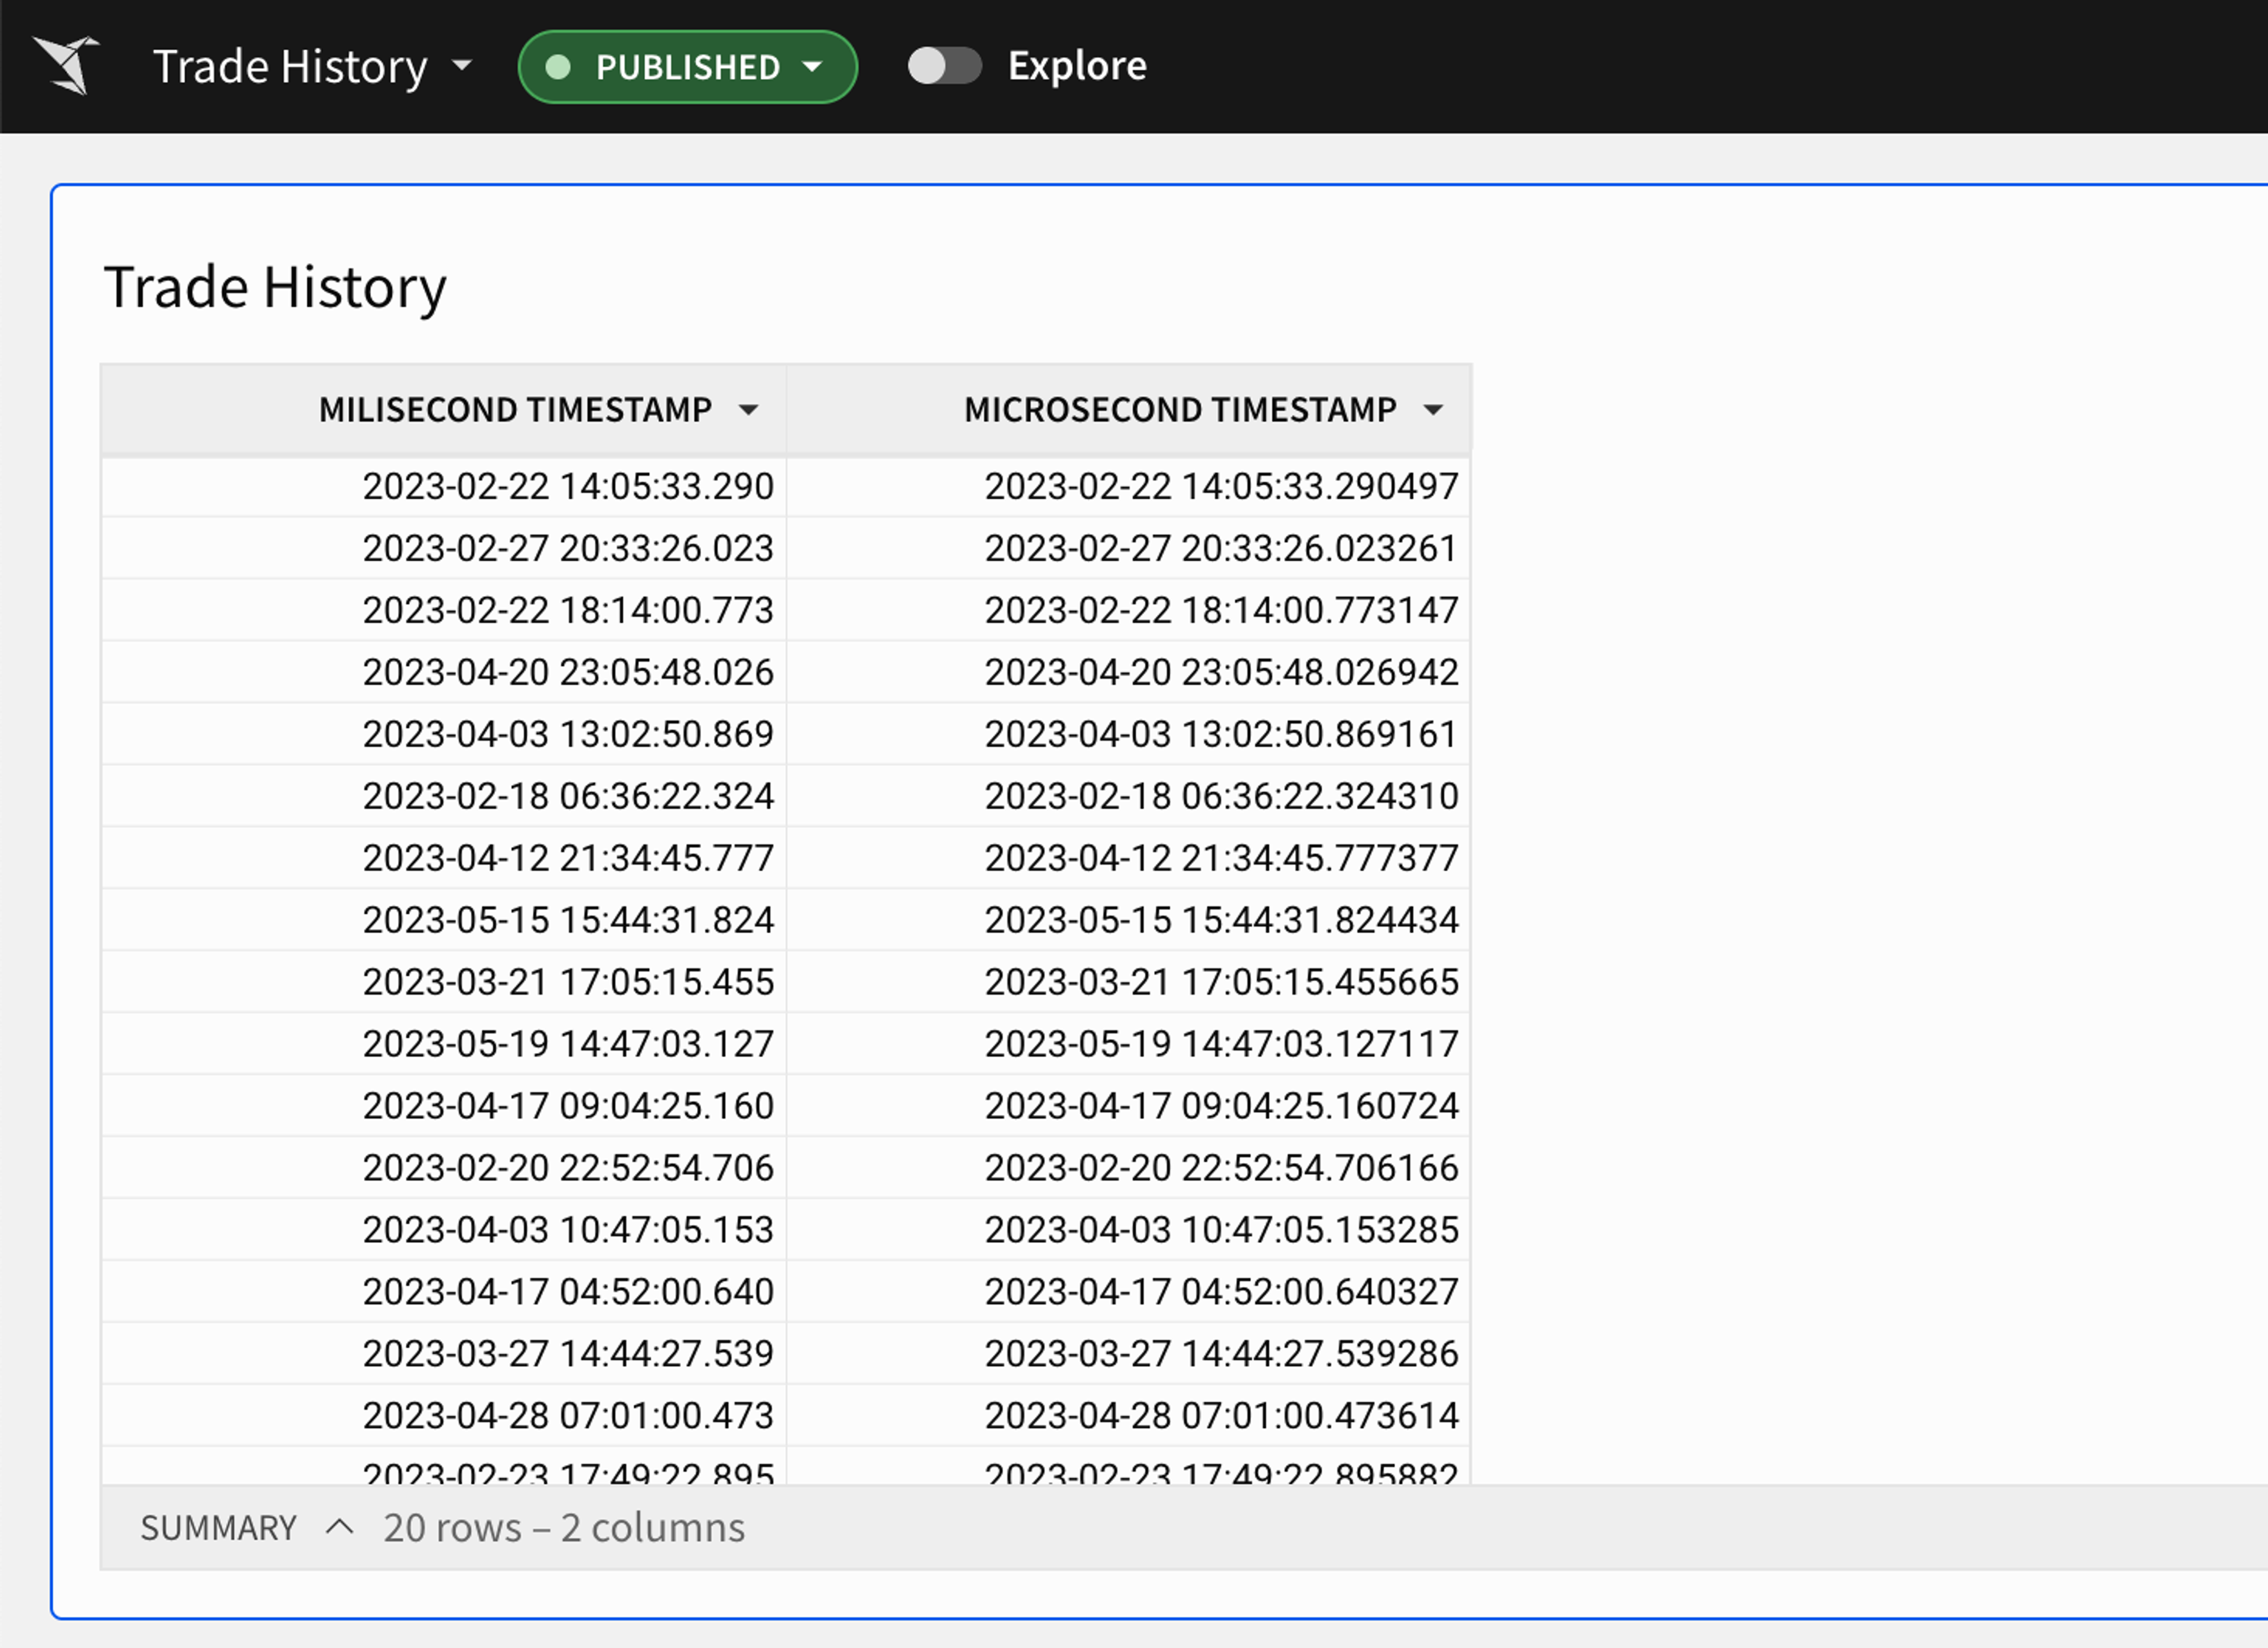
Microsecond reporting
We’ve also enhanced Sigma with another feature that’s great for financial analysis: microsecond reporting.
To use microsecond reporting in Sigma, simply select the date and time option in a table. If microsecond data is stored in your cloud data platform, you’re all ready to go. You can filter, sort and export this granular data.
Stay tuned for our next batch of product updates
Our Sigma team is always shipping new updates to help your organization collaborate on data, but with the enterprise-grade trust and speed that you need to operate at scale.
It’s why Sigma has become the industry standard for BI and analytics, from the Fortune 10 to the 10-person company. We’re laser-focused on customer feedback, and building what you need to take your data to the next level.
If you liked what you saw in this post, reach out to our team to get a custom demo of Sigma. And keep up to date with what’s new by following Sigma on LinkedIn or joining our team at a live event.
We’re always shipping new innovations, so keep in touch with Sigma as we continue to push the BI and analytics industry forward.