What Embedded Analytics Usage Data Reveals about Churn Risk and Expansion

When you embed analytics into your product, the value flow seems clear: your customers get better visibility into their data. What's less obvious is that you get something in return. Every dashboard load, every export, every time a user pushes past a pre-built view to explore the underlying data, or stops short of it, is a data point about how much that customer depends on what you've built.
Many B2B SaaS companies don't leverage that record. They use their embedded analytics layer to serve customers, and separately manage retention through support tickets, NPS scores, and quarterly check-ins. The behavioral signal sitting between those two systems goes unused.
The companies that connect their analytics layer to their retention workflows have a meaningful advantage. When a customer starts substituting your analytics with a spreadsheet, you can know about it before the renewal conversation. When a customer's usage depth has outgrown their current tier, you can have the expansion conversation before they come to you frustrated. The data to do both already exists in your analytics layer. The question is whether you're reading it.
This article covers four signal categories, two for churn risk and two for expansion readiness, and what it takes to route them to the teams who can act.
How does Sigma capture embedded analytics usage data?

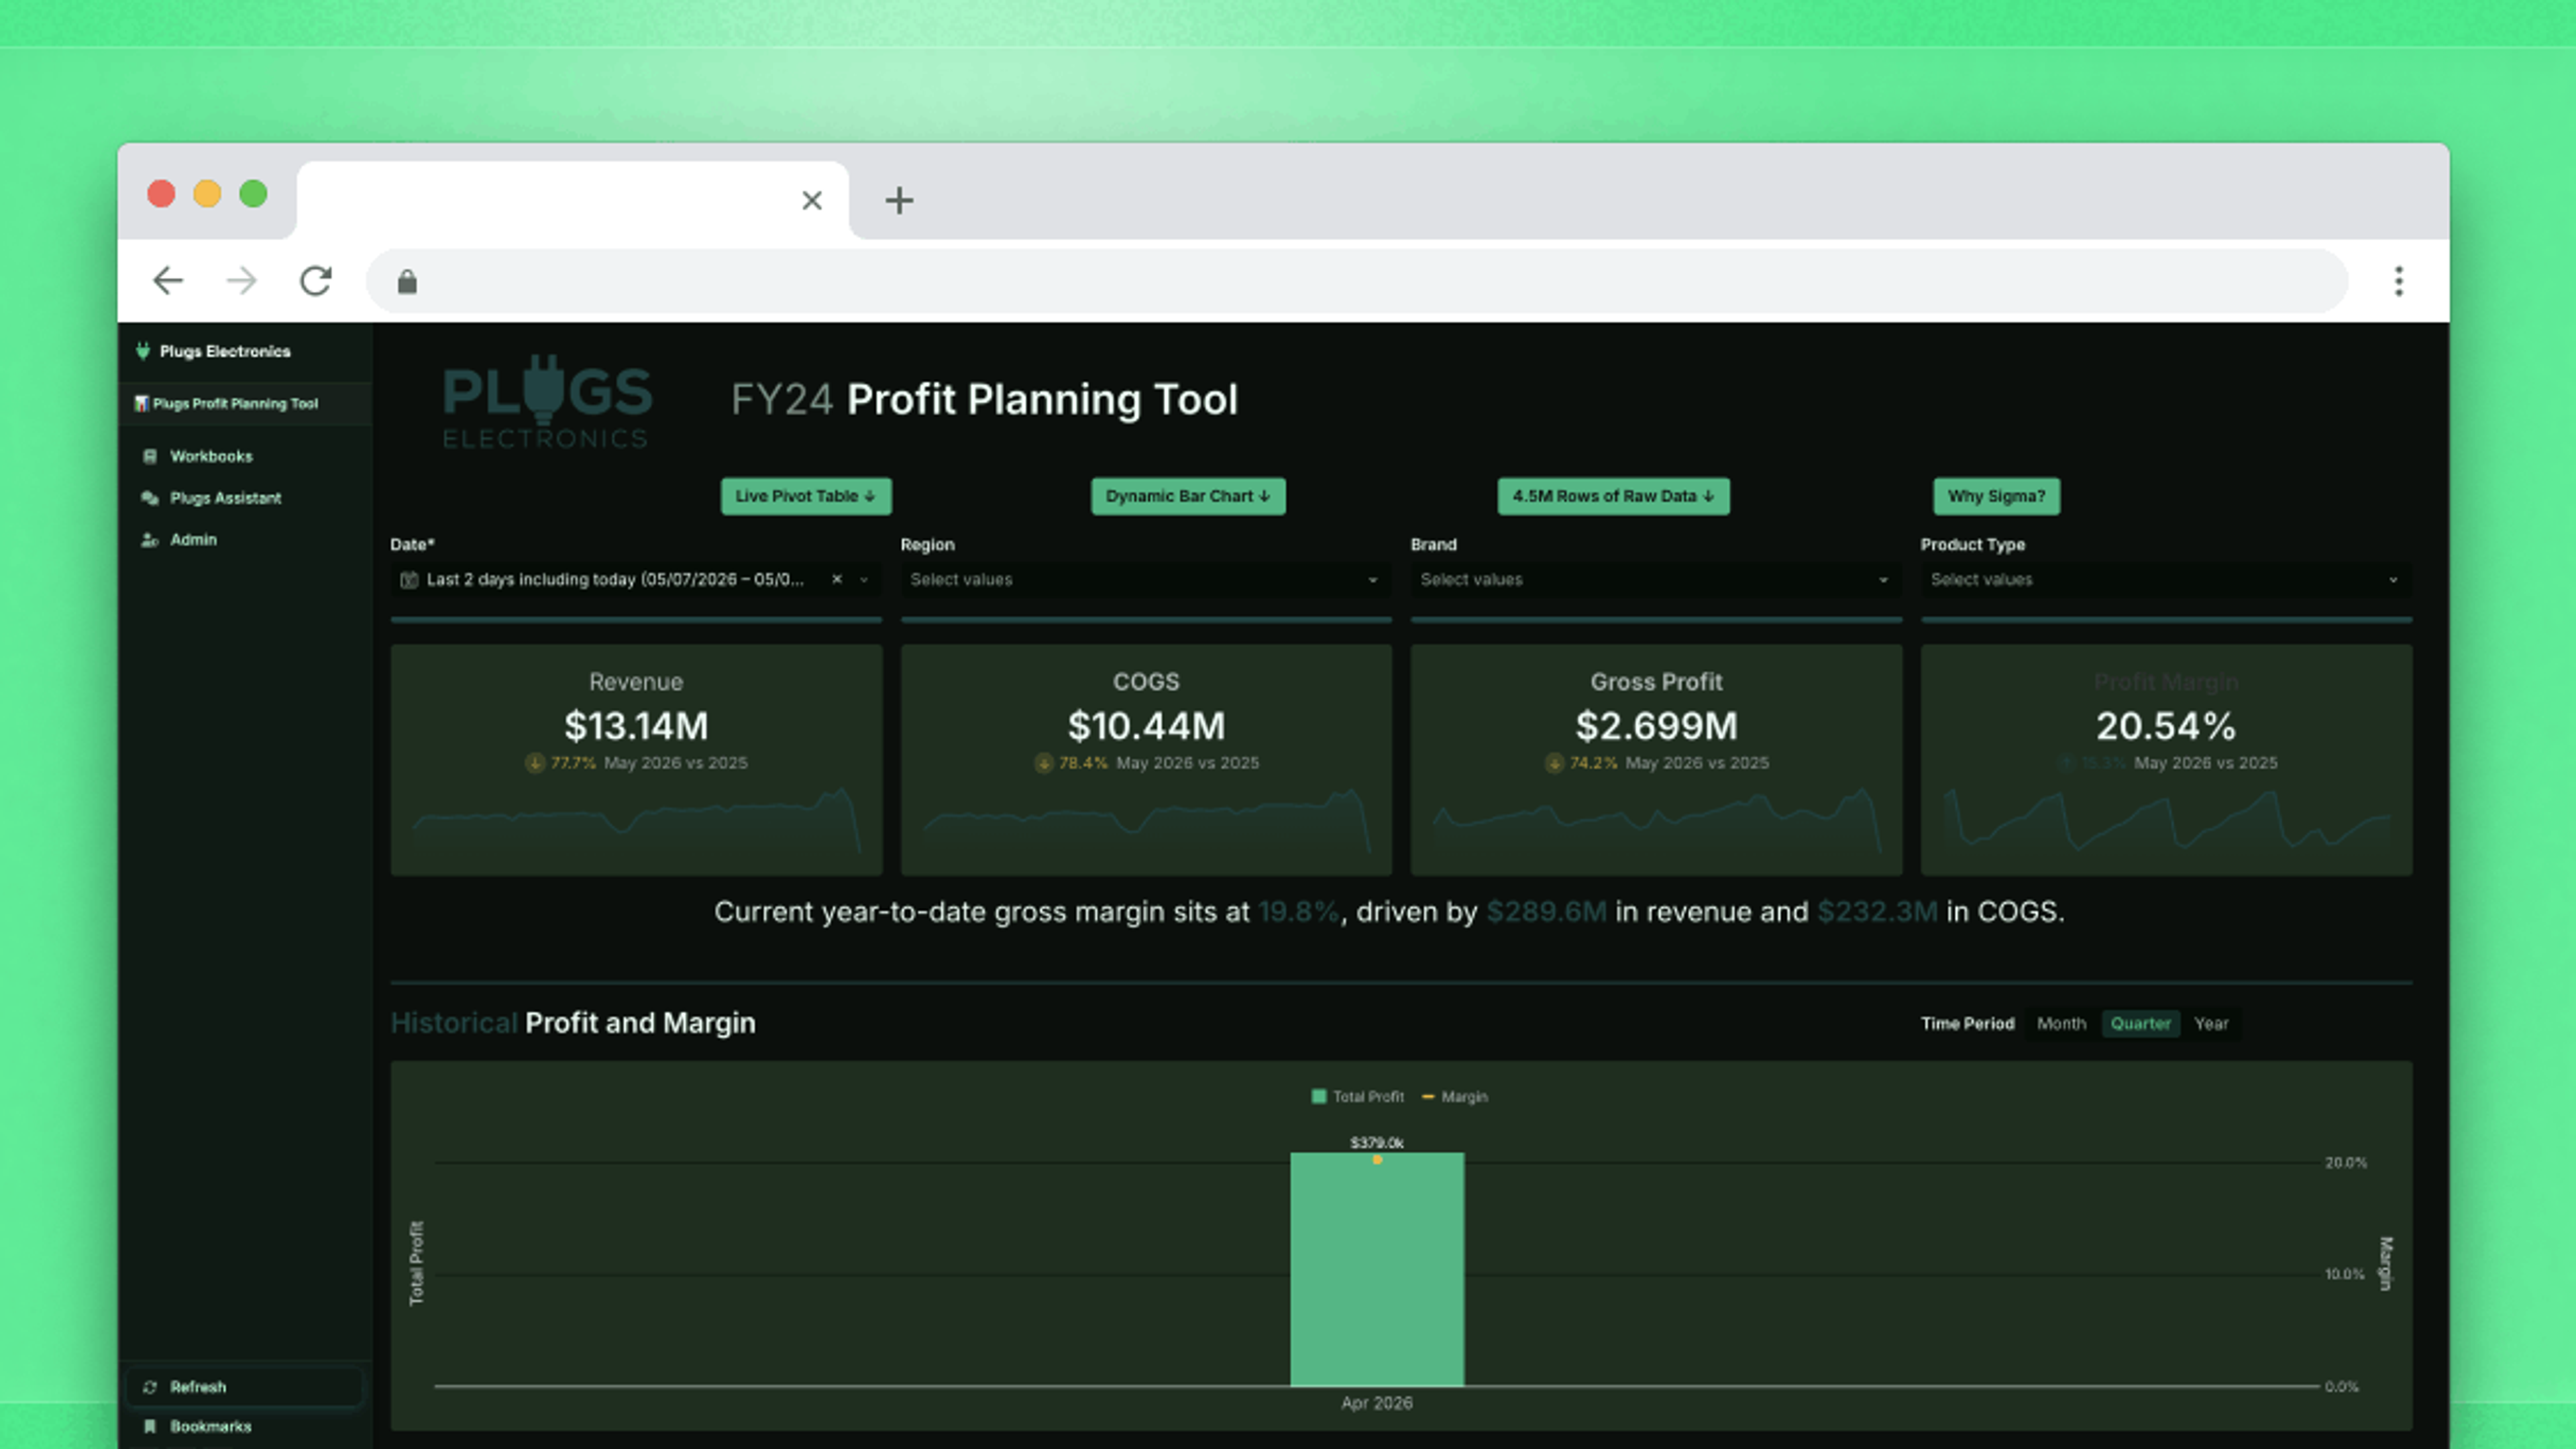
Sigma’s native usage dashboard gives teams visibility into embedded analytics adoption, engagement trends, and user activity over time across their organization.
Before getting into what to look for, it's worth being concrete about where the data lives. Sigma's native usage dashboard, available in every org, captures document activity events, queries, exports, and filtering interactions. There's an embed-specific tab within that dashboard for monitoring end-user behavior separately from internal Sigma usage. For organizations with audit logging enabled, admins can go further and build fully custom workbooks on top of audit log data, treating usage events as a queryable source the same way they'd query any other warehouse table. Audit logging is a premium feature that requires activation, but the usage dashboards are available to all orgs by default.
The signals described in the rest of this piece are drawn from that instrumentation layer. The usage dashboards alone are enough to get started.
What does declining dashboard activity reveal about churn risk?
The most straightforward churn signal is a drop in dashboard view rates, especially when that drop tracks across multiple users within the same account. A single user going quiet can have a dozen explanations. When view rates fall organization-wide over a sustained period, the account has stopped finding value in your analytics layer at a product level.
Sigma lets you build a dedicated churn and expansion workbook on top of your live warehouse data. No exports, no refresh delays. Track ARR movement, account engagement and usage trends in one place, and drill into any account the moment something shifts.
A related disengagement signal is subtler and easier to miss. When users have access to self-service exploration and never use it, loading pre-built dashboards and stopping there, the analytics layer isn't embedded in how they actually work. It functions as a reporting tab they check occasionally, which means switching costs are low and there's little at stake in renewal.
Before acting on either signal, it's worth asking whether the problem is the offering rather than the customer. Users who can only view pre-built dashboards and aren't engaging may be telling you that those dashboards don't answer the questions they're actually asking. Understanding which is true changes how you respond. A coverage gap calls for a different conversation than a disengaged account.
How do CSV export patterns signal that customers are working around your product?
When a user downloads a CSV and closes the session without doing anything else, the analytics layer didn't answer the question they came with. They took the raw data somewhere else to find the answer, probably a spreadsheet. When that becomes a pattern—high download volume, short sessions, little or no filtering—the customer has built a workflow outside your product rather than inside it.
Not every export points in the same direction, though. Sigma supports exports to Slack, Microsoft Teams, SharePoint, email, webhooks, and cloud storage in addition to file downloads. A user who sends a weekly summary to a Slack channel for a company all-hands is sharing data as part of an active workflow, not pulling it out of your product. The version worth watching is the download-and-exit pattern: users pulling files with no meaningful in-product activity before or after.
Which embedded analytics behaviors predict expansion readiness?
High query volume and frequent return visits signal that your analytics layer has become operationally necessary to a customer. When users are running queries regularly and building on previous sessions rather than starting from scratch each time, analytics has moved from something they check to something they depend on.
A more direct expansion signal sits one level above that: customization and saved views. A user who has built their own workbooks, saved their own filter sets, or created views their colleagues return to has made a real investment in your analytics layer. The work they've done inside your product has value they'd have to recreate somewhere else. Those accounts carry meaningful switching costs and have often already outgrown their current tier before the expansion conversation formally starts.
Amplitude's 2025 Product Benchmark Report, which draws on anonymized data from more than 2,600 companies, found that 69% of top performers in seven-day activation also ranked among the top performers in three-month retention, showing a strong link between early depth of engagement and long-term staying power. The report's analysis of B2B technology products specifically calls out product usage signals as a driver of expansion, noting that top-performing B2B companies use those signals to guide users toward value and drive upsell conversations.
OpenView's 2023 SaaS Benchmarks Report, surveying more than 700 SaaS companies, identified expansion within the existing customer base as one of the three primary drivers of efficient growth in a tighter market, alongside product-led growth and operational improvements. For embedding companies, that expansion comes from knowing which accounts are ready before they ask, and usage data is how you know.
How do permission boundary hits identify accounts ready to expand?
Permission boundary hits are self-explanatory. When a user tries to access a feature or dataset beyond their current permissions, that's a documented, real-time expression of demand. A survey or NPS score captures intent at a lag; a blocked action captures it in the moment of actual work.
A single permission boundary hit from a power user is worth noting, but a cluster of access attempts across multiple users in the same account is an even stronger signal. When enough people in an account have independently hit that ceiling, the account has outgrown its current tier as an organization.
How do you route embedded analytics usage signals to the teams who can act?
Finding a signal is the easier half of the problem. Getting it to the right person at the right moment is where most companies stall. Gainsight and Benchmarkit's research on AI in customer success found that 73% of CS professionals identified the ability to detect at-risk customers as a top automation opportunity, on par with CSM productivity. Most CS teams already understand that earlier signals would improve their retention and expansion numbers. The gap is instrumentation: those signals often aren't in the systems where CS does its daily work.
Sigma's usage and audit log data is queryable in the same environment you're already using to serve customers, which means your CS and product teams can work from the same instrumentation layer. Admins can build internal workbooks that surface account-level engagement patterns across view rates, query volume, export behavior, and exploration activity, and route them to the people who can act.
Once that data is flowing, each signal type points toward a different kind of conversation. Declining view rates and zero exploration activity call for a check-in on whether the customer is getting value and whether the analytics offering needs to change. A rising download-to-exploration ratio raises a more specific question: what are users trying to answer that they can't answer inside the product? High query volume, customization activity, and access requests all indicate an account with more demand than its current tier supports.
Astronomer, the data orchestration platform, used Sigma internally to identify early indicators of customer success. They found that getting customers to certain product engagement thresholds within a defined window predicted whether those customers would succeed long-term — if momentum wasn't established early, it rarely came back. That insight, which Astronomer likens to Facebook's "seven friends in ten days," directly shaped their onboarding improvements and product-led growth initiatives. They then embedded those same internal Sigma dashboards into the Astronomer product as a customer-facing control panel, giving customers visibility into their own data infrastructure health.
Mindbody, which operates in a high-churn industry, describes its embedded analytics offering as both a competitive differentiator that wins new customers and a retention mechanism that reduces churn. The richness of their data products, in their own words, took them "from a laggard in the market to a leader," creating sales traction and increasing product stickiness.
Every account that churns without warning is a signal that arrived too late, or never reached the right person. The behavioral record your analytics layer generates doesn't care either way. It exists regardless of whether anyone is reading it. The practical question is whether you have a systematic way to surface the signals in this piece, and a clear owner for acting on each one. That starts with an internal view of your embedded usage data. If you don't have one, it's the right place to begin.
Request a demo to see how Sigma’s embedded analytics can work for your product.
Frequently asked questions
What is an embedded analytics churn signal?
An embedded analytics churn signal is a behavioral indicator — drawn from dashboard view rates, export patterns, or exploration activity — that a customer is losing engagement with your analytics layer. The most reliable signals are account-wide patterns that develop over time, not isolated actions from a single user.
What embedded analytics usage patterns indicate a customer is at risk of churning?
Two patterns carry the strongest signal. The first is declining dashboard engagement across multiple users in the same account, indicating the analytics layer isn't answering questions that matter organizationally. The second is high export volume with minimal in-product exploration: when users consistently export data without interacting with it first, they've built a workflow outside your product.
What's the difference between a churn risk signal and an expansion signal in embedded analytics?
Churn risk signals indicate weakening dependency: users doing less inside the product or routing around it. Expansion signals indicate usage has deepened to where the current tier is becoming a ceiling. High query volume, saved views, custom workbooks, and access requests all point toward expansion. Churn signals reflect declining stakes; expansion signals reflect demand that has outgrown the current tier.
Why do heavy CSV exports indicate churn risk in an embedded analytics product?
A user who consistently exports raw data and exits has substituted your analytics layer with a spreadsheet. Over time, as that external workflow becomes established, the embedded layer becomes a data source rather than a product they work inside, which means low stakes in retaining it. Directed exports to Slack or Teams are a different signal: they indicate the analytics layer is integrated into how the customer operates.
How can B2B SaaS companies use permission boundary data to identify expansion opportunities?
When a user tries to access a feature or dataset beyond their permissions, that intent is documented in the moment of actual work. When those attempts cluster across multiple users in the same account, the account has organizationally outgrown its current tier. Where Sigma's nav bar is enabled in an embedded context, the "Request explore access" option surfaces this demand explicitly and creates a documented record of who wants more.
How do B2B SaaS companies act on embedded analytics usage signals without adding new tools?
The usage and audit log data your Sigma embedded analytics layer generates is queryable in the same environment you're already operating in. Admins can build internal workbooks that surface account-level engagement patterns, including view rates, query volume, export behavior, and exploration activity, for CS and product teams to work from. The instrumentation already exists. The work is in building the internal view and assigning ownership of each signal type.