How We Built a Churn Prediction ML Engine in Sigma: From POC to Production
Retaining customers is an essential driver of growth for any SaaS business. Strong retention naturally limits churn risk, which is the likelihood that the customer will drop off or stop using the product. Yet for many Customer Success (CS) teams, identifying churn risk still relies on time-consuming, manual research and scattered qualitative signals.
At Sigma, we set out to change that by using Sigma as the primary engine for data prototyping, exploration, and collaboration during the proof of concept (POC) phase of our churn prediction project. The outcome is a scalable framework for quantifying account health, surfacing early warning signals, and empowering CS teams to act before churn becomes irreversible.
The challenge
The CS team plays a critical role in driving product adoption, expanding usage, and retaining customers. However, achieving these goals requires significant time and effort due to a lack of:
- Standardized health scores across accounts
- Early-warning indicators for churn
- A proactive prioritization system
As a result, the CS team becomes reactive instead of proactive. Based on our historical data analysis, almost 40% of churn resulted from the following specific, addressable factors: product adoption, pricing concerns, champion churn, and feature gaps. Although these signals all appeared in telemetry, they were not surfaced in a clear or systematic way.
Drawing on subject matter expert (SME) experience and historical patterns, we estimated that earlier risk detection could help us retain as many as 70% of the at-risk customers whom we realistically have influence over. These are customers who typically churn for reasons that can be mitigated when we catch them early.
The project goal
To address the challenge of improving churn risk detection, our data team’s goal was to build a churn prediction system to:
- Detect unhealthy accounts early
- Score and prioritize accounts for proactive CS action
- Surface leading churn indicators
- Allow rapid iteration & feedback loops with the CS team
And we wanted to achieve all of this in under 3 months—much faster than the typical 4-6 month ML lifecycle—without sacrificing quality.
Sigma’s critical role in the POC phase
The POC phase was not just a technical experiment; it was a collaborative discovery process between the Data and CS teams. Sigma was the key to accelerating the project because it enabled the following workflows:
1. Fast data prototyping & exploratory data analytics (EDA)
- Drag-and-drop exploration of dozens of telemetry features
- Instant drill-down into user- and event-level data
- No waiting on dashboards or code deployments
- Intuitive charts to guide stakeholder conversations
One of the biggest accelerators in the POC phase was Sigma’s ability to support fast, iterative data prototyping and exploratory analysis without the typical constraints of development cycles. Because everything was instantly visualizable and shareable, we were able to dive deep into patterns, validate assumptions in real time, and uncover insights that would have taken weeks in a traditional workflow.
Sigma made it incredibly easy to slice telemetry and usage data at any level of granularity—org, user, license, feature, or event, which allowed us to quickly spot:
- Unexpected usage spikes or dips and correlate them with specific behaviors or product surfaces
- Seasonal or cyclical patterns in engagement
- License segments contrasted with deployment counts
- Key workflows where champion activity fell off before churn or usage decline
This helped us quickly and effectively iterate on our hypotheses. As part of this exploration, we uncovered and resolved several data quality issues that would have undermined the modeling effort if left unseen.
With Sigma’s shared workbooks and Input Tables, EDA became a live, collaborative process. We reviewed anomalies with SMEs in real time, captured their insights directly in the workbook, and quickly identified unusual patterns. These patterns could tell us immediately, “Yes, this makes sense–this is exactly when the champion left,” or “that drop in usage shouldn’t exist. Let’s check and see if telemetry tracked this event correctly.”
2. Instant ML-ready data in the cloud data warehouse
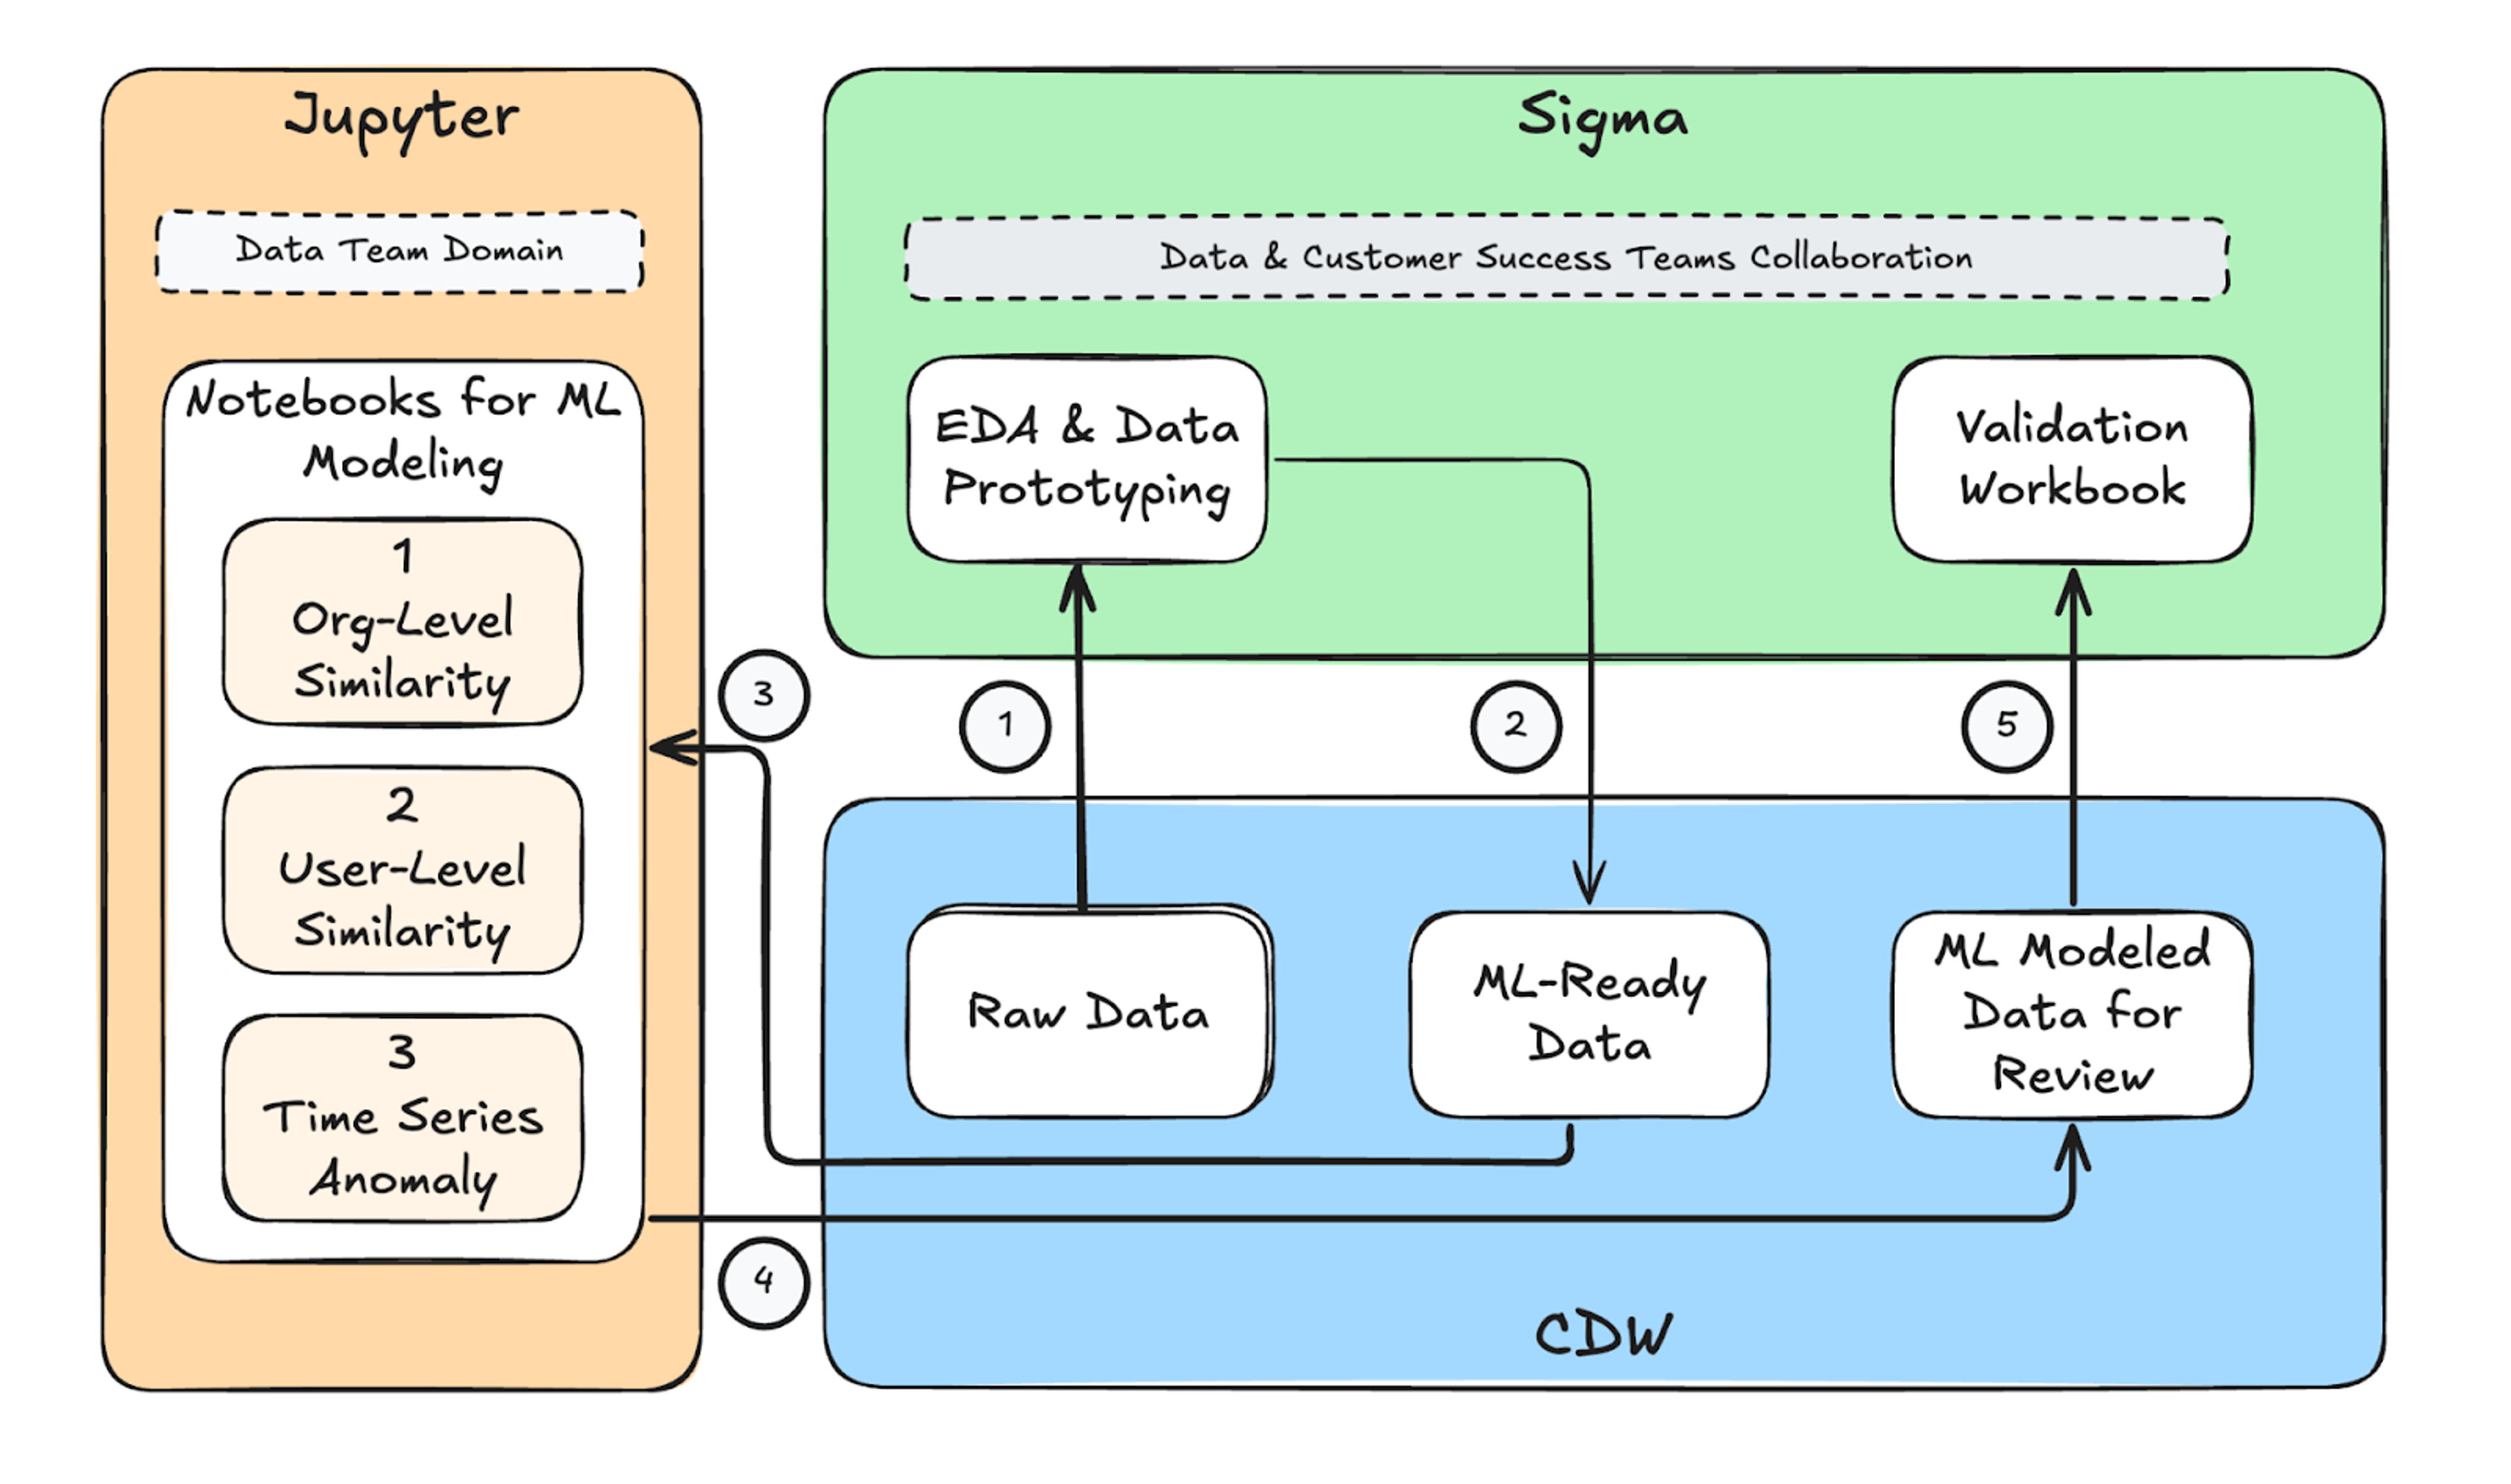
We engineered features directly in Sigma, using both the visual UI and SQL, without waiting on new tables, pipelines, or dashboards. Then, with a few clicks, we set up the transformations as CDW (cloud data warehouse) views that could be pulled directly into Jupyter Notebooks for Python-based model training and predictions, testing and benchmarking, and rapid iterations. The result was a frictionless loop in which data exploration, transformation, and modeling remained tightly connected.
This workflow meant no back-and-forth engineering cycles, just immediate iteration.
3. Rapid experimentation & model feedback loop
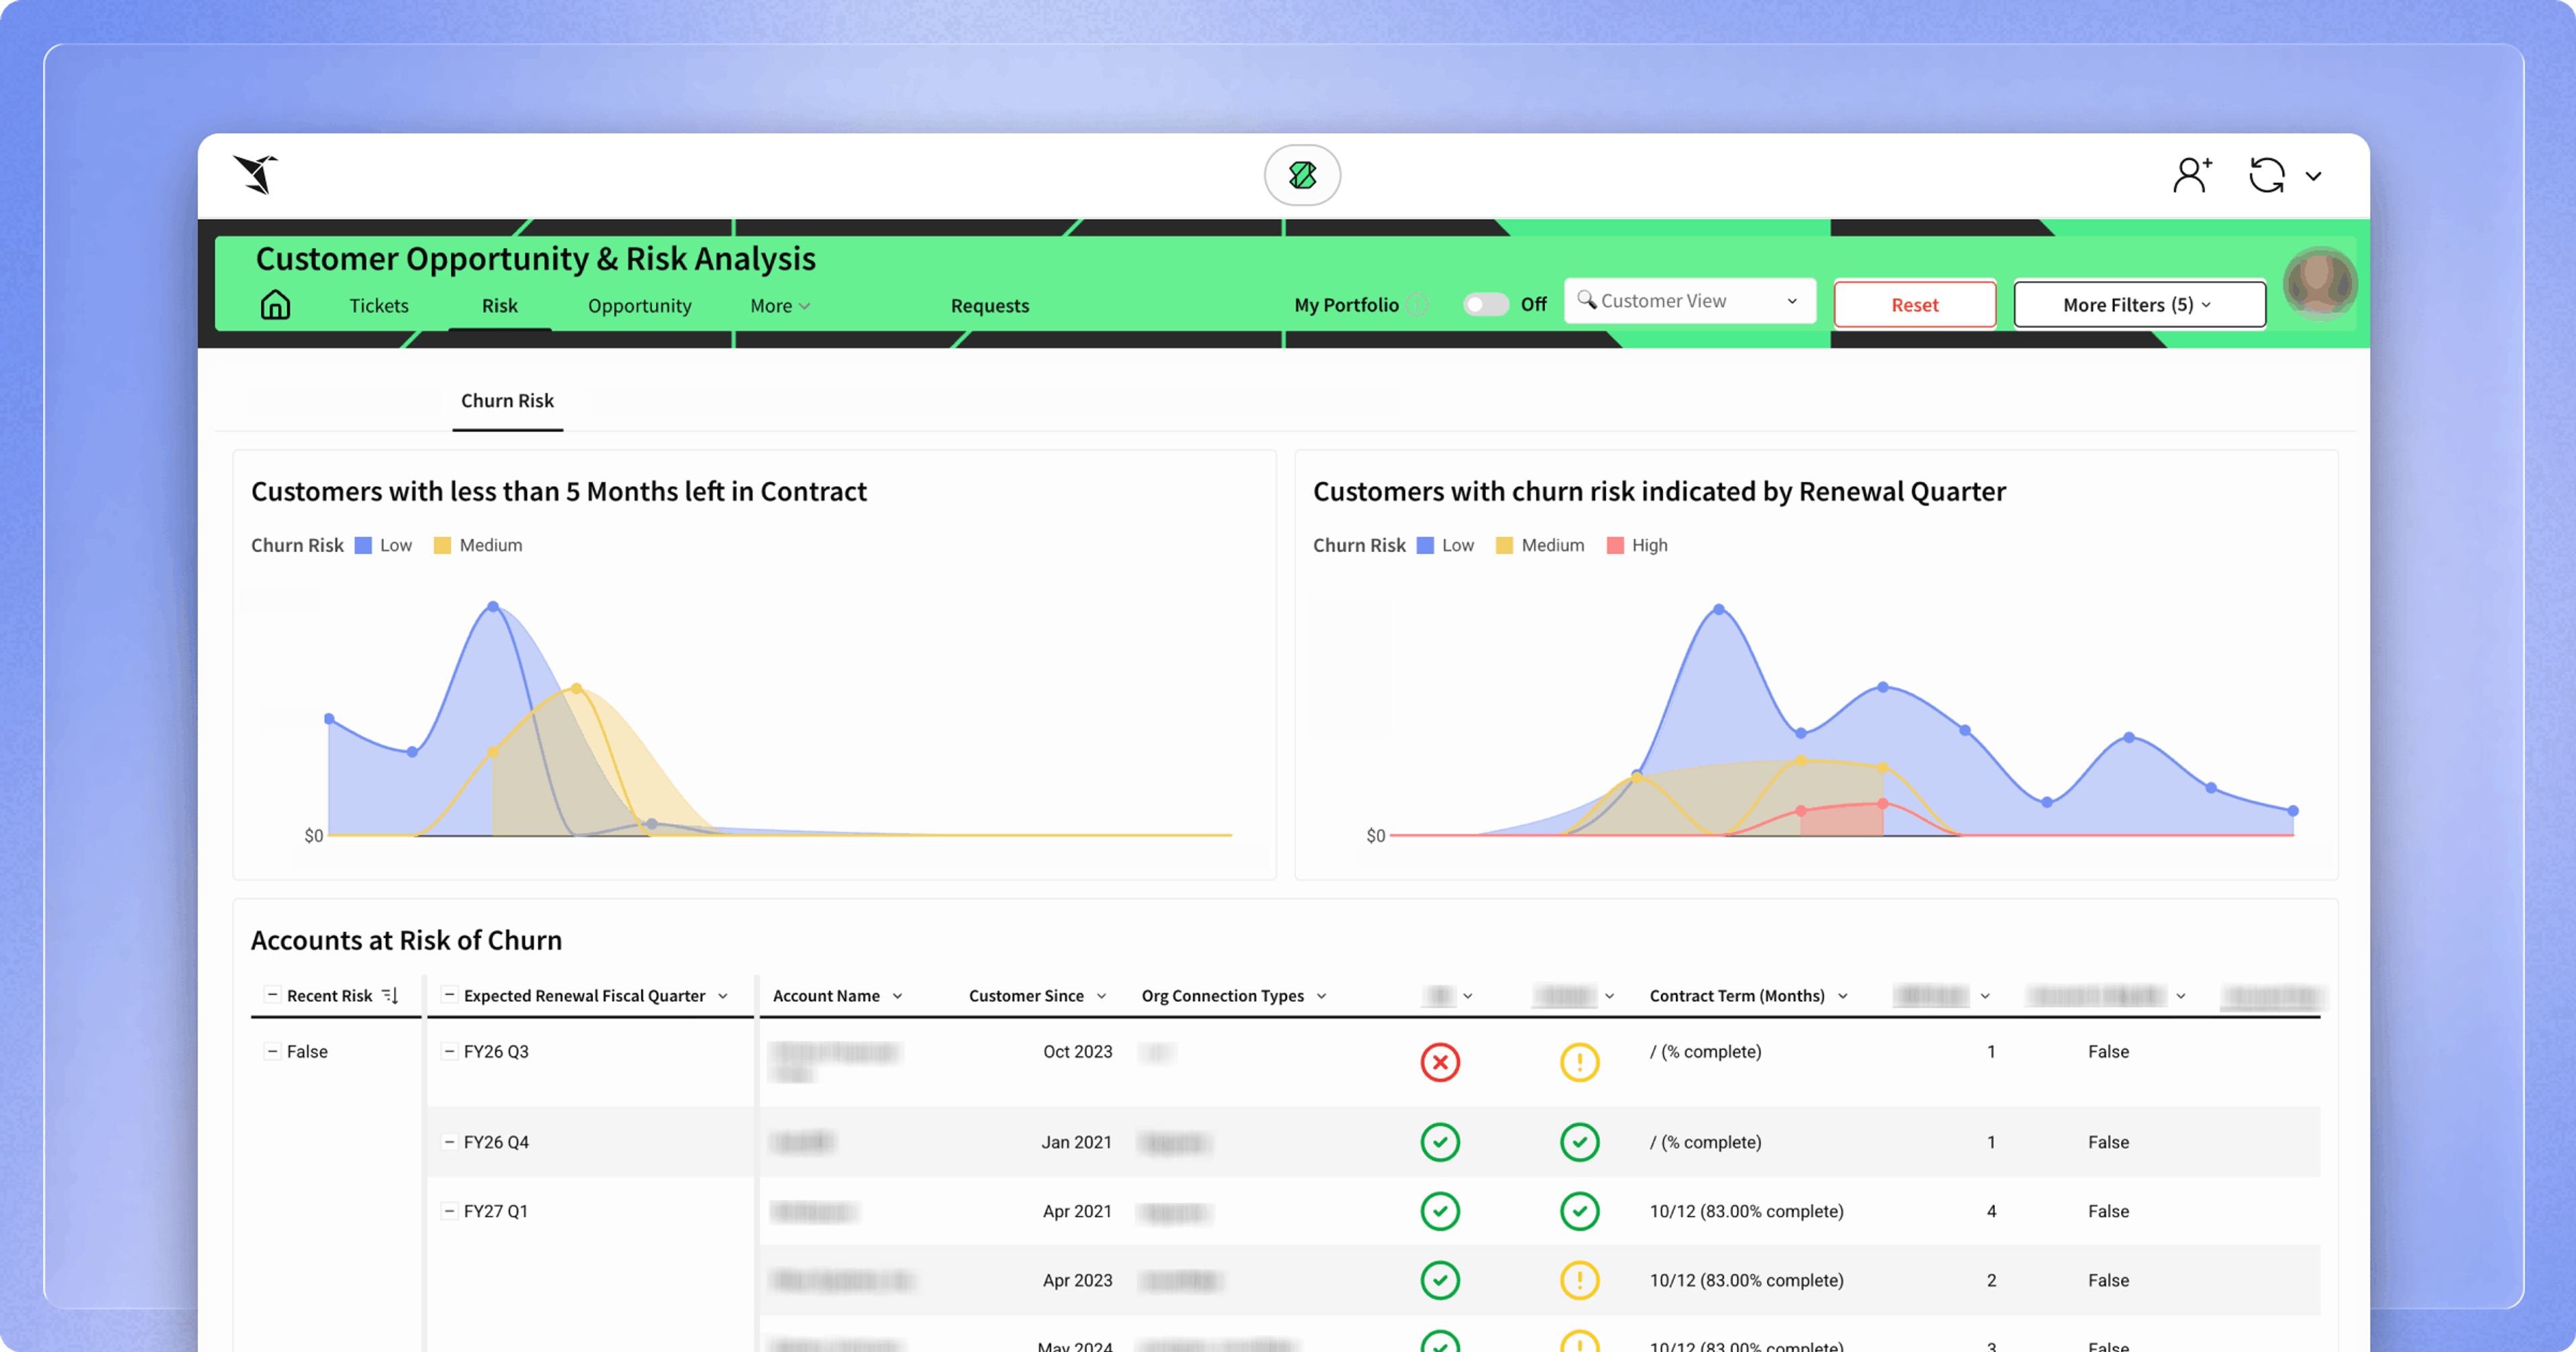
As we iterated on different modeling approaches, we continuously pushed prediction outputs back into Sigma, transforming it into our central review and validation environment. The CS team could visualize churn risk scores in intuitive charts and tables, making it easy for SMEs to inspect patterns, spot edge cases, and walk through false positives and false negatives with us. Their observations were captured directly in Sigma Input Tables, which allowed us to validate assumptions, correct misclassifications, and refine features in real time. This tight feedback loop drastically shortened the time between experimentation and improvement, ensuring each model iteration was grounded in both data and domain expertise.
This way, Sigma became not only an EDA tool, but also a continuous model governance interface.
POC Architecture Diagram
Methodology & Techniques
To build a robust churn prediction framework, we used a combination of supervised and unsupervised machine learning approaches. Each method captured a different dimension of customer behavior, giving us a more complete and reliable view of churn risk. Our decision to start with usage-based prediction for orgs and users—and complement it with anomaly detection at the org level—was guided by the fact that usage data offered the strongest evidence of correlation with churn during EDA. On top of that, we had rich historical usage data from churned customers available for training and validation.
(And I would like to thank my colleague, Fran Britschgi, for being an amazing mentor helping me navigate through various options and techniques, and find the right approach suitable for us.)
The first method we used was org-level behavioral similarity (supervised ML). This approach allowed us to learn the typical patterns leading up to churn and established our baseline: a reliable churn signal rooted in behavioral history.
Next, we extended the supervised approach to user-level behavioral similarity and roll-up. Early churn often starts with user-level disengagement, long before org-level metrics change. By modeling user-level risk, we could roll up insights such as:
- How many users are trending toward churn within an org?
- Which license types or user personas are disengaging?
- Is a key champion or influential user trending down?
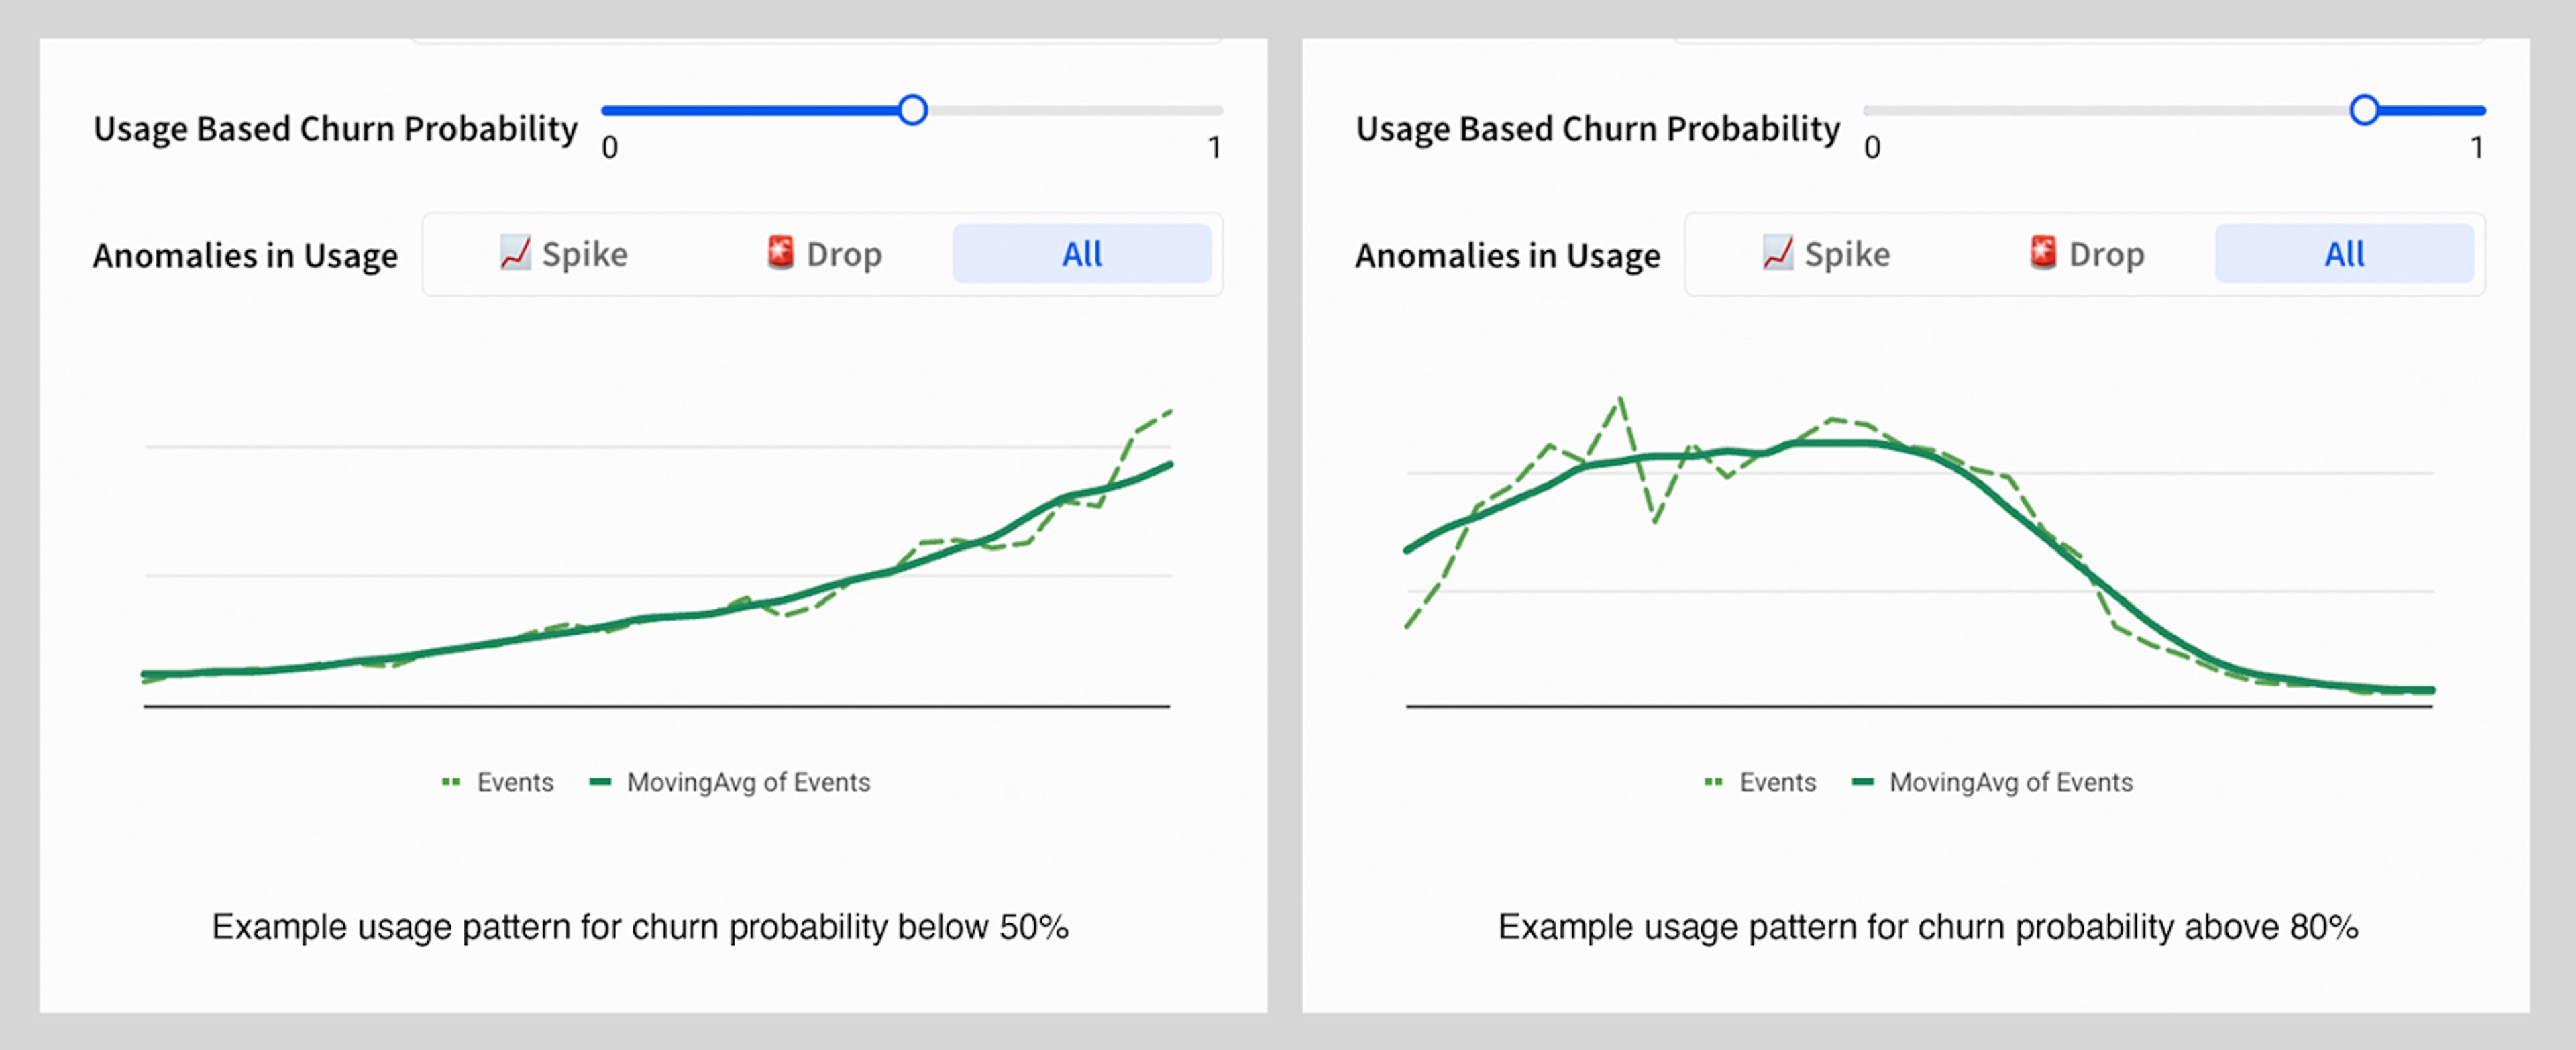
Finally, we used time-series anomaly detection (unsupervised). While supervised models learn from historical churn cases, they may not detect new or unusual risk patterns that the model has never seen. To cover these blind spots, we added unsupervised anomaly detection at the organization level using weekly and monthly telemetry aggregates. This method surfaces leading indicators before they become trends and flags accounts with sudden spikes and drops in usage.
Going with all three of these approaches meant more complexity in the data and modeling layer but provided a powerful blend of lagging + leading signals for the CS team.
Collaborating with CS was our secret weapon
After conducting stakeholder interviews and doing a project assessment, we found that collaborative sessions in Sigma enabled several key benefits:
- Joint exploration of churn root causes
- Drill-down to account and user patterns live
- Shared visuals that stakeholders could understand
- Real-time SME feedback on model outputs
CS leaders also brought their own Sigma dashboards with examples of risk signals and desired output patterns. We aligned on how the model behaves and why, moving beyond a black-box handoff to a collaborative, transparent process.
From POC to production
In the POC phase, we optimized the model for 85% recall, focusing on minimizing false negatives, because overlooking a truly at-risk customer carries significantly higher cost than reviewing a healthy one. Once we validated our V1 performance, we moved the entire ML pipeline from Jupyther Notebook into dbt. Churn risk scores now update automatically alongside our core data models, and the CS team can explore and act on these insights directly in a Sigma AI App devoted to customer account management. Sigma Input Tables continue to serve as our long-term feedback loop, ensuring SMEs can review predictions, flag edge cases, and guide ongoing refinement.
With this structure in place, the model is now steadily evolving through continuous field insights and iterative improvements. The data transformation logic initially developed in Sigma during the POC phase is now being implemented in dbt to enable automated runs, modular design, and full lineage tracking within our production environment.
We have since deployed a full MLOps lifecycle supporting multiple ML models, including feature engineering, training, model registry management, prediction, performance monitoring, and explainability (huge kudos to my colleague Matt Senick for making this happen). This prototyping process within Sigma has enabled rapid prototyping and tight stakeholder feedback loops, allowing us to iterate quickly and deploy models faster.
This closed the loop: from prototyping → modeling → production → continuous learning.
Outcome
CS now has a data-driven way to be more proactive, intervene earlier, and ultimately, protect revenue. Our project achieved the following critical objectives:
- Accelerated delivery without compromising quality
- Transparent, collaborative ML without a black-box approach
- Risk score incorporated directly into CS workflows via Sigma workbooks, allowing proactive CS activation instead of reactive firefighting
- Framework built to scale with more product signals and automation
As we move into the next phase of the project, our focus shifts toward expanding the feature set and identifying the key drivers of churn risk. The goal is to stay one step ahead—spotting early churn indicators before they surface in usage trends (e.g., license utilization drop in the last 30 days, number of contracting users/departments, and underdeployment)—while continuously collecting feedback and validation from SMEs, which will remain central to refining these insights. In parallel, we’re also developing a power-user definition, which will serve as an important signal in future iterations, allowing us to flag accounts where high-impact users are predicted to churn.
Final thoughts
Machine learning success isn’t just about algorithms—it’s about involving domain experts in the process. Sigma enabled us to do that by delivering fast iterations, shared visibility, an interactive feedback loop, and actionable insights, all of which are vital to staying one step ahead of churn.
Ready to explore Sigma yourself? Start a free trial today or explore the Sigma app library.