Astronomer Data and AI exec explains how switching to Sigma “fundamentally changed how we sold”
A Data and AI executive explains how switching to Sigma made it easier to get data pipelines up and running as soon and as efficiently as possible, which led to multiple initiatives in terms of product-led growth and improved onboarding.

Increase in customer engagement
Internal adoption rate
Industry
- Technology
- Embedded Analytics
Steven Hillion joined Astronomer as the Senior Vice President of Data and AI in 2021, bringing his rich background in research mathematics from academia to Silicon Valley, where he's been building machine learning platforms since 2004. At Astronomer, he drives the development of Apache Airflow features tailored for ML and AI teams and leads the internal data science team. Astronomer, known for its modern data orchestration platform, has made significant strides under his leadership, scaling its data pipeline process to support an extensive array of data sources and tasks with the aid of machine learning.
Life Before Sigma
I've worked with BI applications for many years — had plenty of experience with Tableau, PowerBI, and their cousins. And I always felt like they got in the way of my data.
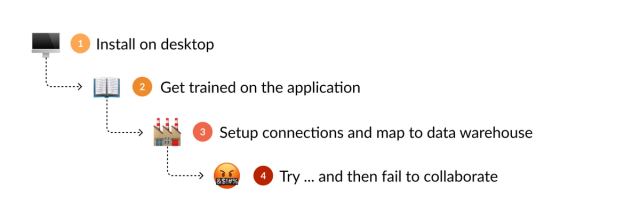
In general, BI tools have required too much work to get to an insight or a dashboard. I have to install something on my desktop, I have to get trained on the application, and someone has to set up connections and map to my data warehouse. Collaboration is difficult or impossible.
I’ve had plenty of experience with Tableau, PowerBI, and their cousins. And I always felt like they got in the way of my data.
Traditional BI also tries to do too much. You end up with way too many calculations and way too much logic in your reports. I have to learn a whole new interface. What ends up happening is that the data engineers do their thing in the database, and everyone else ends up building stuff in Excel.
Life With Sigma
We did a lightweight appraisal between Tableau, Sigma, and another tool. Tableau was out of the running very quickly. Overall, Sigma just seemed like a more mature product, with just the right level of UI capabilities versus simplicity.
Sigma powers our business operations. Two thirds of the company tune in regularly to Sigma reports. Very few were regularly accessing reports before: just execs and department leads.
If I had to pick one example of how much life changed at Astronomer with Sigma, it was some key insights into early indicators of customer success that fundamentally changed how we sold and how we onboarded new accounts.
We realized that we needed to get to certain levels of product engagement within a limited time period, otherwise we lost momentum and customers were less likely to be successful. It was the difference between having the customer’s original team barely meet the goals for onboarding, and having them go above and beyond and invite other teams to join in too. Think Facebook’s “seven friends in ten days”.
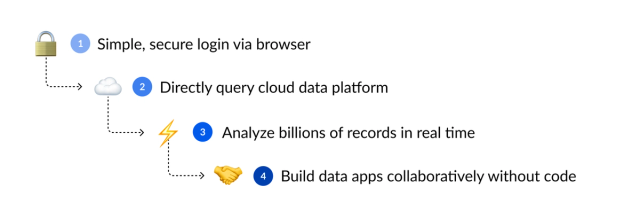
This led to multiple initiatives in terms of product-led growth and improved onboarding. But they all came down to making it easier to get data pipelines up and running as soon and as efficiently as possible.
Each department can generate its own insights without having to be held up by the bandwidth of the central team, who can instead focus on innovation.
Data access for everyone
Although we have a central data team that generates "endorsed" dashboards, we also have many other folks on the team who regularly create dashboards for analytics and operations. For example, our Customer Success team reviews customer health scores on a daily basis. Our education team tracks engagement with our certification programs. Our GTM team tracks each user's journey through our trial program. This means that each department can generate its own insights and build operational programs around analytics without having to be held up by the bandwidth of the central team, who can instead focus on innovation.
As "the Airflow company", our central data team not only makes heavy use of Airflow, but we also act as (happy) guinea pigs, testing out new features and providing feedback to the product team. The more time we can spend doing that, the better for our customers and for the open-source community at large. So the fact that Sigma provides a way for us to democratize access to data is a very big deal.
How we use Sigma Embedded Analytics
One recent project (and a very “meta” one) is the embedding of Sigma dashboards into the Astronomer platform. Our data team had been using certain metrics from the warehouse to regularly assess the health of their own Airflow pipelines. And then we realized that our customers would find these metrics valuable too. So we shared some of our internal dashboards via Sigma's embeddings, and it's become a very popular addition to Astronomer's observability layer.
Our customers are already using it to get insights into how efficiently they’re managing their data pipelines, and how to control costs. It’s become a sort of control panel for their data infrastructure. And it was amazingly easy to do: we already had all the data: we just needed an easy way to expose it in our product.
What we really like about the embedded dashboards feature is how easy it’s become to give new features and functionality to our customers without writing new code or issuing new platform releases.
Since we released the customer-facing dashboards, it's doubled in popularity every month!
Want to learn more about how AI companies like Astronomer are using BI?
Join our virtual event on April 30.
About Astronomer
Astronomer is the driving force behind Apache Airflow™, the de facto standard for expressing data flows as code.
Read more customer stories

 Customer Story
Learn how Persona delivers self-service analytics to hundreds of customers with Sigma, driving 8x adoption and dramatically faster insights.


Activate your data warehouse
Stop buying a new tool for every workflow. Build it once on governed data, then scale it across the business.