AI for Data Blending: How It Works and Why It Matters

Teams routinely need to combine data from two or more sources for a single analysis, and waiting on a new pipeline is rarely an option. AI for data blending makes that combination possible without new infrastructure, so every verbal team, meaning anyone who asks for data in plain language rather than SQL, can get to an answer directly. This article defines data blending, compares it to data integration and ETL, walks through how it works, and covers how AI is changing it.
Key takeaways
- Data blending combines two or more data sources for a specific analysis without building a new pipeline first.
- Governed data blending requires a live warehouse connection, inherited access controls, reusable join logic, and lineage.
- AI is shifting who can perform data blending safely, how quickly, and how much manual scaffolding it requires, while a person still validates the AI's proposals.
- Data blending, data integration, and ETL solve different problems and work together. ETL and data integration prepare governed source tables in the warehouse on a schedule. Data blending combines those tables at the point of analysis.
What is data blending?
Data blending is the practice of combining data from two or more separate sources for a specific analysis, aligning them on common fields and often aggregating one source to match the other's level of detail.
Data blending lets an analyst build one view without requiring the sources to be merged first into a single physical dataset. Depending on the implementation, the sources may be queried separately or prepared as imported snapshots, and the combined result may remain a live view or be retained and refreshed.
Data blending vs. data integration vs. ETL
Data blending, data integration, and extract, transform, load (ETL) all combine data from multiple sources, but they solve different problems.
- Data integration builds a single version of the truth that persists in a warehouse or system of record.
- ETL is the recurring pipeline process that populates that store: it extracts data from source systems, transforms it, and loads it into the warehouse on a schedule.
- Data blending sits on top, combining data at the point of analysis, often against the tables ETL and integration have already prepared.
The table below summarizes how the three approaches differ across the dimensions that matter most in practice.
| Dimension | Data blending | Data integration | ETL |
|---|---|---|---|
| Purpose | Answer a specific analytical question | Establish a single version of the truth | Populate the integrated store on a schedule |
| When the combination happens | Often at query time, on demand | Once, then maintained | At scheduled batch intervals |
| Who owns it | Often a business or data analyst | Data platform and engineering teams | Data engineering teams |
| Persistence | Often a live analytical view | Stored, canonical dataset | Stored warehouse tables |
| When to use it | Exploratory or cross-system questions where freshness matters more than reuse | When many systems need to point to one canonical dataset | When source tables need to be refreshed on a reliable schedule for downstream reuse |
The three approaches are complementary. ETL and data integration prepare governed source tables in the warehouse, and data blending combines those tables, and sometimes additional sources, at the point of analysis to answer questions the pre-built model doesn't directly cover.
The manual way of data blending and its limits
Before modern analytics platforms made data blending a governed workflow, most teams did it by hand in a spreadsheet. That approach still runs quietly through countless organizations today, and it stalls predictably as sources, data volume, and refresh frequency grow.
Spreadsheets, exports, and manual joins
The manual approach to data blending is familiar: export a CSV from each system, open both in Excel, and stitch them together with lookups and copy-paste. Every step is a place errors can enter. Column formats drift between exports, join keys hide typos and casing differences, formulas silently reference the wrong ranges after a paste, and a single misaligned row can distort the total.
Excel itself has hard row limits, so large datasets get sampled or truncated before the join even begins. When those spreadsheets become the join fabric between critical business systems, the errors compound and the outputs lose credibility because no audit trail shows how they were produced. The scale of the problem is well documented: 94% of operational spreadsheets contain at least one error.
No single source of truth
Every export is a snapshot that starts aging the moment it lands on a desktop. Multiple versions can sit on shared drives with no clear audit trail, and nobody may be able to say which file holds the authoritative numbers or who changed what. Each copy also adds duplicate storage cost and a new security exposure the source system's controls can't reach, since sensitive data ends up outside the warehouse's access model.
Rework on every refresh
A manual data blend has to be rebuilt every time the underlying data changes. Each month brings new exports, new joins, and the same formulas to re-check. For financial planning and analysis (FP&A) teams that rely on spreadsheets, manual data collection and validation can consume up to 46% of their time and leave less time for insight generation.
How data blending works
Data blending is a workflow an analyst performs, either by hand in a spreadsheet or through a modern analytics platform that automates much of the mechanical work. Either way, the sequence of decisions is the same, and a person is accountable for each one. The four steps below describe what the builder does, in order, to produce a defensible data blend.
1. Choose a primary and secondary source
Start by picking which source will drive the output. The primary source sets the grain of the result. Grain is the level of detail at which each row is unique, such as one row per campaign per day. The secondary source contributes additional columns to that grain rather than defining it. Before touching a join, write the intended grain down and treat it as a design constraint to help prevent dimensional-modeling errors.
2. Identify a common field to match on
Next, find a field that links the secondary source to the primary: a date, a customer ID, or a campaign name. Formats have to agree before a join will work. If a date is stored as text in one system and as a timestamp in another, normalize it first, or the matching rows are simply lost.
3. Aggregate the secondary source to the right grain
If the secondary source is more granular than the primary, joining them directly would create fan-out, so pre-aggregate the secondary source. Suppose the primary source has one row per order carrying the order total, and the secondary has three line items for that order.
A direct join produces three rows, each carrying the full total, and a subsequent sum counts that order's revenue three times. The inflated numbers can still pass basic validation. To avoid that, apply the established aggregate-before-joining technique: reduce the secondary source to one row per join key first, for example by summing spend per date, then join.
4. Join the sources and validate the result
Finally, execute a left join: keep every row from the primary source and attach matching values from the pre-aggregated secondary. Then validate the output by testing that the join key is still unique. If row counts grew, check whether a join multiplied rows upstream.
How AI is changing data blending
For most of data blending's history, the four steps above were entirely a human's job. That is changing. AI-assisted features can now propose join keys, match column semantics across sources, and flag grain risks that a person once had to work out by eye.
The four steps stay the same. AI shifts who can perform them safely, how quickly, and how much manual scaffolding the work requires. A person still validates the AI's proposals before a decision rides on the number, and the platform running the AI still determines whether the result inherits proper governance.
Suggesting join keys and matching schemas across sources
The same field rarely carries the same name in two systems, and matching them by hand is slow and error-prone. AI-assisted preparation systems analyze table metadata and values, not just column names, to propose likely relationships between sources. Language models and graph-based matching techniques compare naming patterns, data types, and value distributions to surface candidate join keys — so a system can flag two columns as related even when their headers are inconsistent or don't describe the content well.
In practice, that might mean the system sees a cust_id column of nine-digit integers in one table and a customer_number column of nine-digit integers in another, and proposes them as a candidate join key based on value distribution and cardinality overlap.
To validate a proposal, check whether the proposed key is unique in the primary source and matches a high percentage of rows in the secondary. Low match rates or unexpected fan-out are red flags.
One caveat: proposals can look confident on surface-level similarities that don't reflect business meaning. Two columns of nine-digit integers may share a format without sharing a referent, so every AI-suggested join needs explicit human sign-off before it feeds a decision-grade number.
Flagging mismatched grains
Fan-out, chasm, additivity, and join-key risks should be checked before results are used. Modern semantic layers can address the same risk structurally by defining metrics, relationships, and approved join paths so queries are less likely to multiply rows through an ambiguous route. This matters because a fan trap can duplicate measures while still producing output that looks plausible.
How Sigma delivers AI for data blending
AI can suggest joins, match schemas across sources, and flag risky grains, but the platform that runs it determines whether the result is safe to use. Sigma is an AI Apps and analytics platform for building and scaling governed analytics, applications, and agents on live warehouse data. It sits between the cloud data warehouse and the AI tools generating against that data. Sigma turns the artifacts they produce into production-ready software that inherits the company's existing governance.
Joining live warehouse tables without a new pipeline
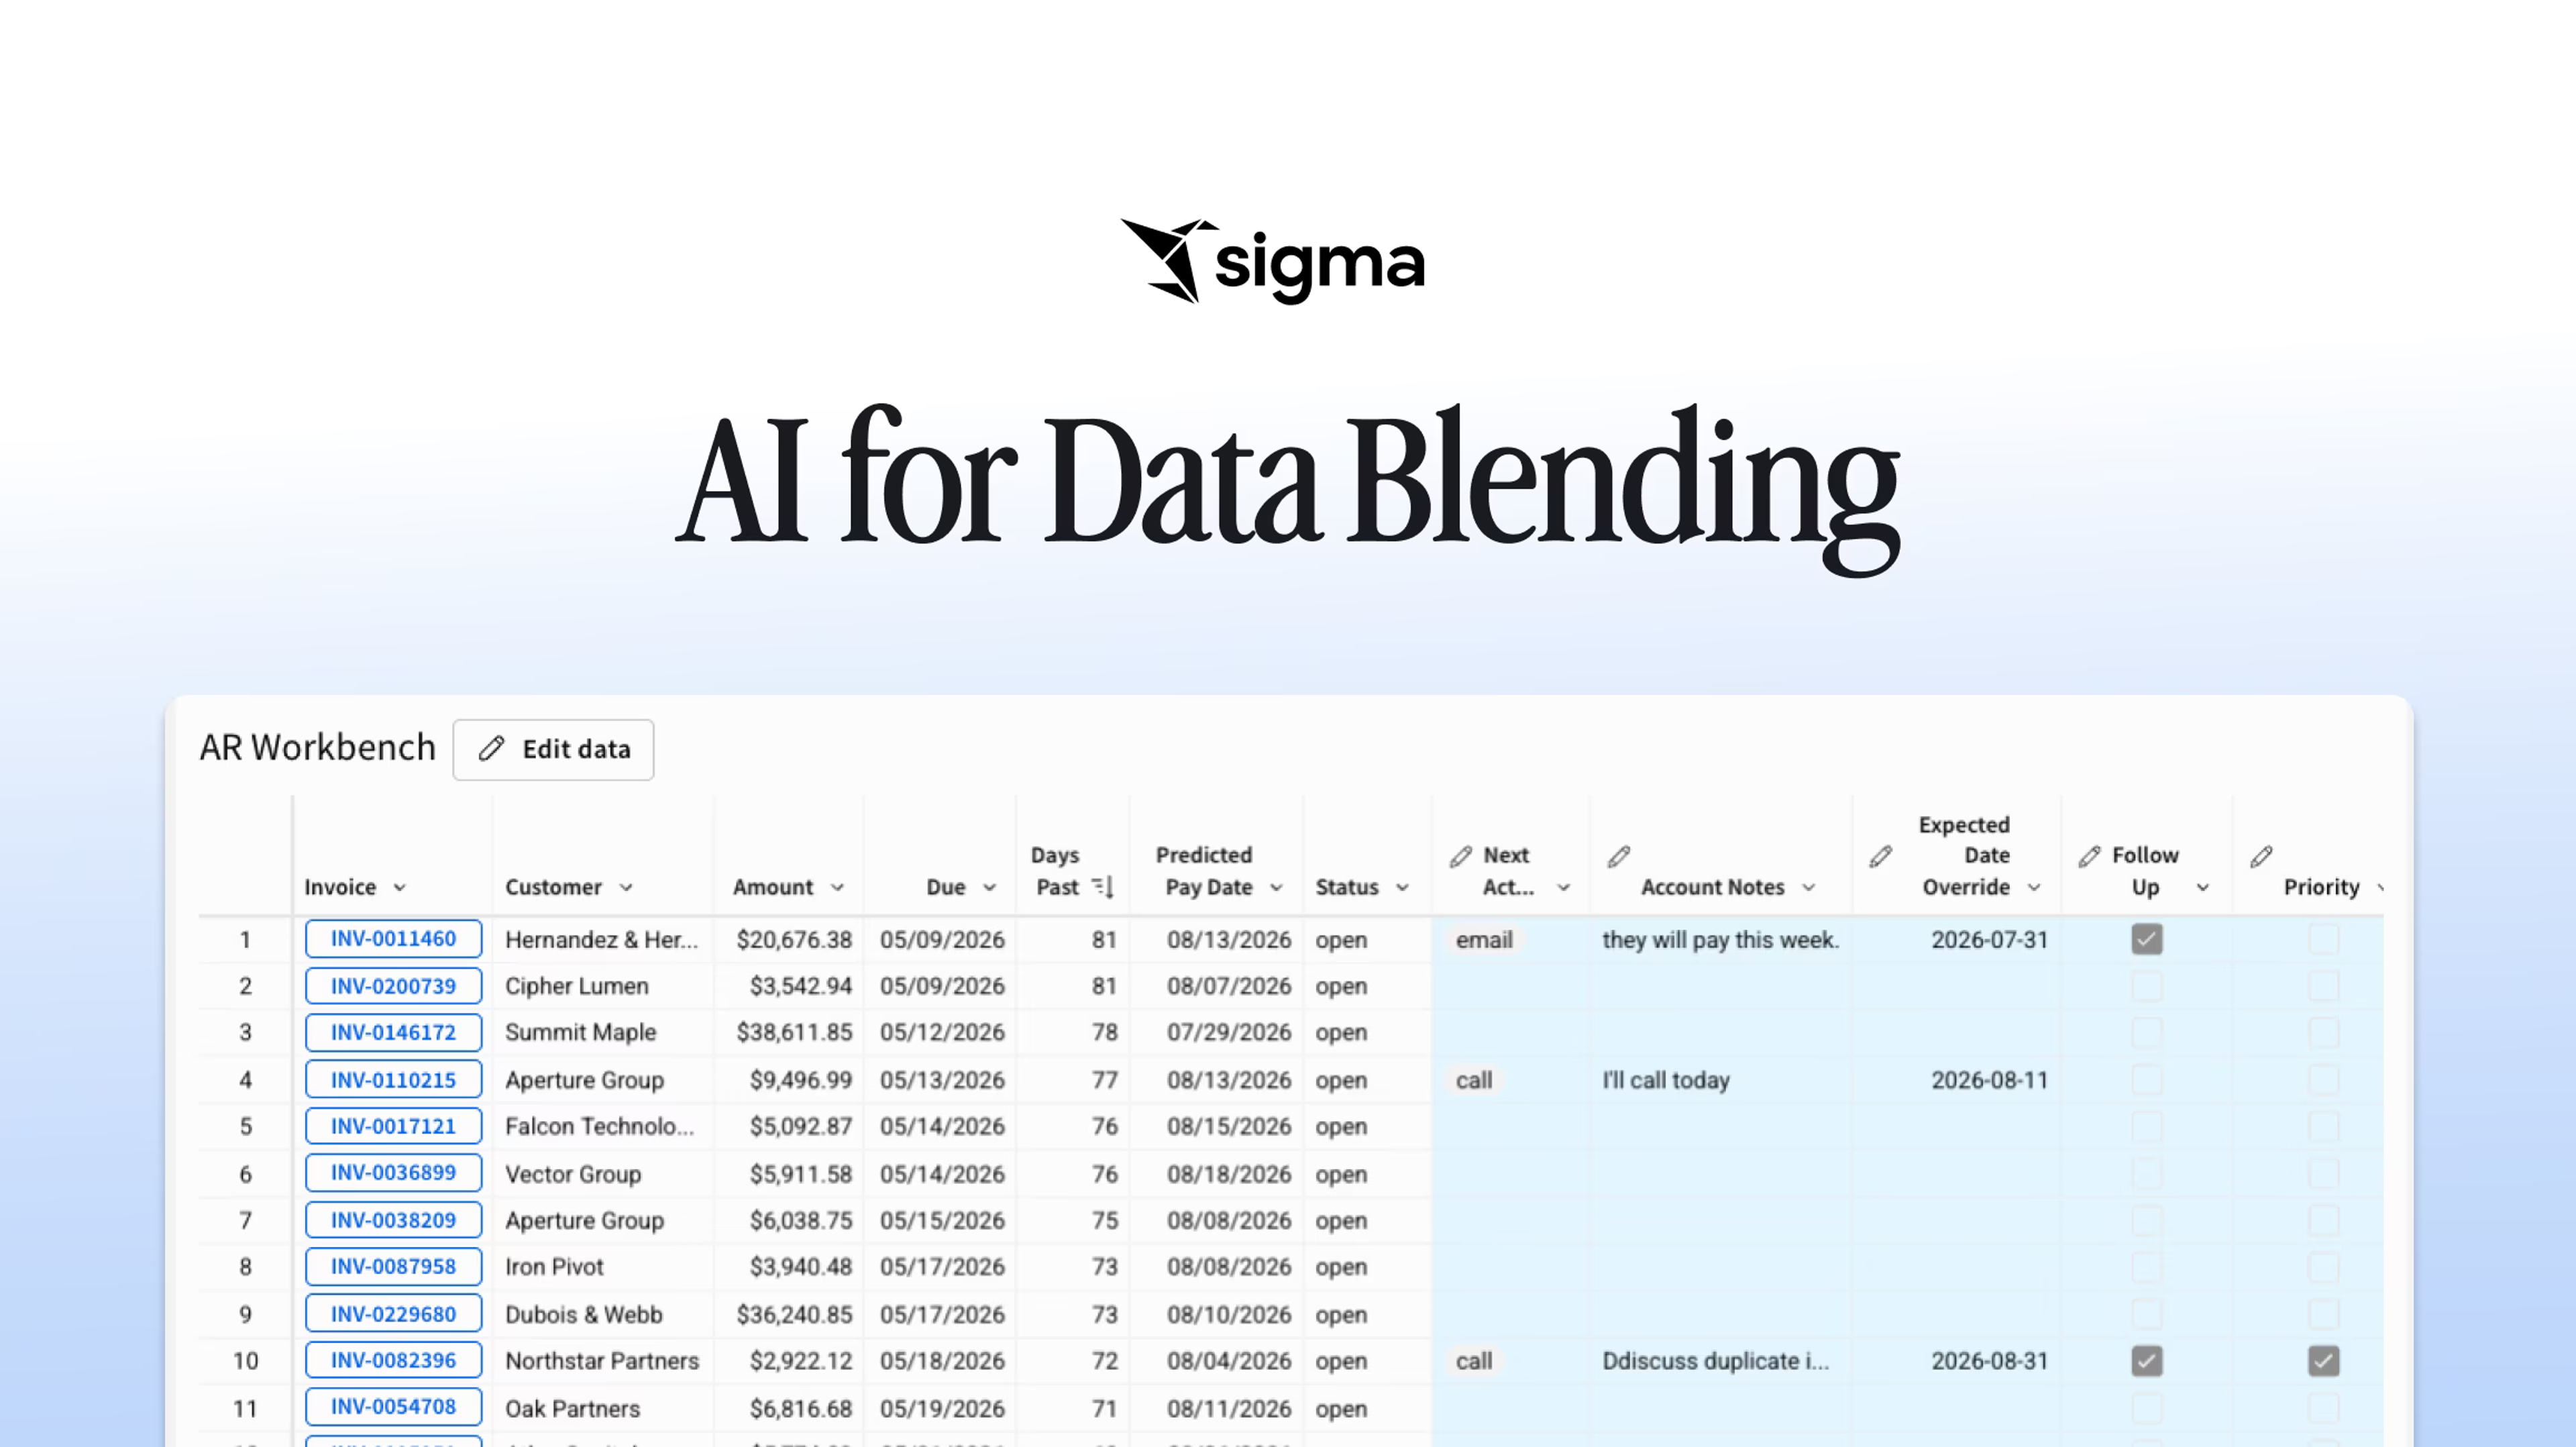
An analyst joins the ad platform table and the CRM table in a single Sigma workbook. The tables live in a supported cloud warehouse such as Databricks, Snowflake, BigQuery, or Amazon Redshift, and the analyst works through a spreadsheet-familiar interface. Formulas and joins compile into SQL joins and queries that run in the connected cloud data warehouse rather than pulling data into a separate engine. An analyst who knows Excel formulas can build the join without writing SQL and without filing a request for a new pipeline.
Keeping blended views governed by the warehouse's access rules
Because Sigma is warehouse-native and does not extract source warehouse data, warehouse row- and column-level security applies at query time when a blended view runs. Sigma separately applies platform roles and workbook-level permissions that govern who can open, edit, and share the blended view itself. If a user can't see a row or column in the warehouse, they can't see it in the blended view either.
Reusing blending logic across the organization
When every analyst writes their own version of the same join, small differences in filters or join paths can produce conflicting numbers for the same metric. Sigma supports centrally defined data models, dbt Semantic Layer integration, and predefined metrics that other workbooks reuse, so "pipeline by campaign" means the same thing in every workbook that asks for it.
Tracing what was joined and how
Data lineage tracking and activity records in Sigma answer the questions governance and compliance teams ask of the analytics layer: which sources fed this number, who accessed the workbook, and how the metric was calculated. That trail complements the warehouse's own audit records and helps teams see where customer or financial data flows inside Sigma, so a data blend is never a chart nobody can explain.
Asking questions across blended data with Sigma Assistant
Once the blended view lives in a workbook, users can Analyze with Sigma Assistant to summarize what the view shows and answer follow-up questions in plain language. Users can verify an answer by inspecting the visible generated query and tracing it to the underlying tables. Warehouse controls and Sigma permissions continue to scope access to the blended view and its AI-generated analysis.
Try AI for data blending in Sigma
Data blending shouldn't require a new pipeline, a new export, or a new copy of the data. In Sigma, an analyst joins live warehouse tables directly in a workbook; warehouse row- and column-level security applies at query time; Sigma adds workbook permissions and activity records on top; and Sigma Assistant answers follow-up questions on the result. Warehouse controls and Sigma permissions continue to govern the analysis, and the business user who asked the question can build it without filing a pipeline request.
See it in action by joining two live warehouse tables in a Sigma workbook, then exploring, building, and acting on the result without leaving the warehouse. Get a demo or try Sigma free.