
How to use input tables, a practical guide to dynamic calculations and scenario modeling
If you’ve ever asked, “What if we change pricing? Shift headcount? Cut spend?”—you need a way to enter data to model the impact on historical data. That's exactly what Input Tables solve. They're your direct line to your cloud data warehouse, but with the superpower of letting you manually input data right alongside your existing warehouse tables. Think of it as the best of both worlds: live production data meets human intuition.
Why use Input Tables?
Input Tables exist because sometimes, the most important data for decision-making doesn’t live in your systems yet. It’s still in your head, in a spreadsheet, or being debated in a meeting. Picture this: you're in a meeting and someone asks, “What would happen if your growth rate were 15% instead of 10%?” Instead of promising to get back to them later, you just change a number and show them the answer instantly. Input Tables solve the eternal analyst dilemma: you've got valuable historical data in your warehouse, but you need to layer in assumptions, forecasts, or external data that doesn't live anywhere in your systems. Before Input Tables, this meant exports, spreadsheets, and a whole lot of manual work. Now, you just type directly into Sigma and watch your analysis update in real-time.
- Data entry made simple: Do you have external data that needs to be joined with your warehouse data? Just type it right in.
- Scenario modeling that works: Want to model different growth scenarios? Revenue forecasts? Inventory planning? Change a few cells and watch your entire analysis adjust instantly.
- What-if analysis without the headache: "What if we hired 10 more people?" "What if shipping costs doubled?" Enter your assumptions and receive answers instantly.
Under the hood of Input Tables
Input Tables work by allowing you to manually enter data at the cell level, right alongside your existing warehouse data. You can start with an empty table and build from scratch, or grab data from your warehouse and add your columns to it.
The magic happens when you join or lookup this manually entered data with your existing warehouse tables: suddenly, you're analyzing live production data mixed with your assumptions and forecasts, without ever overriding the original data.
The data you entered is written back and stored in dedicated, Sigma-managed tables inside your connected cloud data warehouse—not outside or in separate storage, ensuring it's secure and adheres to all your organization's data policies. The best part is you don’t need to manage any of that technical setup. Just focus on your analysis. You just type and analyze.
Getting started is simple
First, check the basics:
- You need a connection with write access enabled. Snowflake, Databricks, or Redshift are fully supported; BigQuery is in public beta.
- You need to be an Admin, Creator, or have custom permissions for Input Tables
Then just:
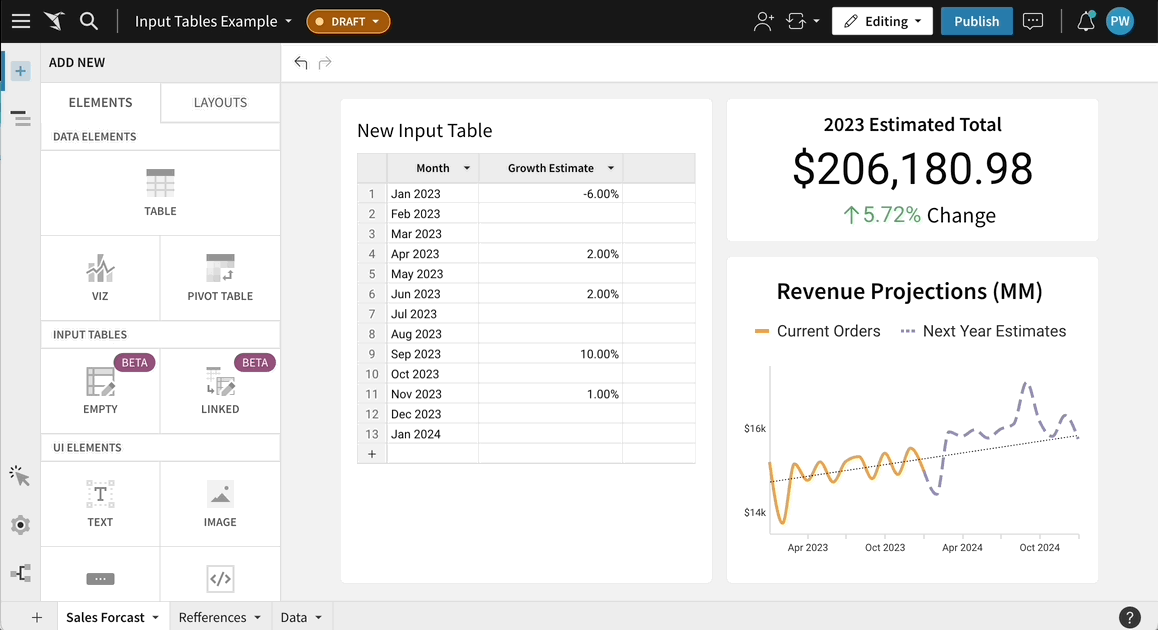
- Enter Edit mode in your workbook
- Open the ADD NEW panel
- Under INPUT TABLES, select EMPTY
- Start typing data
Start typing and your analysis updates instantly. It’s that simple.

Choosing the right Input Table: Empty, CSV, or Linked
Empty Input Tables are exactly what they sound like, blank canvases where you build everything from scratch. Add your columns, input your data, and set your validation rules. Perfect for external data that doesn't exist anywhere in your warehouse.
CSV Input Tables let you upload CSV files directly into Sigma as Input Tables. Got a spreadsheet with external data? Upload it as a CSV, up to 200 MB, and it becomes a fully functional Input Table that you can join with your warehouse data.
Linked Input Tables start with existing warehouse data, but allow you to add your own editable columns on top. Think of it as taking a warehouse table and saying, "This is great, but I need to add my forecasting columns." Bridge the gap between your official data and your on-the-ground expertise, all in one place.
Putting it into practice: Building a growth forecast model
Let's get practical with a simple retail scenario that shows precisely how Input Tables work.
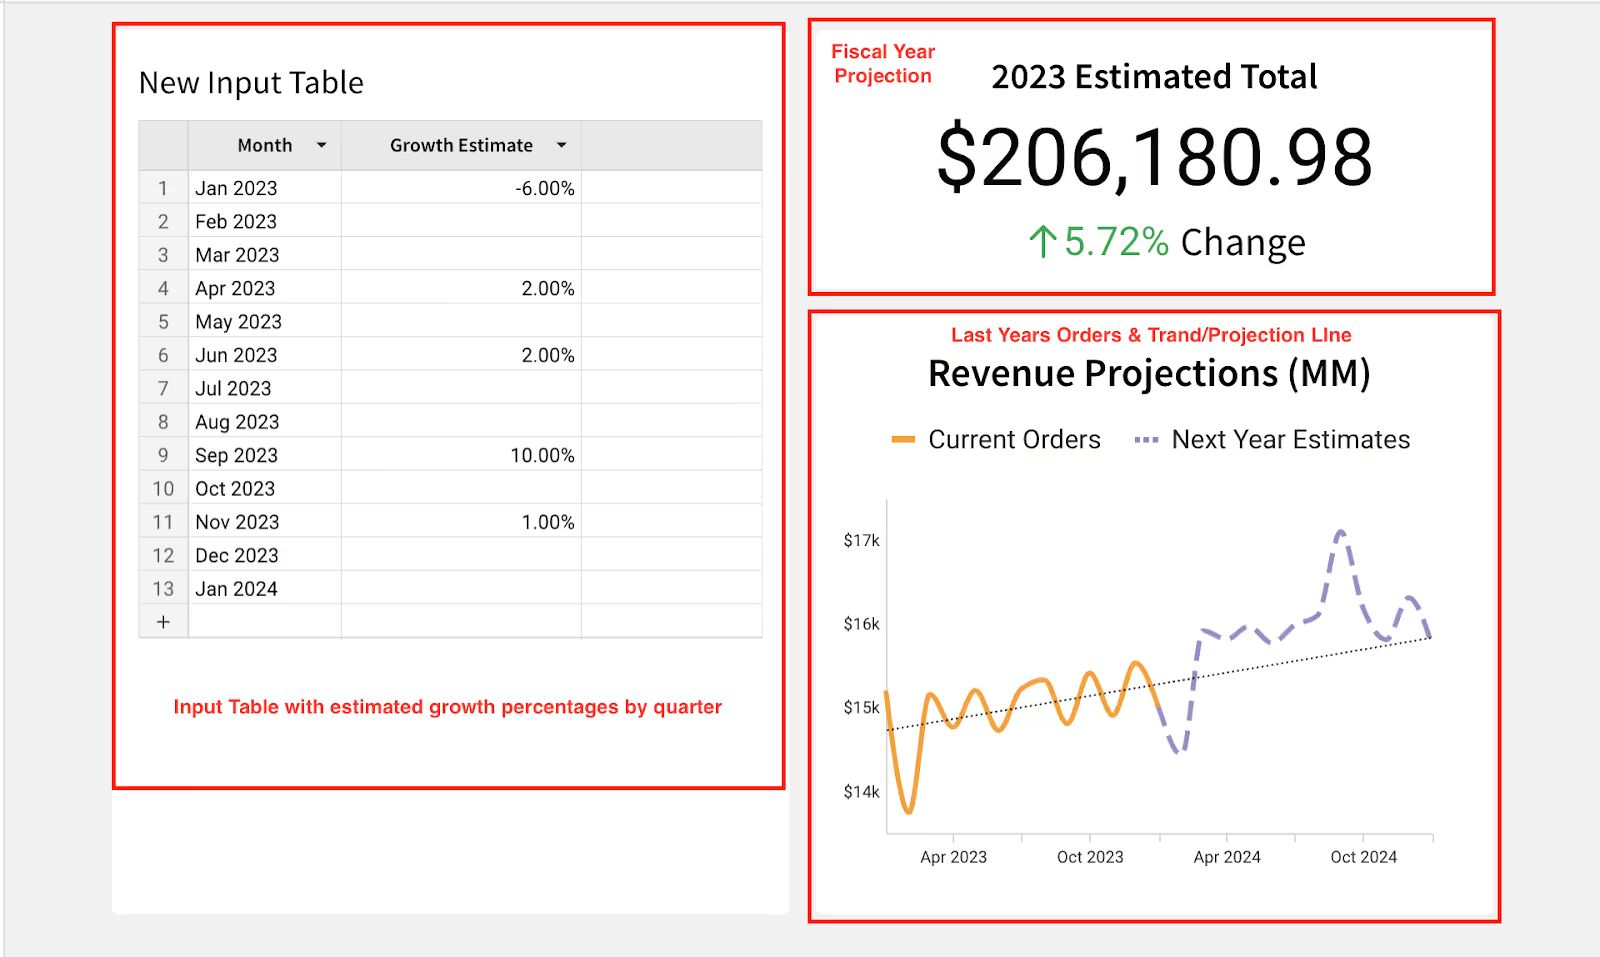
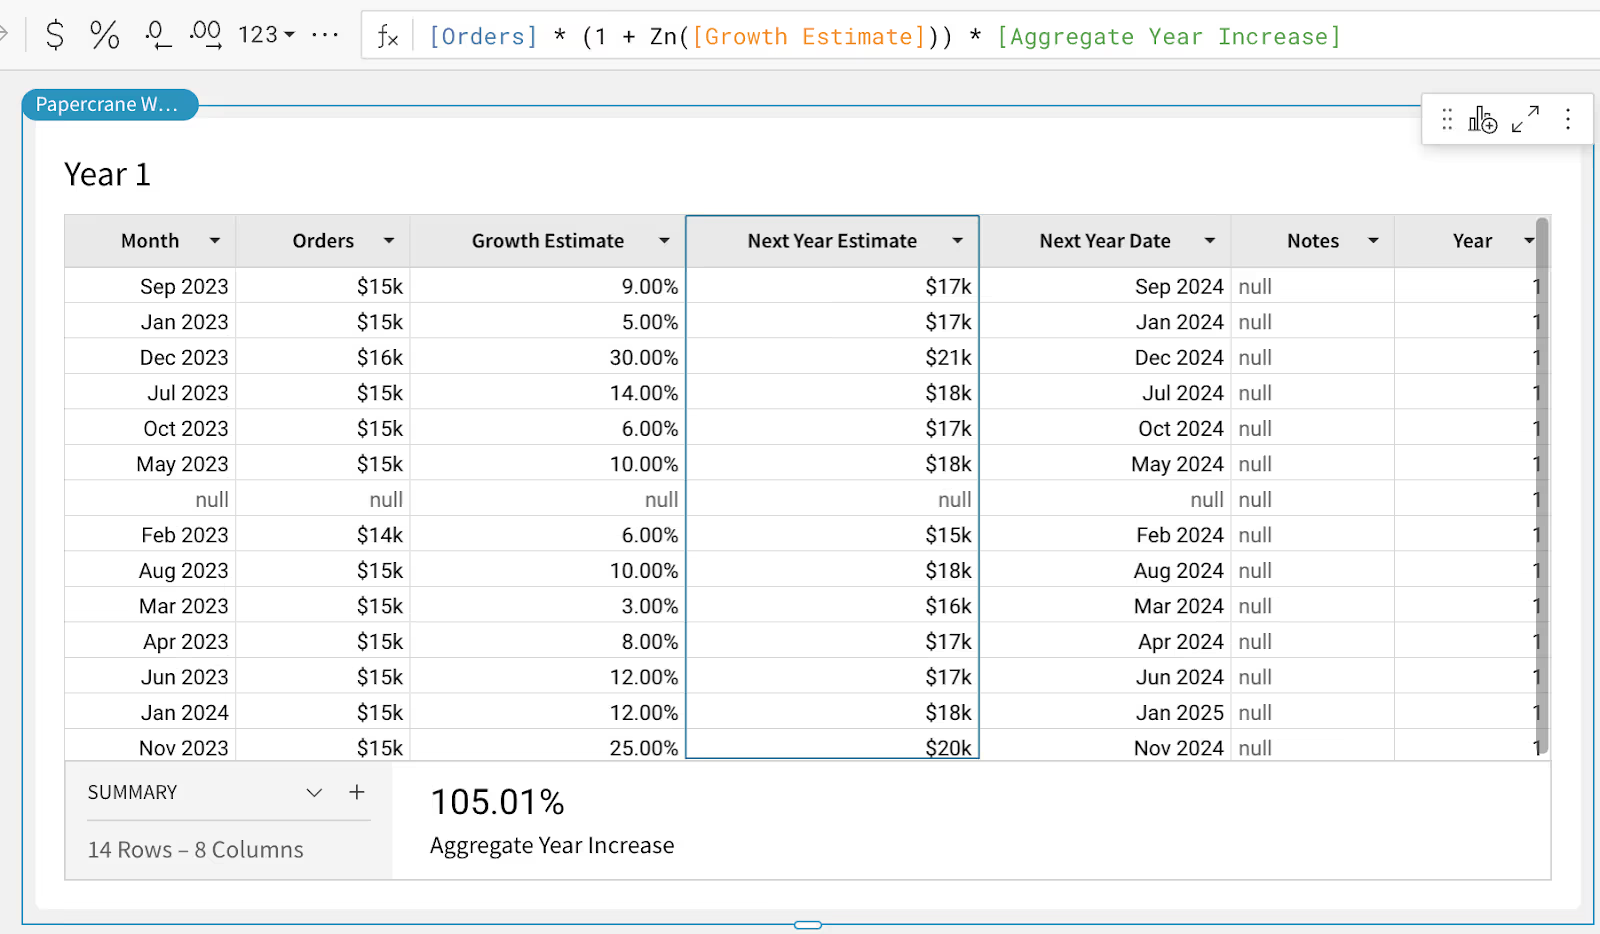
We've got historical transaction data from a retail business living in our warehouse, as well as current year-to-date orders. Now we want to build a projection model for the full fiscal year. Here's the setup: an Input Table with 13 months and a manually created "Growth Estimate" column where we can input different scenarios month by month.
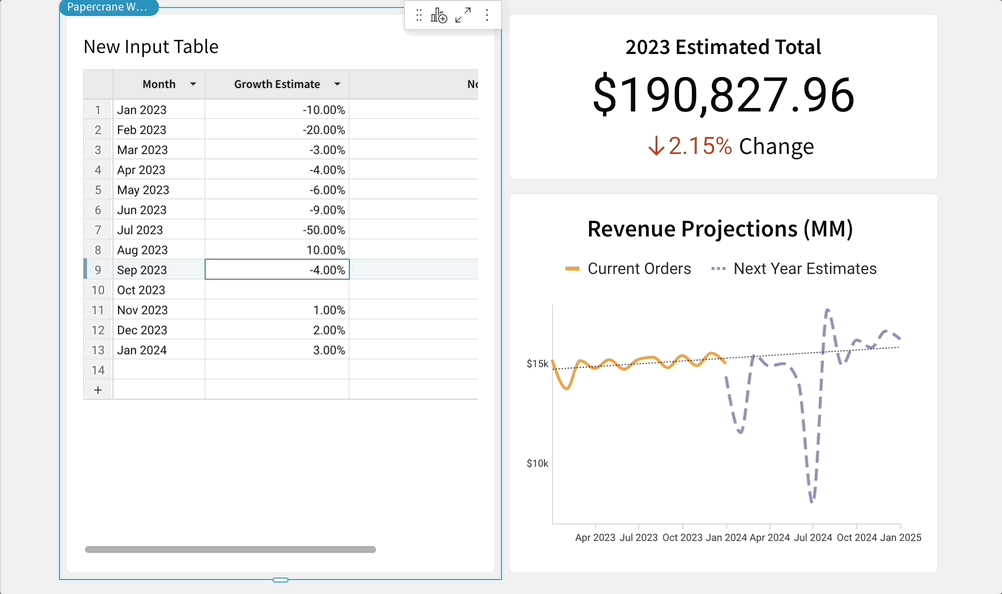
The "rainy day" scenario
Economy looking rough? Interest rates climbing? Time to model the downside.
Input negative growth estimates for each month and watch your forecast adjust in real-time. The charts may not be visually appealing, but understanding your potential downside based on real historical data is crucial for effective risk management and maintaining business continuity when challenges arise.
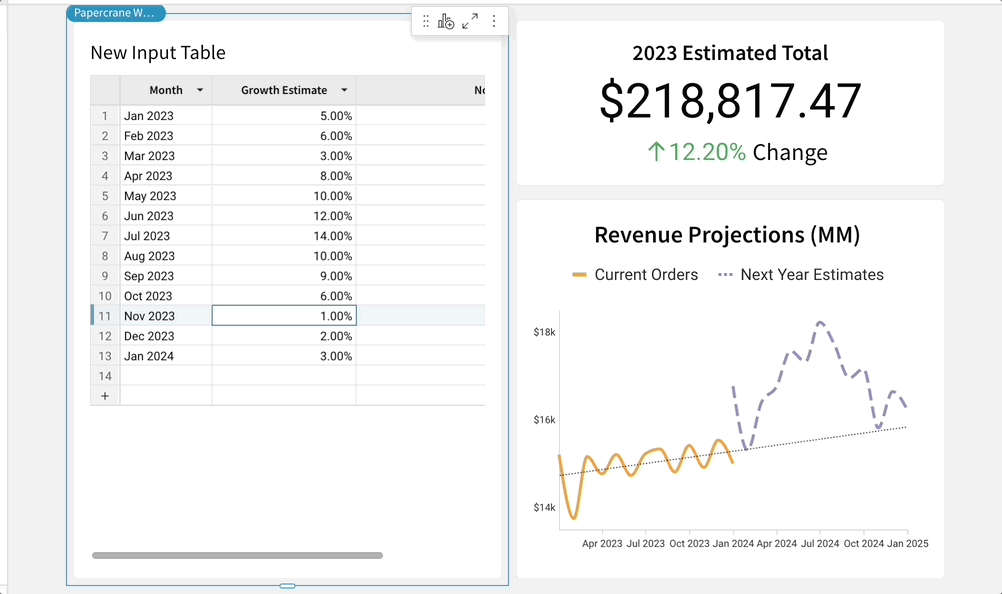
The "growth mode" scenario
Now flip it. Got signals that business is picking up?
Input positive growth projections month by month and see exactly where you'll need more inventory, bigger teams, or additional capacity. Change those growth estimates and immediately see the impact on your total revenue projections.
The beauty of changing assumptions
Here's where Input Tables especially shine. You can view your manually entered growth estimates alongside your actual warehouse data in a single, unified view. Do you need to adjust how you calculate future projections?
Simply update the formulas that reference the data in your Input Table. Want to test different mathematical models for growth? Change the function and watch your entire forecast recalculate instantly.
No code required. Update your assumptions, and Sigma recalculates everything automatically. That's the real power of mixing warehouse data with human insights.
Can I trust this data?
Input Table data resides in managed system tables within your cloud data warehouse, adhering to all your existing security policies. It's not some separate system you need to worry about; it's part of your warehouse infrastructure.
Plus, you can set data validation rules to make sure people can't input nonsense. Want to restrict growth estimates to realistic ranges? Just set validation rules and Sigma will enforce them.
What about permissions?
Standard Sigma permissions apply, but with a twist - you can let "explorers" edit Input Table values even if they can't normally edit workbooks. Simply enable "Allow data editing in explore mode," and your stakeholders can now run their scenarios without needing full editing permissions.
The bottom line
Input Tables solve the rising analytics problem where your warehouse has vast historical data, but the future requires human judgment. Now you can have both in one place. Just type your assumptions directly into Sigma and watch your entire analysis adjust in real-time. Mix live warehouse data with forecasts, external inputs, and what-if scenarios - all with the same security and governance you already trust. The future of your business isn't just in your historical data. It's in combining that data with human insight. Input Tables make that combination easier than ever.
Ready to start building scenarios that matter? Your warehouse is waiting.
Everything else you're probably wondering: Input Tables FAQs
Q: What are the main use cases for Input Tables in Sigma?
A: Input Tables are perfect for data entry, integrating external data with warehouse data, reconciliation, what-if analysis, approval workflows and scenario modeling. Anytime you need to mix human insight with governed warehouse data.
Q: What are the requirements for using Input Tables in Sigma?
A: You need a connection with write access enabled (Snowflake, Databricks, or Redshift are fully supported; BigQuery is in public beta), and you need to be an Admin, Creator, or have a custom account type with permission to create and edit Input Tables.
Q: Can I import data from other sources?
A: Absolutely. Copy and paste from spreadsheets and other Sigma elements. You can paste up to 50,000 cells at once (that's 2,000 rows and 25 columns). Or just upload a CSV file directly as an Input Table.
Q: What about data validation?
A: Sigma Input Tables let you configure value ranges, dropdowns, data types, and required-field rules—all at the column level—ensuring only valid data is entered.
Q: Can I permit other people to edit my Input Tables?
A: Yes, you have granular control over who can edit Input Tables, and all edits are protected by the same security and governance as the rest of your warehouse data—including row-level security if configured. This enables secure, governed, and auditable collaboration directly within your workflows. Even if users are just "explorers" who normally can't edit workbooks, you can flip the "Allow data editing in explore mode" switch and let them run their scenarios. Pretty handy for stakeholder meetings.
Q: How can I add calculated columns or perform calculations using data from Input Tables?
A: Child tables of Input Tables work exactly like regular Sigma tables. All the same functions, all the same formula capabilities, and no limitations on the amount of rows. You can create calculated columns or perform calculations using standard Sigma functions, combining data from the Input Table and your warehouse in any way you need.
Q: What about joins and lookups?
A: They work exactly like you'd expect in a spreadsheet. Your Input Table data can be joined with warehouse tables, lookup values, or whatever you need.
Q: Where does this data live?
A: Input Tables write data back into your warehouse, creating new, secure, governed tables in the same place as your main business data. This keeps manual inputs and warehouse data in one unified, compliant environment.