


Mapping your workbook from query to visualization
Built into Sigma is a visualization and data management system called Lineages. In short, Linages offer a comprehensive visual representation of the relationships between different data elements. With Lineages you can map each individual transformation, join, union, query, and visualization built from any workbook inside of Sigma. Lineages is an excellent tool for triaging issues and managing the complex details of your work in Sigma.
From first principles to final product
At its essence Sigma's goal is to provide an extremely powerful yet easy-to-use tool for working with data, analyzing and visualizing said data, and capturing value from the data that is kept in our warehouse and other third-party sources. At times, building workbooks requires multiple datasets from different warehouses, sources and input tables quickly. This results extremely complex data models that — with traditional BI tools — can be a nightmare to manage. With Sigma's lineages you can visually manage your entire workbook, how the data has been joined together, what derived datasets have been created, which visualizations and elements have been used from which data, all from a single, accessible view.
In this how-to guide, we’ll walk you through creating a complete workbook while using lineages to monitor and manage the entire process.
Table of Contents:
- Creating your first dataset
- Building a workbook and viewing it with lineages
- Managing a workbook with lineages
- Triaging issues in your workbook with lineages
- The essential value behind visual data modeling
- FAQ’s
Building a dataset into a workbook
Datasets in Sigma are centralized data views created in Sigma to facilitate data exploration for business users. They serve various purposes such as joining and flattening dimensional models, masking sensitive data, materializing data to enhance performance, and ensuring consistency in common calculations and KPIs. By utilizing datasets, Sigma offers a balance between administrative control and the ability to discover, add, and trust new data. Datasets function as data sources for workbooks, and any changes made to the dataset will be inherited by the workbooks built on it.
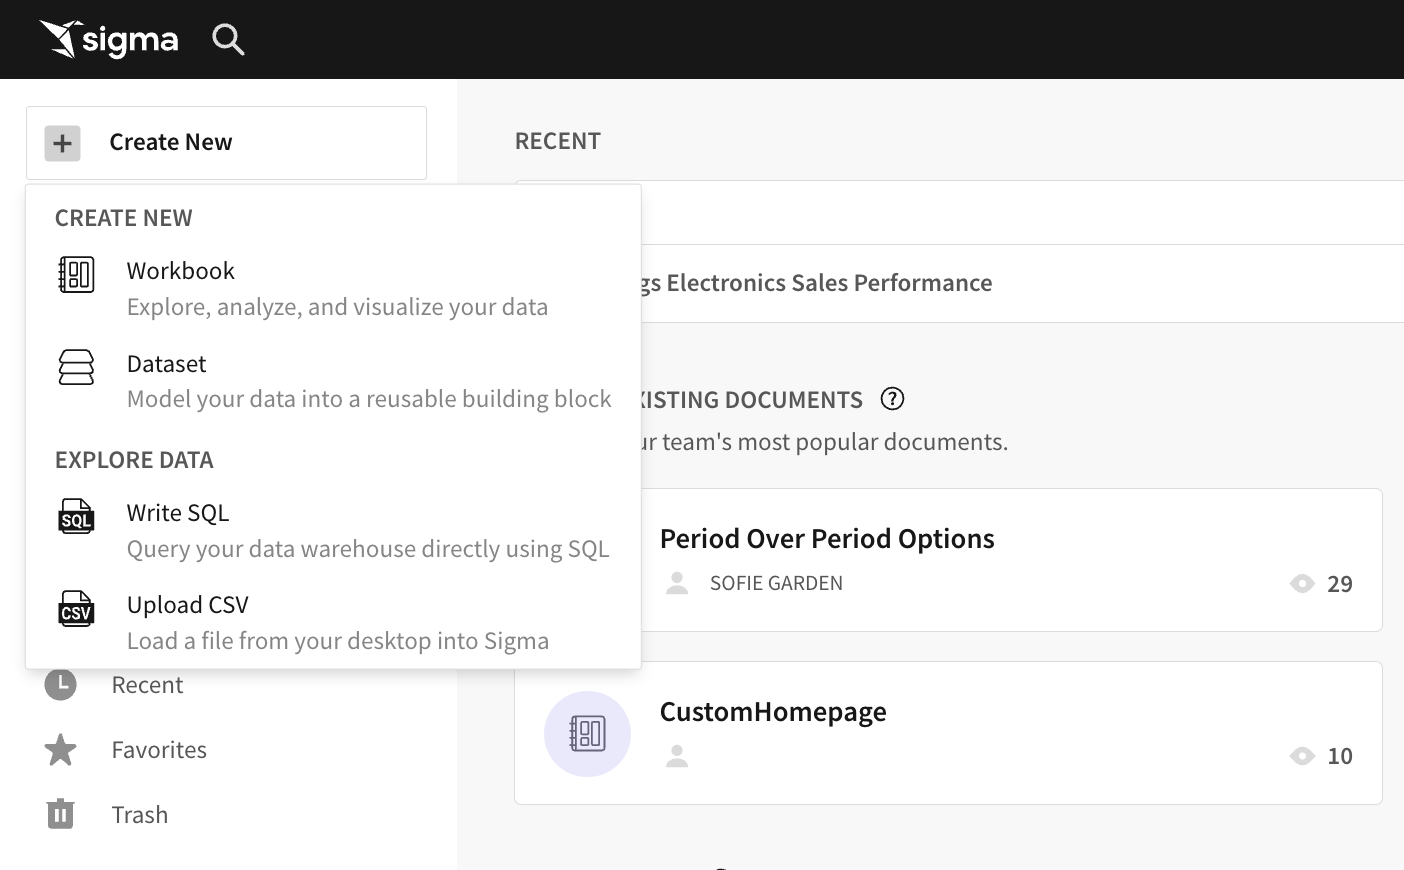
Click create new dataset from the Sigma homepage
This is as easy as clicking on the create new button in the top left corner and pressing dataset.
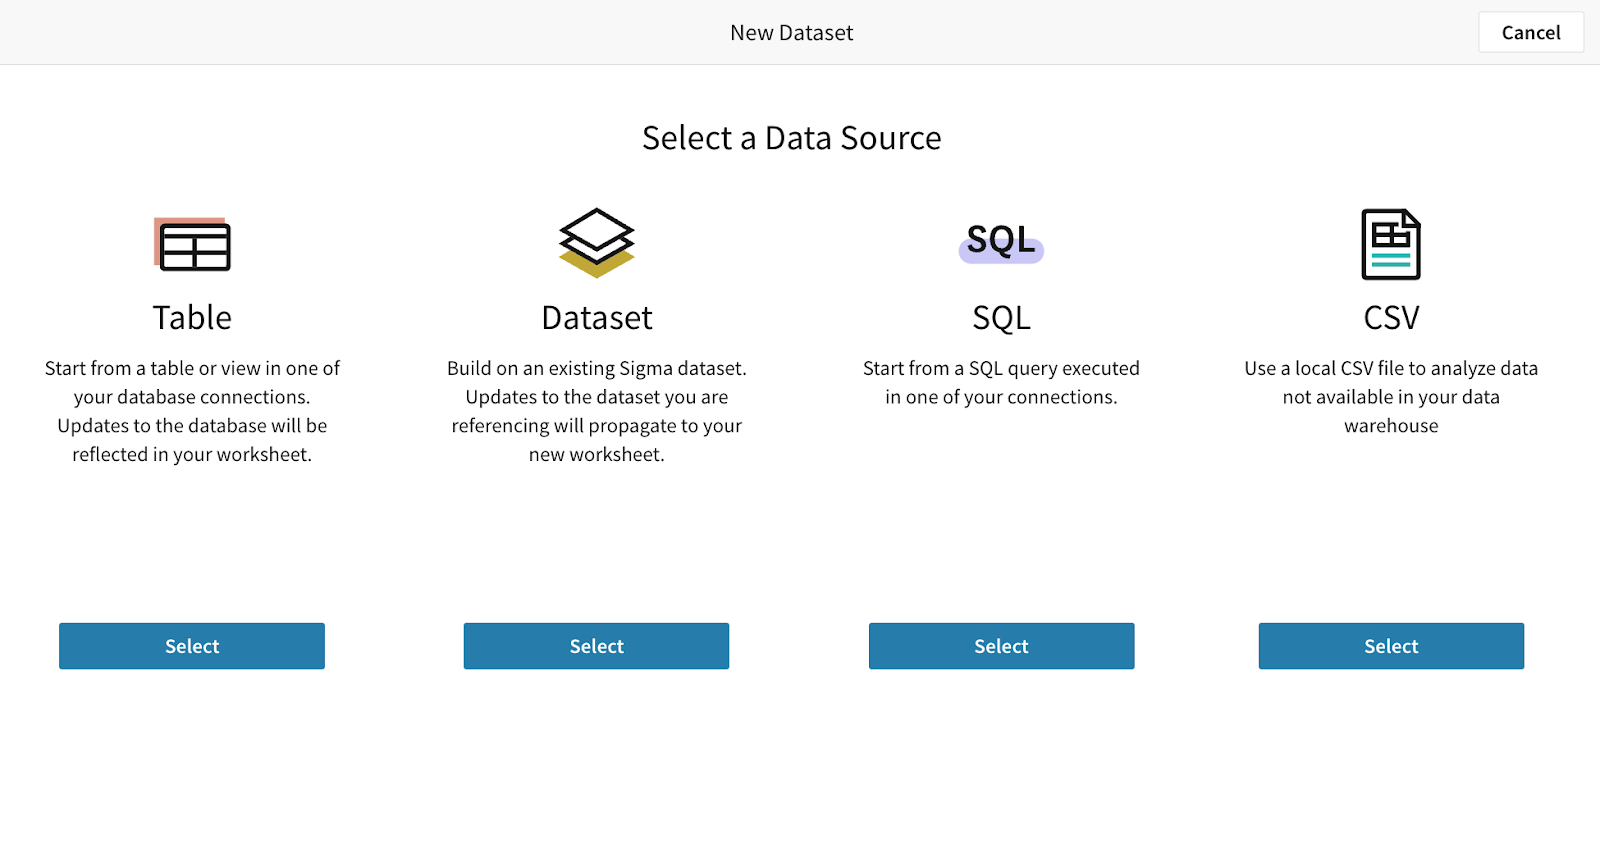
Pick the data source from where you want to build the dataset from
You can grab data from an existing cloud data warehouse table, an existing dataset already inside of Sigma, a custom SQL query, or a CSV.
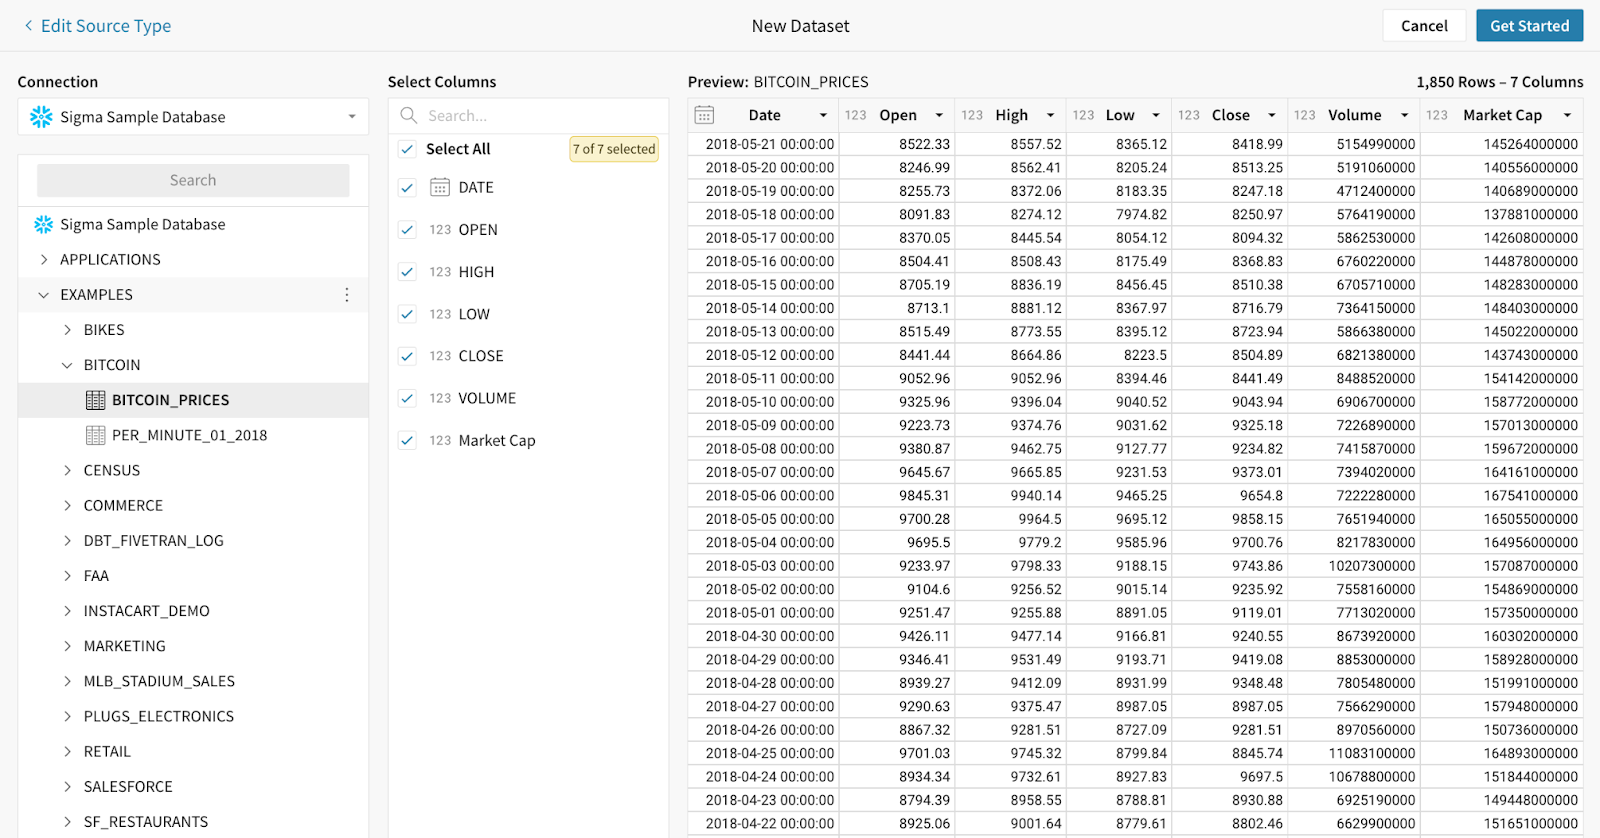
Create your dataset
For this example, we chose a table from inside of Snowflake, selected our columns, and built a dataset.
Publish your dataset and build it into a workbook
Simply press publish and find your new dataset ready for your data modeling needs inside of Sigma. Once you have pressed publish, you will be able to press explore, which will automatically generate a workbook from the dataset.
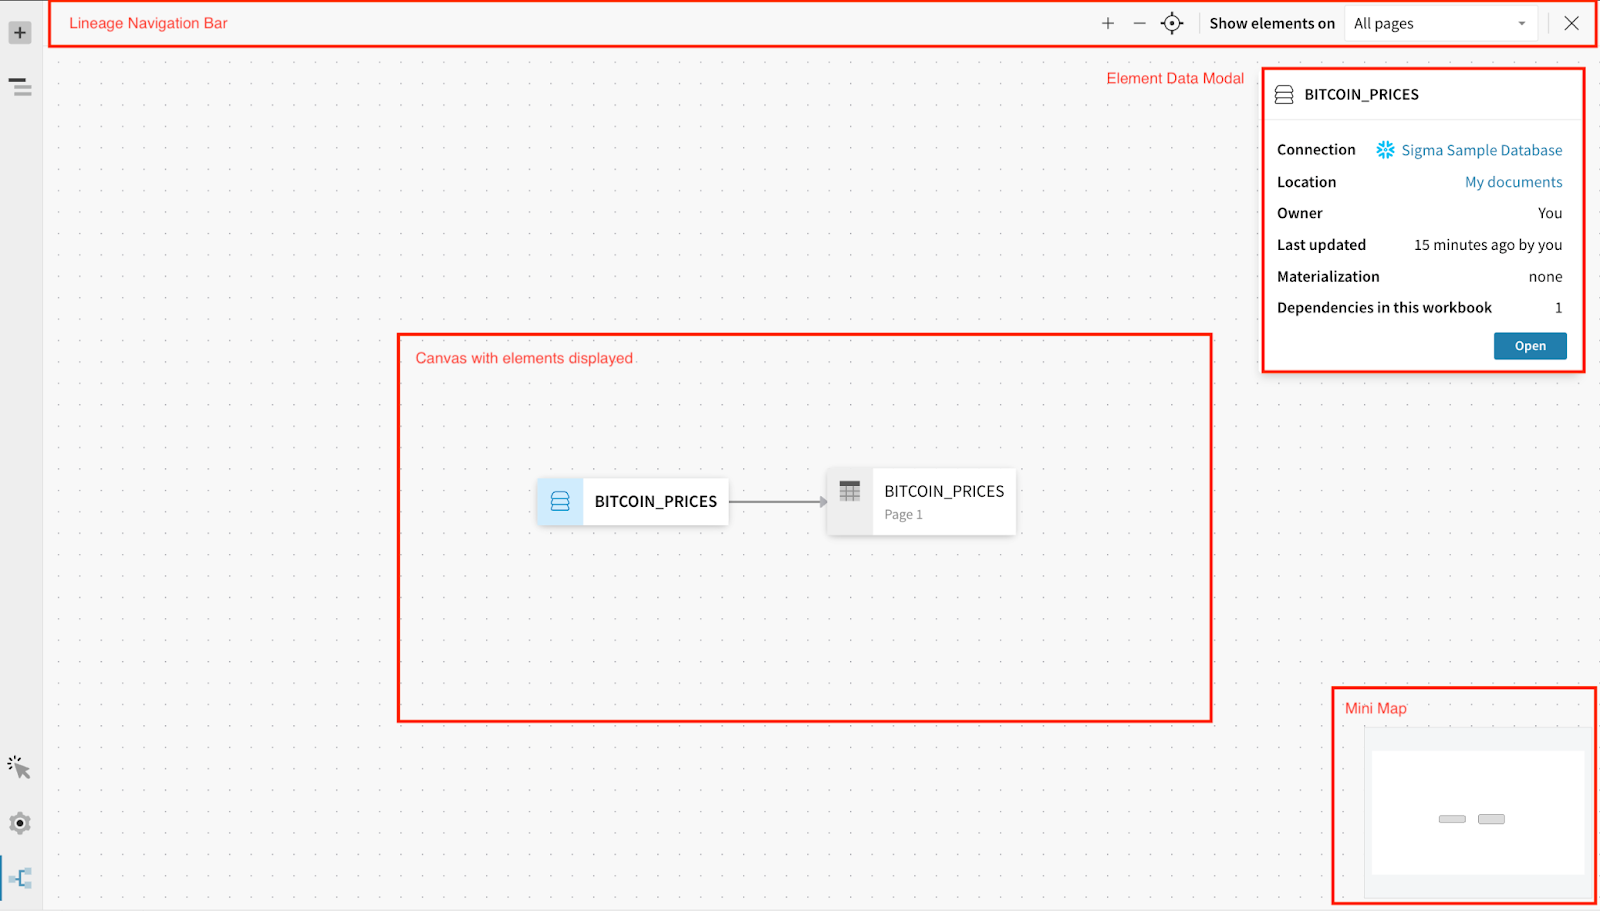
The basics behind the lineage view
Sigma’s lineage view can be broken into four essential elements.
- You have the canvas, which contains all of the datasets, tables, visualizations, joins and the relationships between those elements.
- You have the lineage navigation bar, which contains all of your controls for managing the specific types of elements you view, the size and position of the view, and the ability to close and click back to your workbook.
- You have the element data modal, which provides specific context about the individual element you have selected from the view and your ability to jump directly to that element in Sigma.
- You have the mini-map, which provides you with a rough diagram of the individual elements inside of the view.
The essential value behind a visual data management system is our ability to see inheritance of data from one element to the next, ensuring accuracy and consistency across our workbooks.
Managing your workbook with Lineages
In this example, we’ve managed to do some rudimentary analysis on the price of bitcoin in the year 2013. We’ve built a series of visualizations and a pivot table to group the individual days and their relative prices into the relevant months and years. Let’s take a look at this example from the workbook view to the lineage view and point out some interesting insights that lineages can give us.
Learn from our workbook data
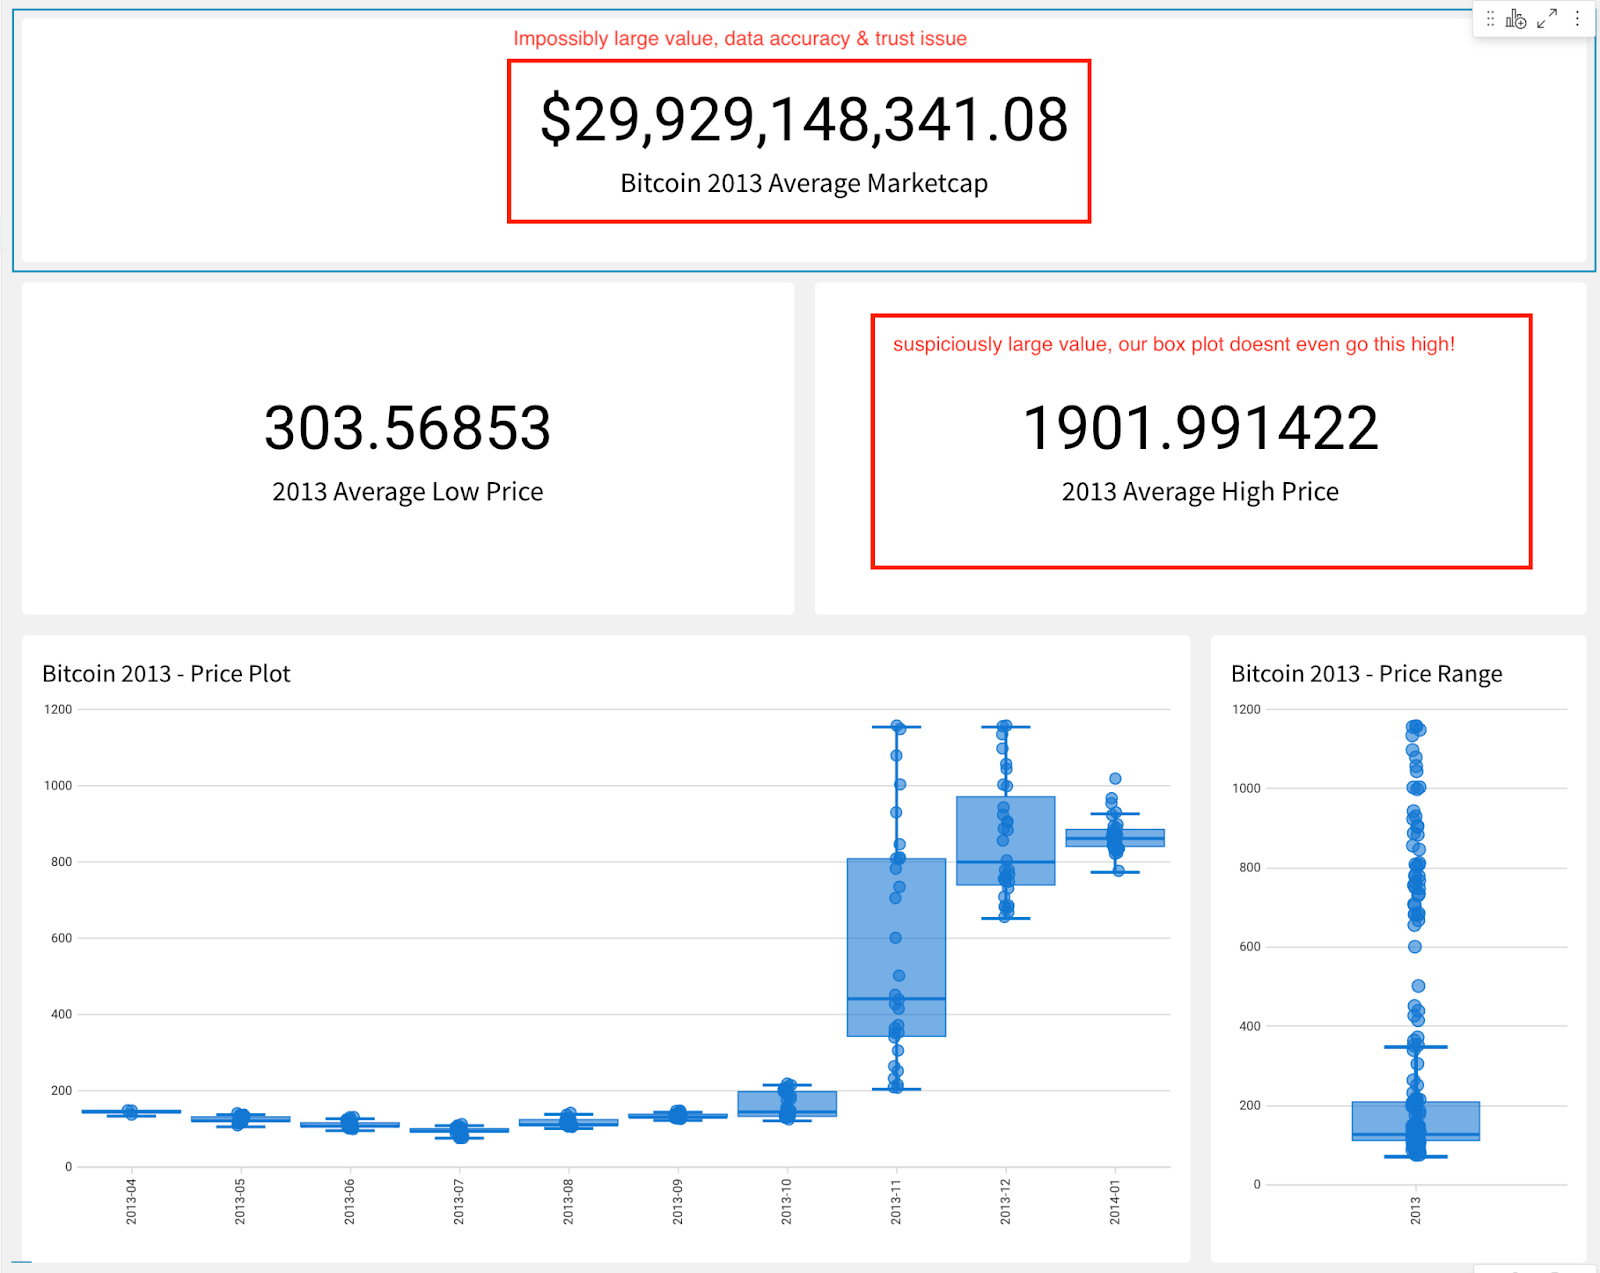
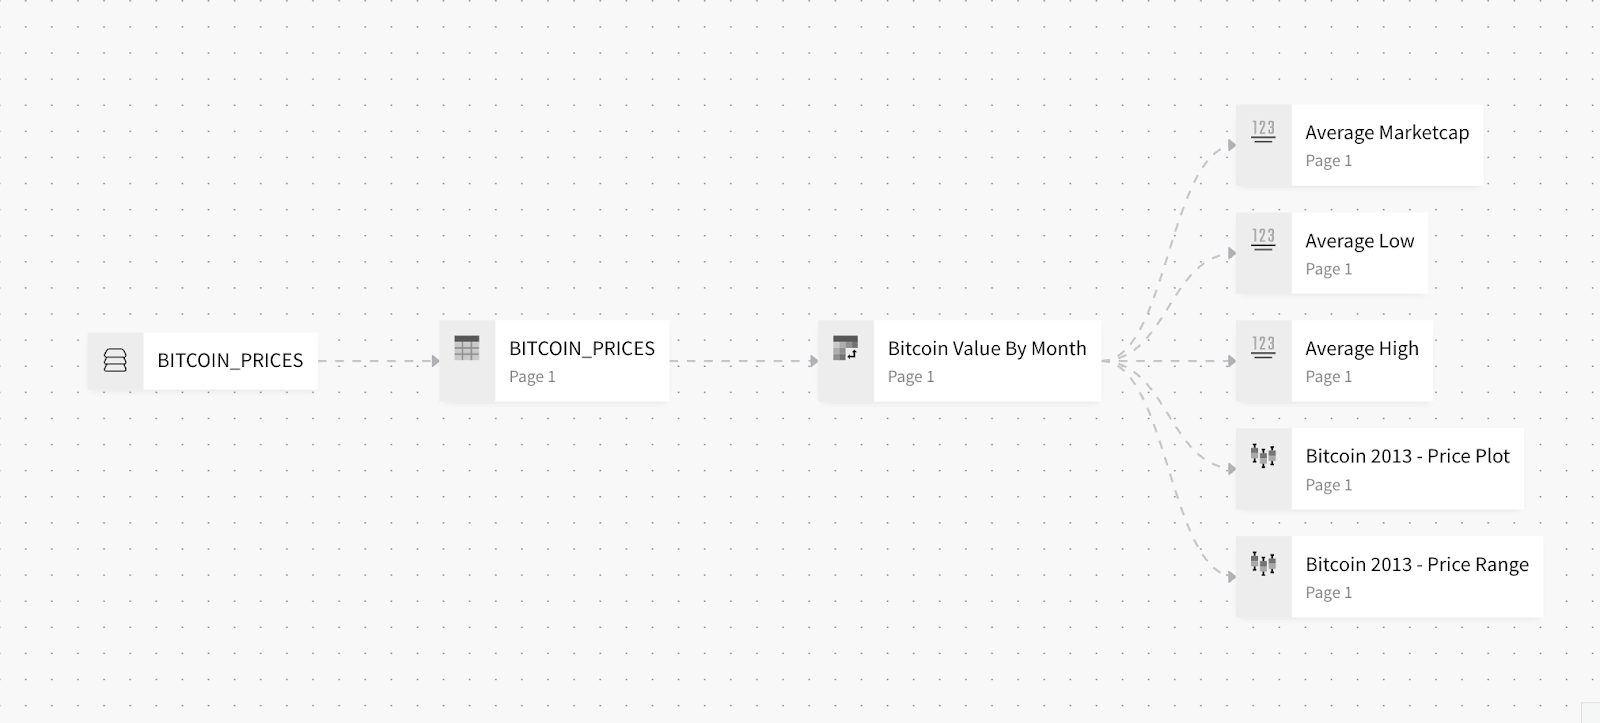
In our analysis, we’ve created five different visualizations to try and better understand the price movement and value of the cryptocurrency in 2013. We’ve created two box plots from a pivot table, an average high price, an average low price, and a market capitalization average for the period.
In our analysis, we’ve noticed that two of our visualizations have data that could be incorrect or simply impossible. The average market capitalization is displayed as 30 billion, which is 28x its actual value., And the average high price is above what the highest value in our boxplots show!
In essence, we know something is wrong, but understanding what went wrong at each step can be incredibly difficult with traditional tools.
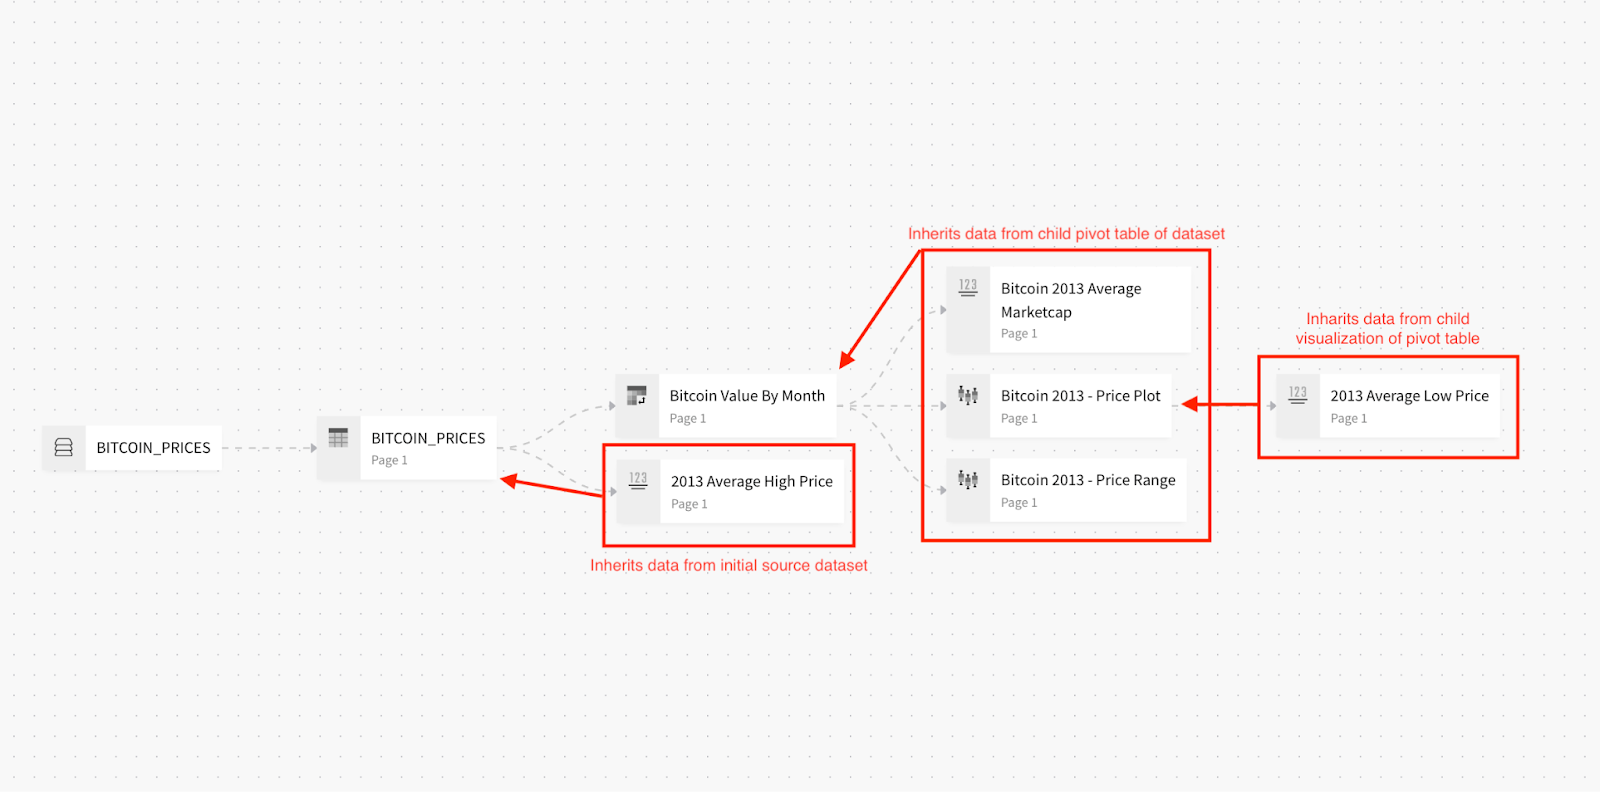
Breaking down our bad data model
With Lineages, we can break down where each value inherited its data and triage the broken values to ensure our analysis is correct. We see in this example that our visualizations are taking data from different elements inside of the workbook and it’s causing us analysis pain and workbook inconsistencies. It would have been extremely difficult to understand or see this without the use of lineages.
Rebuilding our workbook from insights given to us by lineages
If we follow a common pattern for building good analysis inside of Sigma, we would ensure that our relevant visualizations all inherit data from a single dataset or derived dataset like a pivot table. If you take a look at the example now below, you can see the entire workbook’s visualization has been built against the single summarized pivot table.
Looking at this from the workbook view, we can see how this is more beneficial. We’ve also made the improvement of creating a control filter on the dataset itself so that if we wanted to look at more recent or different date ranges, we can see that data populate in the workbook. This increases our flexibility and control of the data.
Understanding the inherent value behind lineages
Keeping it simple, the value behind lineages include:
1. Visual data management: Lineages allows users to visually manage their entire workbook, including joins, derived datasets, and visualizations, all from a single, easily accessible view.
2. Consistency and accuracy: Lineages help maintain consistency and accuracy across workbooks by tracing the inheritance of data from one element to the next.
3. Error identification and troubleshooting: Lineages makes it easier to identify and resolve issues in a workbook by providing a clear overview of data relationships and dependencies.
4. Simplified navigation: The lineage navigation bar provides controls for managing element visibility, view size and position, as well as the ability to switch back to the workbook.
5. Context-specific information: The element data modal displays specific context about the selected element and allows users to jump directly to that element in Sigma.
6. Flexible data exploration: Lineages enables users to explore data lineage on a per-workbook page basis or for specific elements, allowing for more focused and efficient data investigation.
7. Streamlined workbook cleanup: With Lineages, users can easily identify unused or redundant elements or calculations and remove them from the workbook, resulting in cleaner, more efficient workbooks.
Frequently asked questions about lineages
What is Lineages in Sigma and what purpose does it serve?
Lineages is a visualization and data management system integrated within Sigma, designed to facilitate the efficient mapping and organization of data transformations, joins, unions, queries, and visualizations associated with any workbook inside the platform. The primary objective of Lineages is to enable users to maintain data accuracy and consistency throughout their workbooks by offering a comprehensive visual representation of the relationships between different data elements. By leveraging the capabilities of Lineages, users can effectively manage complex data models, diagnose and resolve data issues, and streamline workbook maintenance, thus enhancing overall data analysis and visualization processes within Sigma.
How can I access the Lineages view for my workbook in Sigma?
To access the Lineages view for your workbook in Sigma, follow these steps:
- Ensure that you are in edit mode for the desired workbook. If not, click on the 'Edit' button located in the top right corner of the page to enable editing.
- Locate the lineage icon, which is typically situated near the bottom of the workbook's sidebar. The icon resembles a network diagram or interconnected nodes.
- Click on the lineage icon, and the Lineage view for your workbook will be displayed. From this view, you can observe the relationships between various data elements, manage their connections, and navigate to specific components as needed.
Can I customize the Lineages view to show only specific elements or pages in my workbook?
Yes, you can customize the Lineages view to display only specific elements or pages within your workbook in Sigma.
To achieve this, follow the steps outlined below:
- Ensure you are in edit mode for the workbook by clicking on the 'Edit' button located in the top right corner of the page, if not already enabled.
- Open the Lineage view by clicking on the lineage icon near the bottom of the workbook's sidebar.
- Once in the Lineage view, locate the dropdown menu in the top right corner of the page. By default, it is set to 'Show all elements.'
- Click on the dropdown menu and select the desired workbook page or specific element type that you wish to display in the Lineage view.
Upon completing these steps, the Lineages view will be updated to show only the elements or pages specified by your selection, allowing for a more focused exploration of the data relationships within your workbook.
How do I use Lineages to identify and resolve data inconsistencies or errors in my workbook?
Utilizing Lineages to identify and resolve data inconsistencies or errors in your workbook involves the following steps:
- Access the Lineages view by ensuring you are in edit mode for the workbook and clicking on the lineage icon near the bottom of the workbook's sidebar.
- Examine the Lineages view to identify any irregularities in the data connections or inheritance patterns between the elements. Look for unexpected data relationships, missing data sources, or incorrect calculations that may be causing inconsistencies or errors.
- To investigate a specific element, click on its representation within the Lineages view. The element data modal will appear, providing context-specific information about the selected element and an option to navigate directly to that element in Sigma.
- Upon identifying the source of the inconsistency or error, navigate to the problematic element within the workbook and apply the necessary modifications or corrections. This may involve adjusting data relationships, recalculating derived metrics, or updating data sources.
- After making the necessary changes, return to the Lineages view to verify that the data inconsistency or error has been resolved. Ensure that the modifications have not introduced new issues by examining the updated relationships between the elements.
By following these steps, you can leverage the capabilities of Lineages to diagnose and rectify data inconsistencies or errors within your workbook, resulting in a more accurate and reliable data analysis and visualization process.


