Product
  • Overview

  • Product Features

  • Embedded Analytics

  • Input Tables

  • Data Visualization

  • Data Modeling

  • Sigma AI

  • Templates

  • What's New

Solutions
  • Industries
    • Marketing Analytics

    • Sales Teams

    • Retail & CPG

    • Supply Chain Analytics

    • Financial Services

    • Healthcare

  • By Role
    • Analyst

    • Data Engineer

    • IT / Admin

      Product Leader

      Business Leader

Why Sigma
  • Overview

  • Customer Stories

  • The Sigma Difference

Resources
  • Overview

  • Help

  • Blog

  • Community

  • Interactive Demos

  • QuickStarts

  • Events & Webinars

  • Product FAQs

  • Learn

Partners
  • Overview

  • Technology Partners

  • Consulting Partners

  • Partner Integrations

  • Become a Partner

Company
  • About

  • Newsroom

  • Careers

sign infree trial
Skip to content
  • All Product FAQs
  • Connections
    Connections Overview
    Sigma Compute Cost Efficiency and Caching Overview: Snowflake and BigQuery
  • Data Modeling
    Best practices when working with large data sets
    Data Modeling in Sigma
    How to Use Metrics and Governance in Sigma
  • Embedded Analytics
    Communication Between Parent and Embed Application
    Embedded Analytics & Security
    Embedded Analytics: BI Connections & Multiple Environments
    Get the Most Out of Sigma, Out of Sigma!
    How to Customize the Look and Feel
    Workbook Software Development Lifecycle with Version Tagging
  • Input Tables
    How to use input tables, a practical guide to dynamic calculations and scenario modeling
    The Core Use Cases For Sigma’s Input Tables
  • Security & Administration
    How to Set Up Row-Level Security in Sigma
    Data Discovery at Sigma: How Admins Promote Better Discovery
    How to Configure Role-Based Access Controls inside Sigma
    How to Use Sigma’s Usage Data and Logs
  • Visualizations
    A Thoughtful Catalog of the Sigma Visual Library
    How to Improve Your Team's Data Maturity with Sigma
  • Workbooks
    How to get the most out of lineages in Sigma, from dataset to workbook
    Sharing Content: Users, Teams, & Workspaces
    How easy is it to use Sigma?
    Collaboration in Sigma
    How to explore, build pivot tables, and build scenario modeling
    Schedule Email and Exports in Sigma
  1. Home
  2. Product FAQs
  3. Workbook
  4. How to explore, build pivot tables, and build scenario modeling

How to explore, build pivot tables, and build scenario modeling

No items found.

Sigma provides an instantly familiar, spreadsheet-like interface combined with enhanced functionality to let users explore data, unconstrained by the scale of their data warehouse or limitations of legacy BI tools.

What kind of spreadsheet features are provided “out of the box”?

Sigma provides all the common features of a spreadsheet and so much more. For example, users can create groups, run aggregates like sum and count, as well as add calculated columns and pivot table data with ease. Going from a flat view of data to a feature-rich pivot table takes just minutes of experience and isn’t limited like Google Sheets or Excel on the number of rows.

How do I start to explore my data?

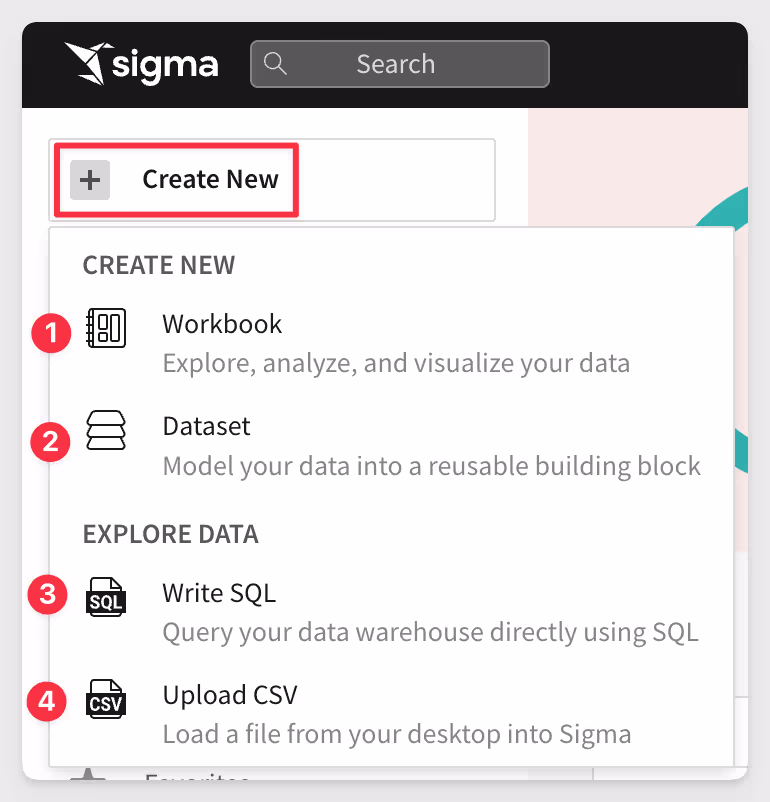
Click the “Create New” button and create a new Workbook, Dataset, Write SQL — Yes, we also support developers who like to work in SQL — or upload a CSV file from your computer. 

Once you have selected your data, you are off to the races.

How hard is it to group data?

It’s not hard, it’s incredibly easy.

In the example below, the user just drags the column name to be grouped to the Grouping section, and the table is immediately grouped, as shown below in the output to the right. 

Also notice that even our sample data is large. This table is a mere 4.5+ million rows.

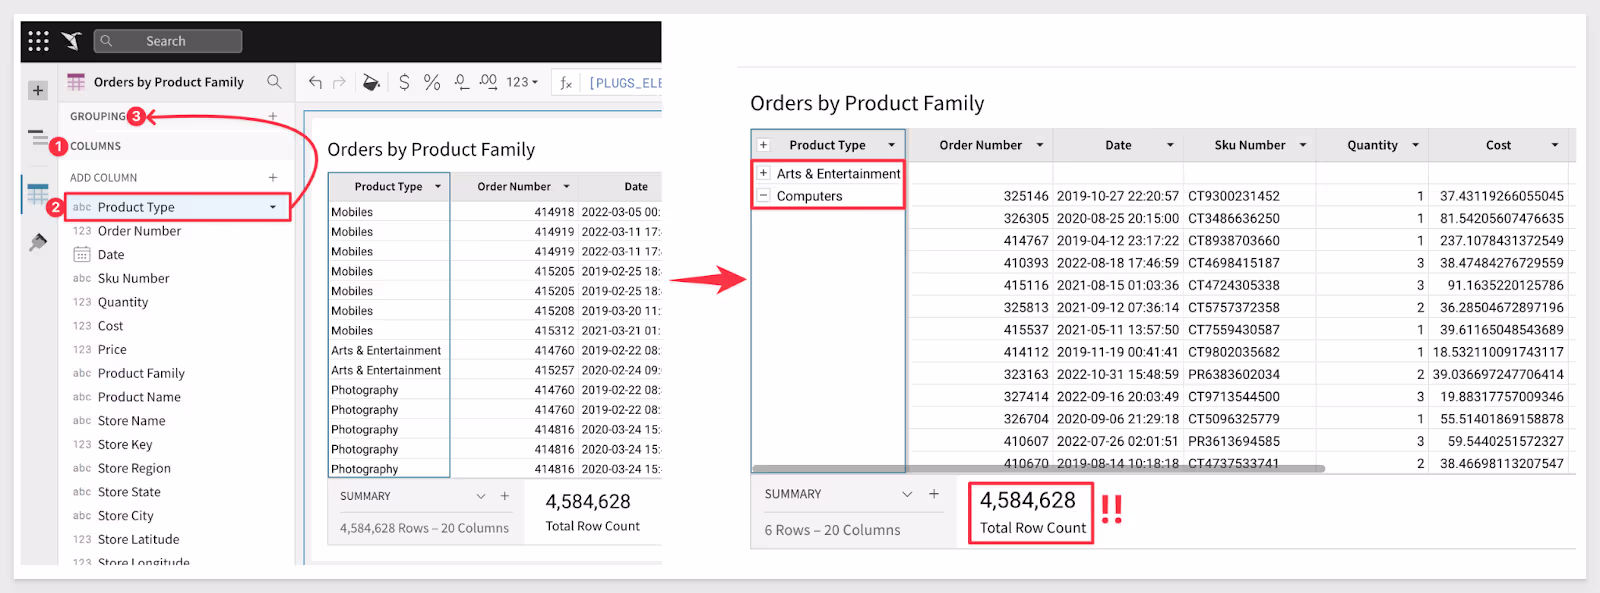
The user can also just click the column itself and select the group option. Sigma lets you choose the workflow that you are most comfortable with.

Learn more about Grouping Tables.

How hard is it to pivot my data?

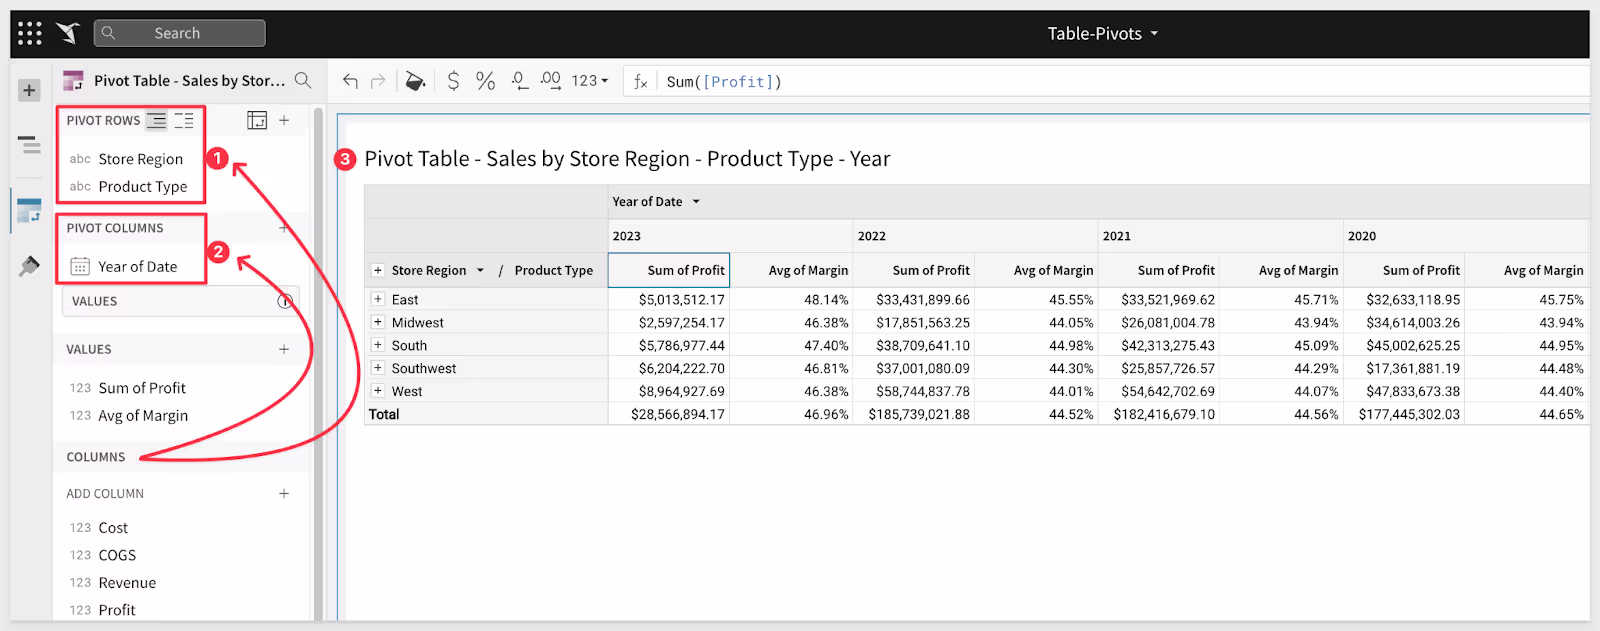
Pivoting data in Sigma is very straightforward. In example below, the user only had to select their data, drag the Store Region and Product Type and Date columns to the grouping. Sigma did the rest, creating the pivot table shown:: 

Learn more about Pivot Tables

Can I add user-selectable controls to drive scenarios?

Yes, there are three features that customers use to create interactivity and allow for scenario modeling: 

1: Filters:

In Sigma, filters allow you to limit your data to show only that which meets certain criteria. Filters are created directly from a single element, typically by a Data Analyst who is preparing data for use. Filters can be converted directly to a Control with a single click. For example, limiting the Store Region to South using a filter:

Learn more about filters.

2: Controls:

Control elements are built and used to manipulate displayed data by end users. For example, a drop-list of possible values that change a dashboard is called a Control:

Adding controls is simple and you can add as many as you like to a Workbook Page.

‍Learn more about Controls.

3: Input Tables:

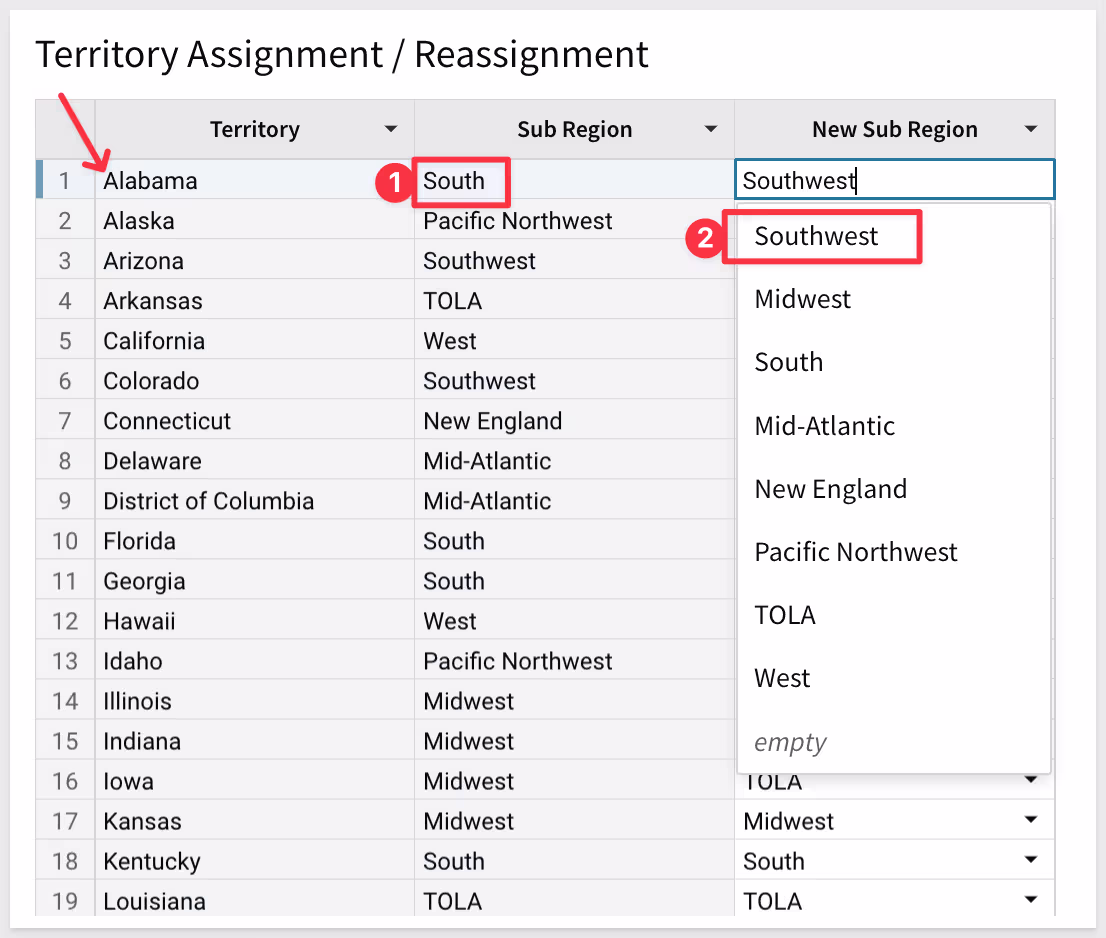
An Input Table is a data element that accepts manual data input (from the user) at the cell level. Input Tables can be used for basic data entry, integrating data outside your warehouse into your Sigma analysis, allowing you to perform what-if type analysis. Data added to an Input Table can be used to drive changes across other Workbook Elements. 

For example, a sales manager may want to reassign Alabama from the South to the Southwest territory. Input Tables allow them to make that change (without changing the source data,) and then see the effect on the Sales by Territory chart.

Learn more about Input Tables.

Can I see where my data is coming from visually?

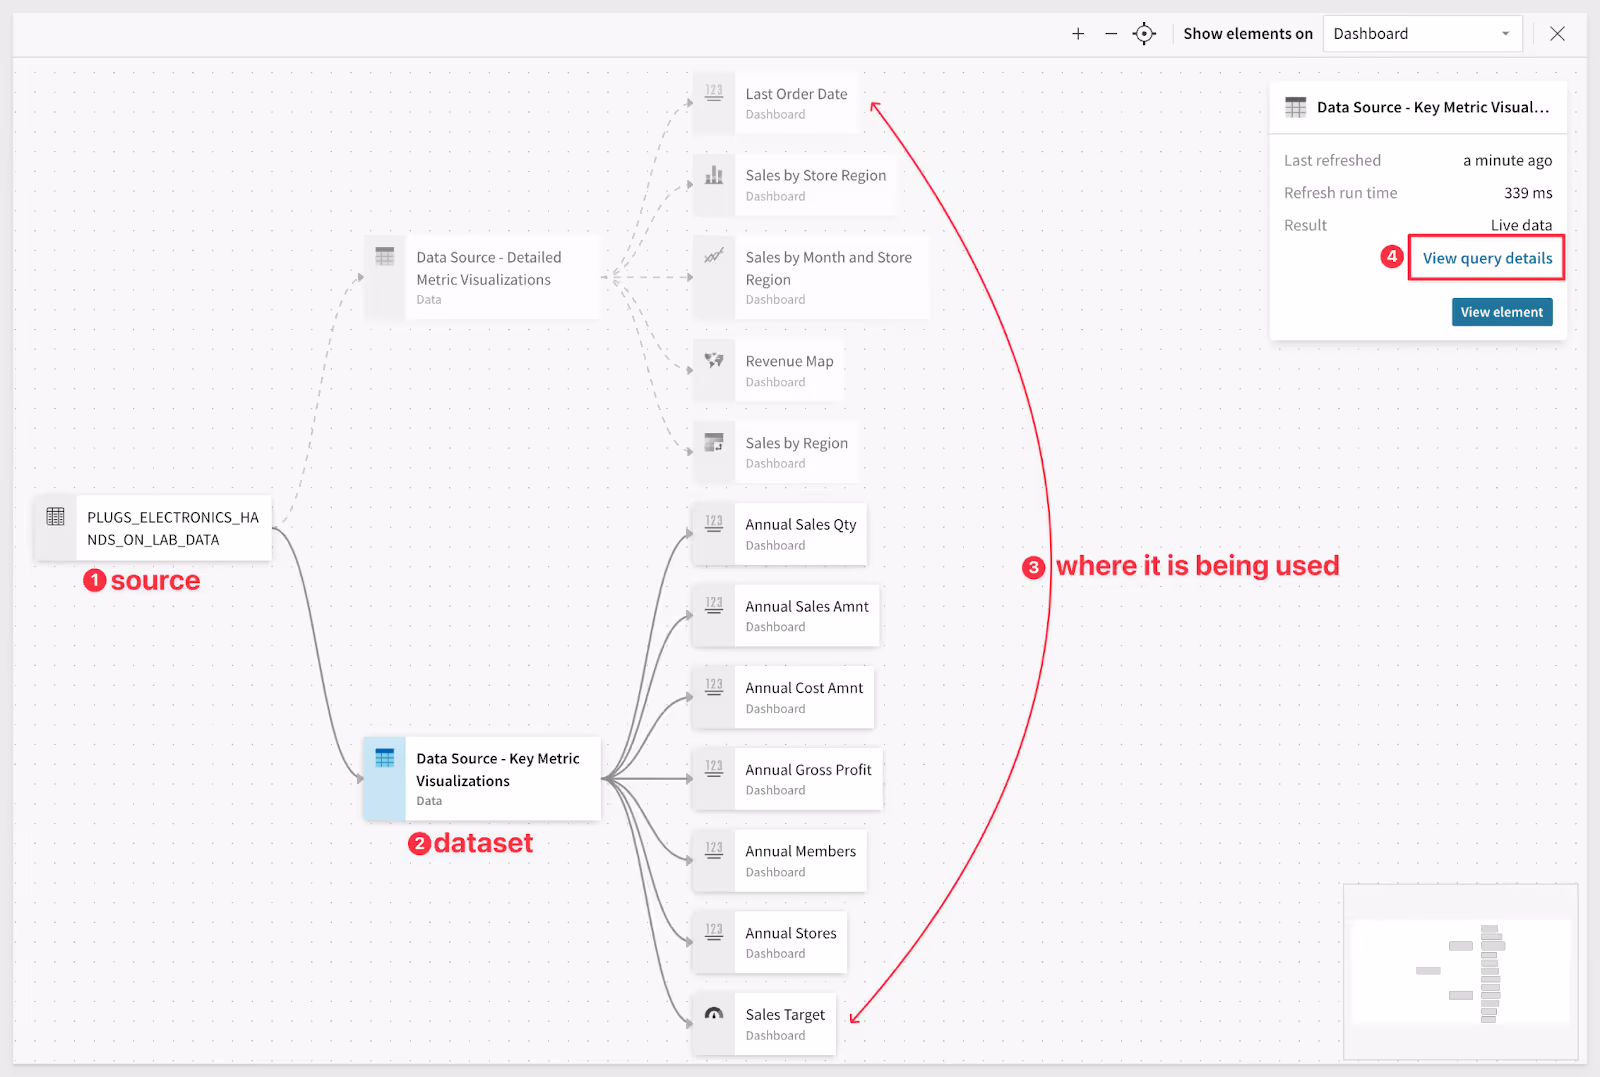
Yes you can. This is typically used by Data Analysts who want to ensure they understand the data flow being used and what content it is driving. Click on any Element and select “View Lineage”. Sigma will show you the source of data, what is joined to it, and the output in a visual diagram. In the simple example below, the data is coming from a single source into a reusable Sigma Dataset and then being consumed by various dashboard tables, charts, and KPIs:

Learn more about Sigma Lineage.

Where can I learn more about Sigma features and use cases?

Our online documentation is a great way to get high-level information on product features along with as much fine detail as you want.

Sigma QuickStarts provide “step-by-step” guides to using Sigma, exploring specific features and use-cases.

Looking for more information?

Quickstarts

We are Sigma.

Sigma is a cloud-native analytics platform that uses a familiar spreadsheet interface to give business users instant access to explore and get insights from their cloud data warehouse. It requires no code or special training to explore billions of rows, augment with new data, or perform “what if” analysis on all data in real⁠-⁠time.

Free TrialRequest a Demo
Home

Product

  • Product & Features
  • Embedded Analytics
  • Security
  • Free Trial
  • Live Product Demo
  • Service Status

Resources

  • Blog
  • Resources
  • Events & Webinars
  • Customer Stories
  • Help Center
  • Community
  • QuickStarts

Company

  • About Sigma
  • Careers
  • Contact Us
  • Why Sigma?
  • Newsroom
© 2023 Sigma Computing
Privacy PolicyCookie PolicyWebsite Terms of ServiceCookie Preferences