


One important job of a Sigma administrator is empowering users to understand the tool and consistently find valuable and relevant content. Sigma offers several powerful mechanisms to help admins accomplish this. This article describes a few of the most popular mechanisms.
Managing Workspaces
First, Sigma offers the concept of “Workspaces”.
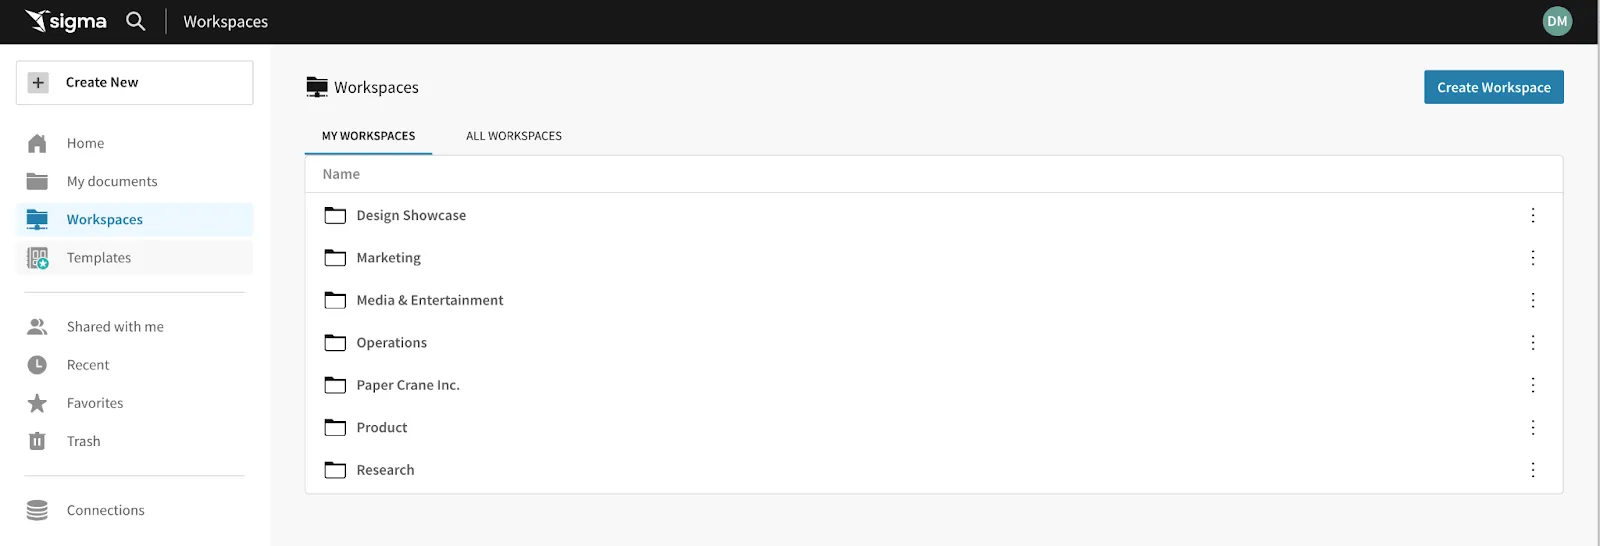
Workspaces are collaborative environments where users can create, organize, and share datasets, visualizations, and dashboards. Many organizations choose to create a separate workspace for each department or logical user group in their company.
Setting this foundation drastically simplifies the content discovery process for users. Each user has a single location where they can go to search and browse valuable content that’s relevant to their job function. Additionally, administrators can assign badges to content, to help make sure that the most valuable content is highlighted and immediately noticeable by everyone.
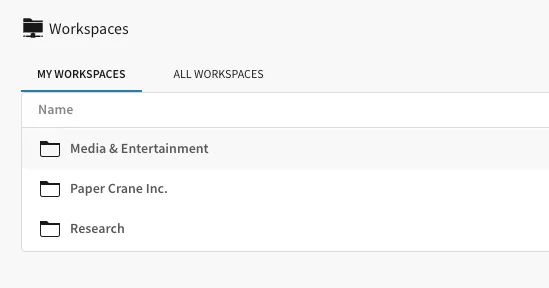
From there, Admins can also set access permissions for each workspace, to determine who can view, edit, and manage the content within a Workspace. This ensures that users are only able to see the Workspaces that they’ve been explicitly assigned. Admins still retain the ability to see “All Workspaces”, but other users will only see their assigned workspace.
Promoting Content
Once Workspaces have been created and users are generating content, Admins will want to understand who is creating the most content, how much that content is being accessed, and how to promote the most valuable content throughout their org.
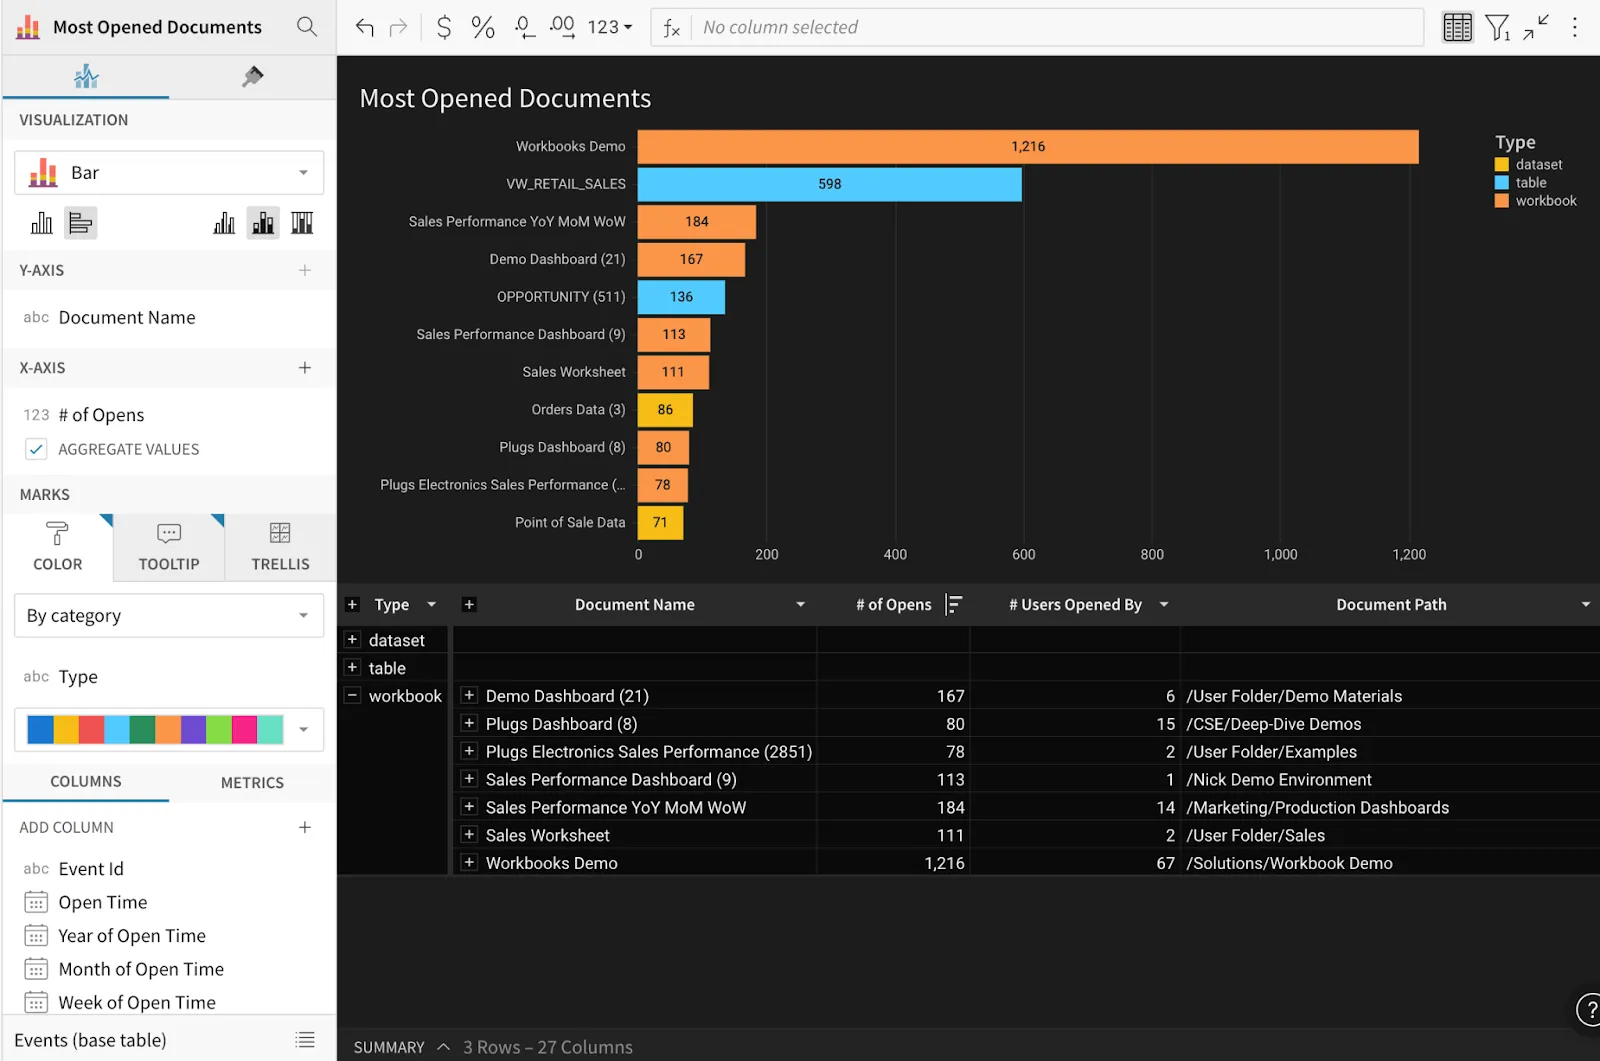
To accomplish this, Sigma has introduced several Usage Dashboards, available to Admins only in the administration panel. These dashboards provide detailed information on everything from user behavior, content popularity, scheduled exports, embed usage, and more.
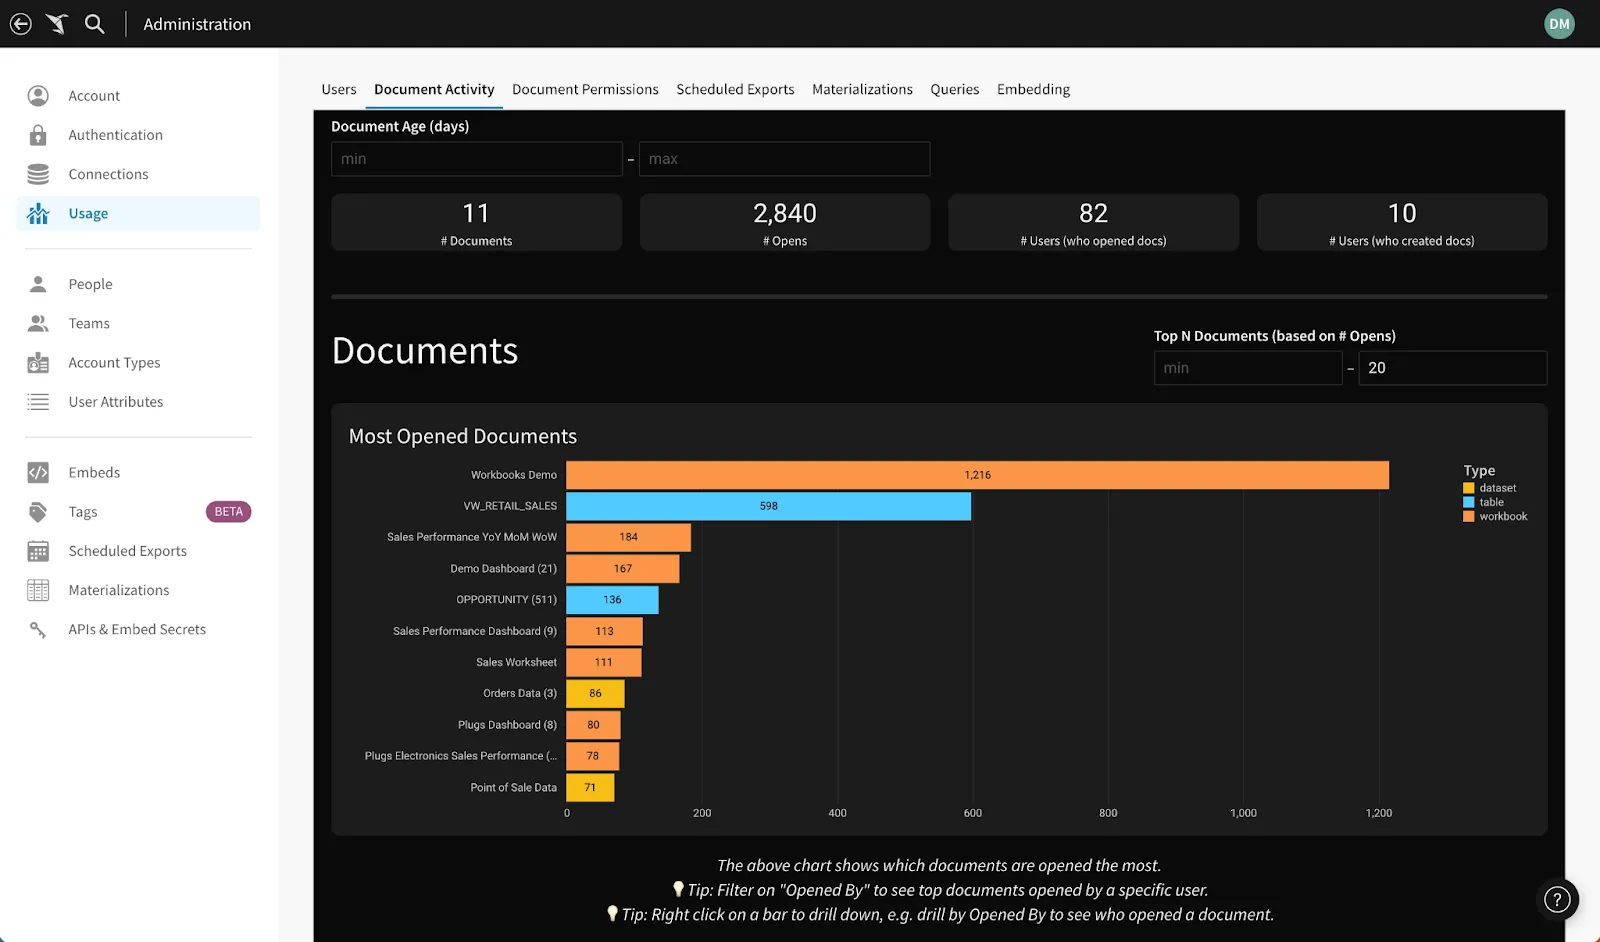
In the Documents tab, admins can quickly see how much content exists, which content is being used, who is creating content, and who is using it. Armed with this information, admins can promote the content that’s driving the most value across their organization.
For example, a member of a Customer Success team may make a dashboard called “Customer Health”, which takes tons of different inputs and provides an overview of a single customer, including usage, account status, key contacts, marketing information, and more. From the Usage Dashboards, an admin can see that this Customer Health dashboard is getting strong usage from the Customer Success org. An admin may see this, and recognize that the Sales, Professional Services, and Support teams would benefit from viewing this same information.
There are several mechanisms available to the admin to promote this content to the new users. The admin can:
- Schedule the dashboard to be exported (via Slack or email) on a weekly basis to all Sales, Support, and Professional Services teams using Sigma’s scheduled exports,
- Create a new, dedicated Workspace for all content that should be shared across these teams (e.g. “All Field Team”) .
- Move the dashboard to an existing All-Hands workspace where they house other shared assets,
- Create an internal wiki page where they provide links to the top Sigma content.
- Create a dedicated Slack or Teams channel to share valuable Sigma content.
- Build a custom homepage that displays the most important dashboards and datasets.
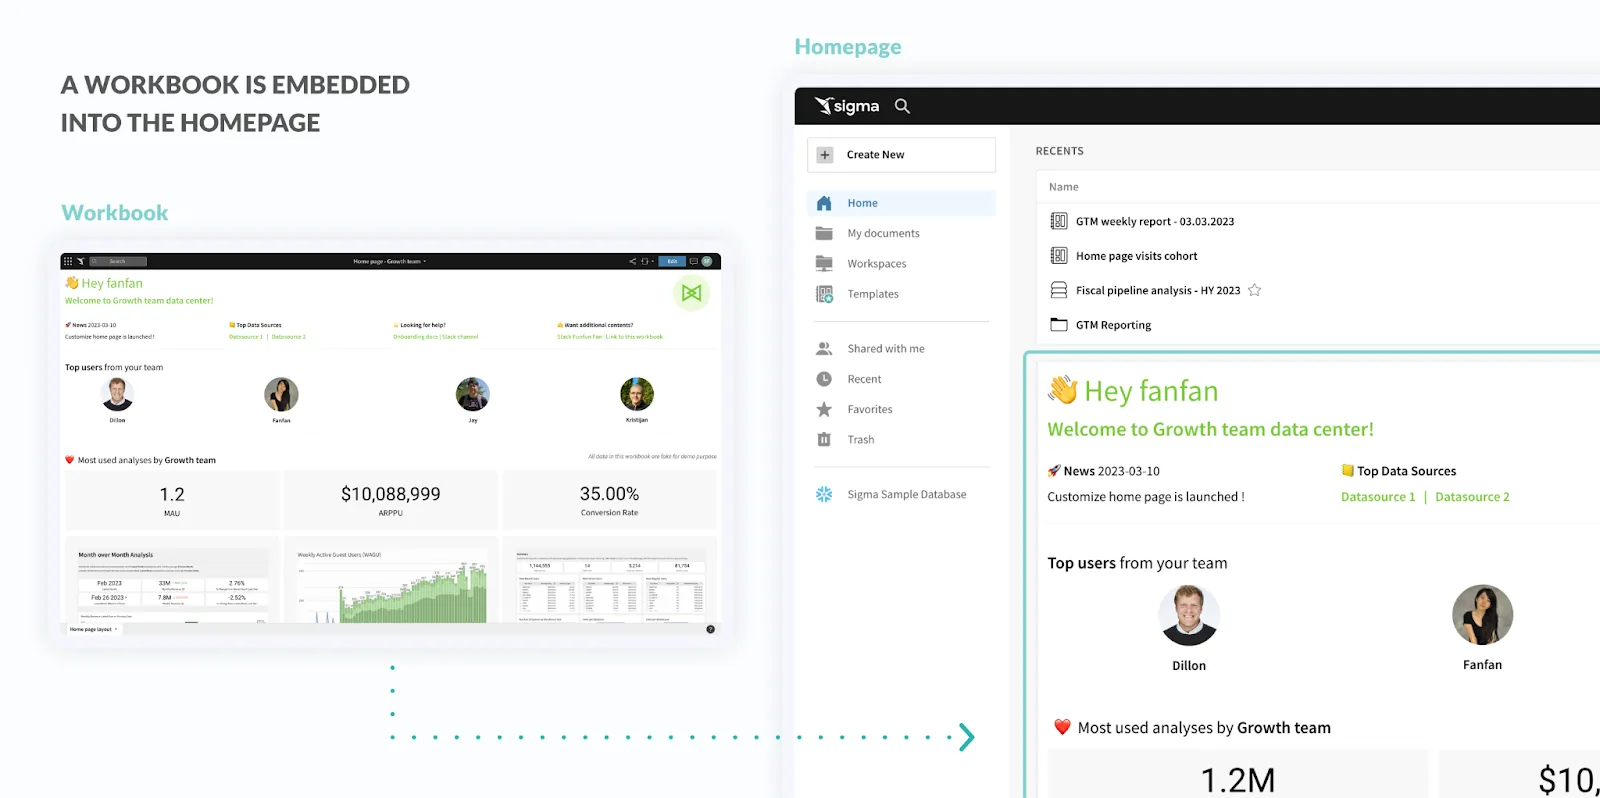
Using Custom Homepages
Custom homepages are particularly powerful for controlling the discovery process. Custom homepages utilize all the functionality of existing workbooks, which can then be embedded in the homepage. Users can control everything about the homepage and customize it with helpful links, images, rich text, videos and more. This ensures that whenever a user enters Sigma, they are immediately prompted with whatever content admins want them to see. As of this writing, Custom Homepages are in private beta. They’ll be released to public beta and GA over the coming months.
Supporting Users
Sigma’s usage dashboards also provide detail into what specific users are using different types of content. If there are certain users that are not using Sigma as frequently as their counterparts, it could be that those users haven’t been able to find any content that’s helped them make better decisions. To solve this, admins can filter the Usage dashboards by team to see what content is popular with their teammates, then share those dashboards with the underutilized users through Slack or a custom homepage.

Another reason users might not be as active as their teammates is that these users haven’t learned how to use Sigma properly yet. For these folks, Sigma offers a range of quickstarts (Fundamentals #1 is a great place to start), tutorials, and a hands-on lab. Like any other video or link, these tutorials and hands-on lab can also be placed directly on a Custom Homepage.
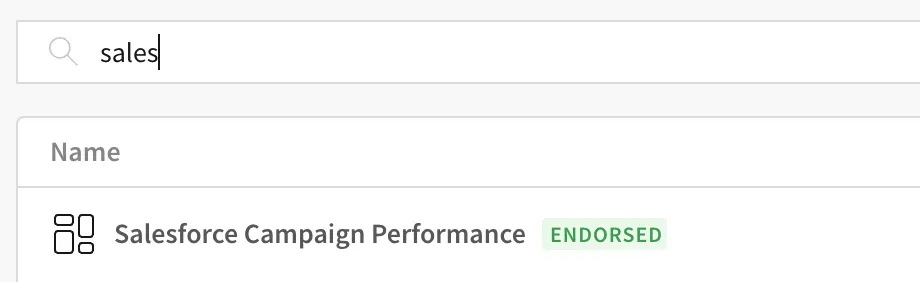
Badging
One way to promote the correct content is to add badges to the most relevant, up-to-date content. If a user clicks into a Workspace and sees 100 workbooks, or searches for content and sees multiple duplicate workbooks, it can be difficult to understand which content is actually relevant and helpful. Badging gives users the extra confidence that they’re looking at the right asset.
Audit Log and Freeform Access
Admins are not constrained to the analysis that Sigma provides with our Usage Dashboards, these are just a starting point. Admins can freely explore their application data and create custom analysis to view any user content across any dimensions they like. To do so, simply click the “maximize” icon on any element in the Usage Dashboards, and use the available fields to answer any new questions you may have.
As of this writing, admins cannot query this data outside of the usage dashboards, but Sigma has plans to add the ability to query application data from any workbook. Stay tuned for updates on this functionality.
Adding Descriptions to Datasets
Much of the writing so far has focused on helping users find existing dashboards and content. Another important component of data discovery is helping users understand what data to use whenever they want to create new analysis for themselves or teammates.
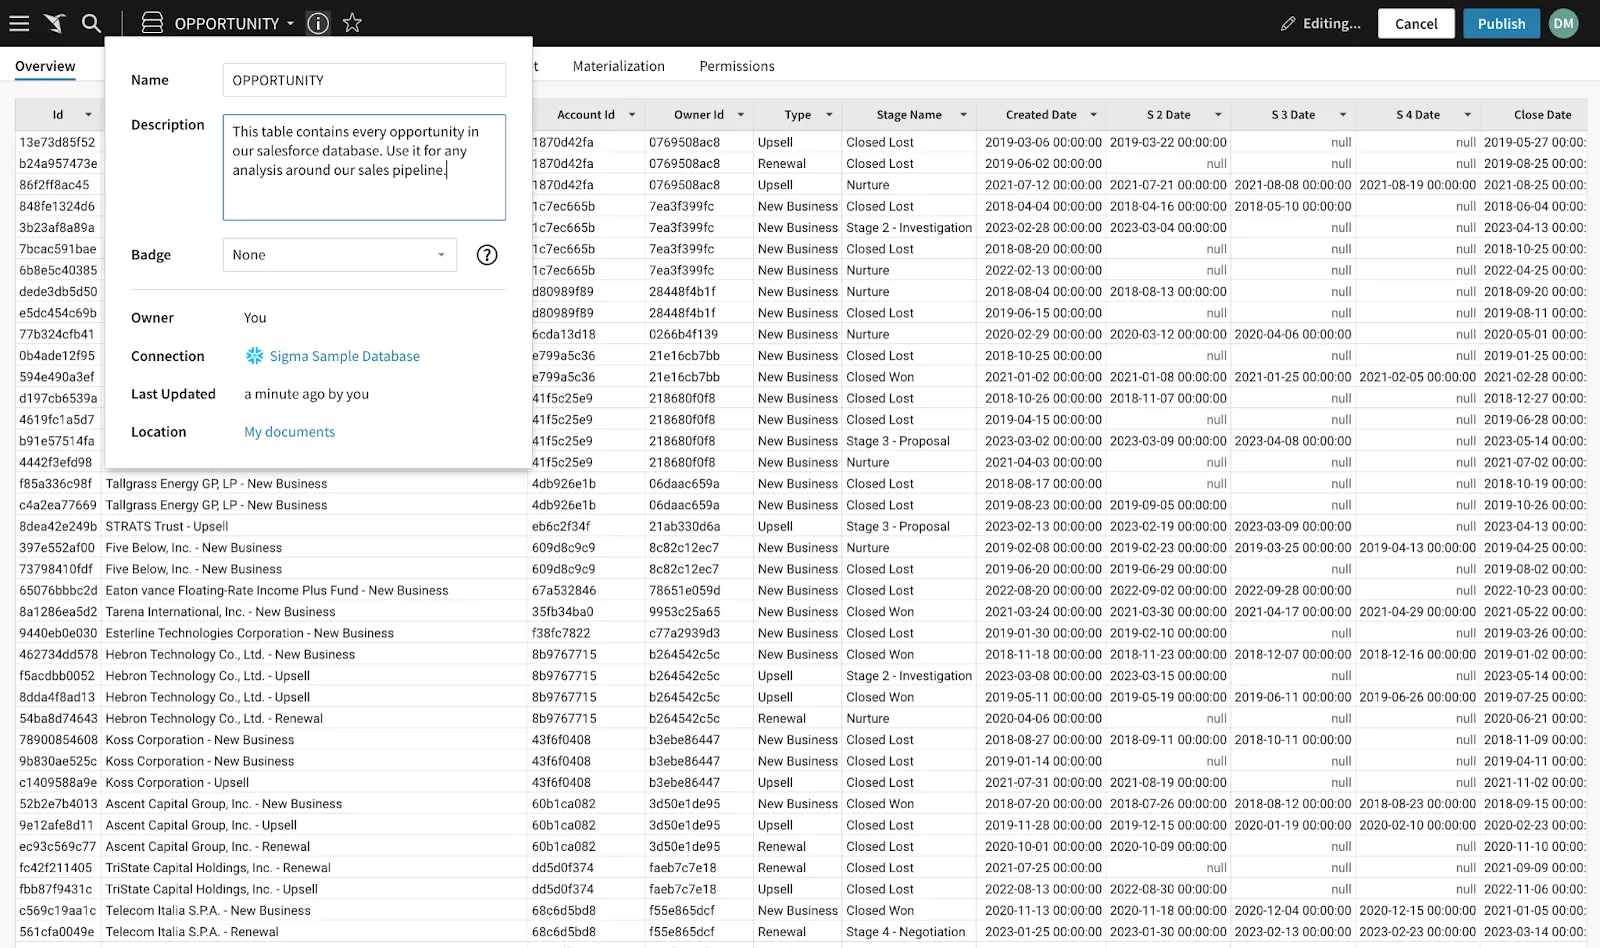
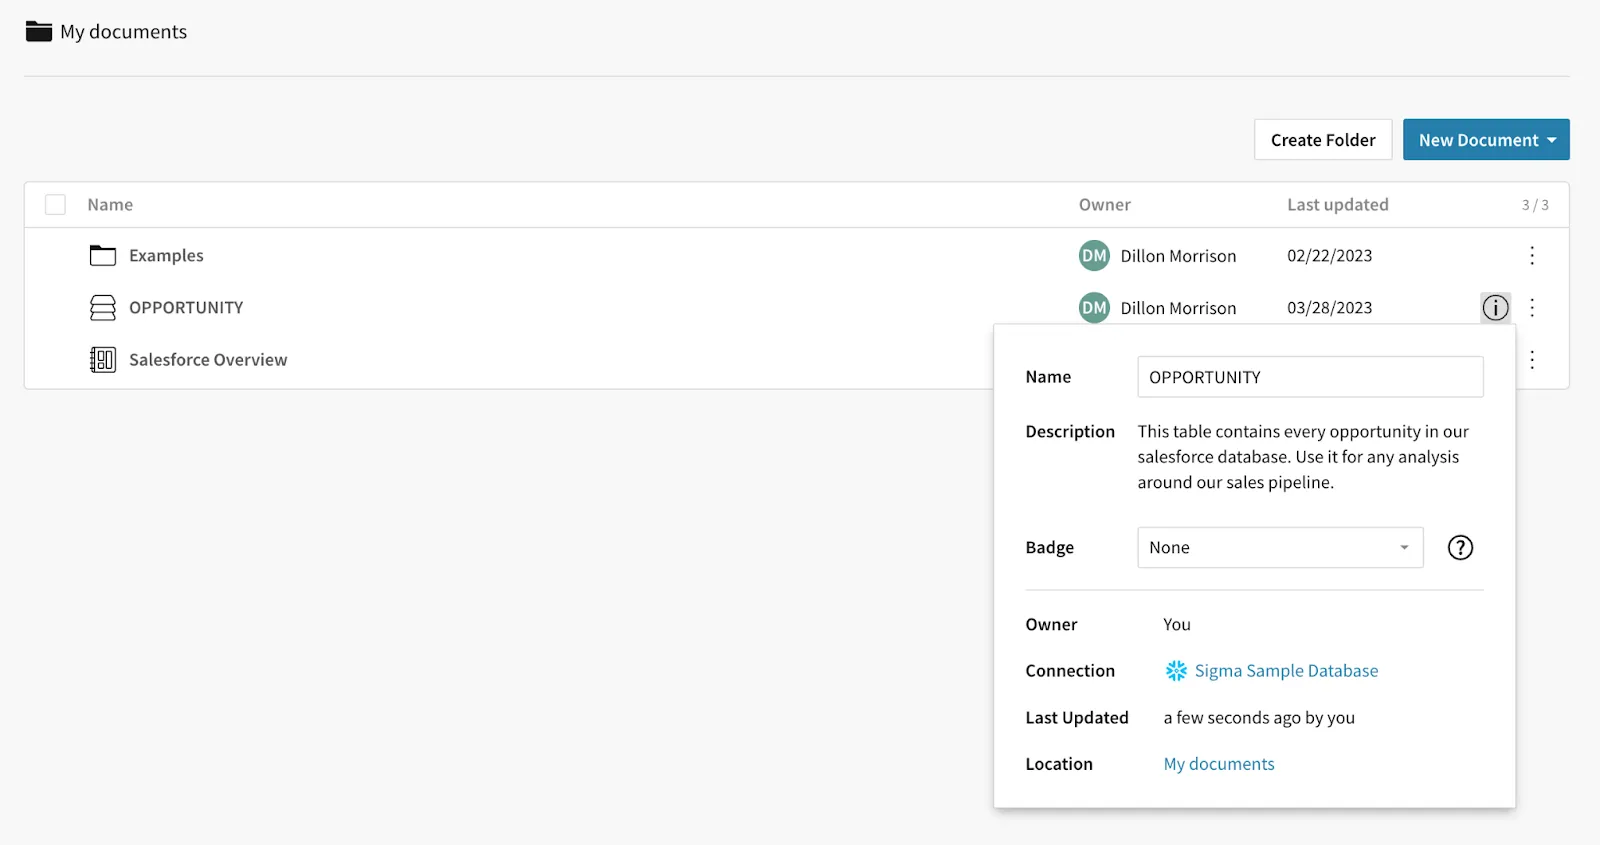
Datasets are a great tool that allows analysts to build reusable data tables for the rest of their org. Once a dataset has been created, admins and editors can add descriptions to these datasets. The descriptions are then surfaced in the display of a dataset. This gives users the context they need to get started analyzing new data. To accomplish this, users should create a new dataset or open an existing one. Once in a dataset, click “Edit”, then navigate to the dropdown next to the name of the dataset, and enter a description.
Aliasing and Describing Database Columns
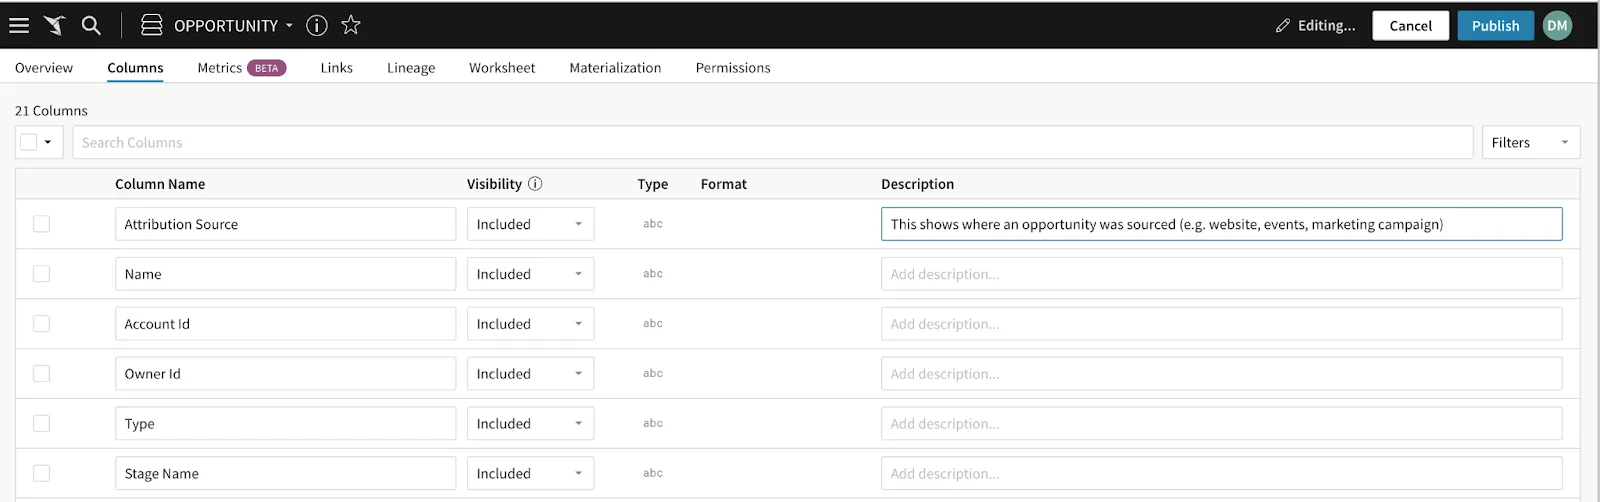
Database fields are often named using syntax or terminology that resonates with a data analyst, but might be difficult for an end user to understand. Sigma allows admins and editors to create friendly names for database tables. Whenever end users access these tables, they’ll see the new alias name rather than the database field name. From this view, admins and editors can also add descriptions to each individual column.
Read more of the top 20 questions we get about Sigma.


