Introducing Sigma’s New KPI Chart
KPI charts are crucial in data analytics because they provide concise visual representations of key metrics, enabling quick and informed decision-making. Which is why we recently decided to introduce our new KPI chart, which provides an even more accessible and user-friendly experience for our users. By creating bold key performance indicators (KPIs), big number charts capture the viewer's attention while maintaining a simple, aesthetic design.
Behind the scenes, we faced several challenges, including designing a chart that is easy to use and customize, while still being aesthetically pleasing and providing the necessary functionalities.
Read more about Sigma’s data visualizations.
Why KPI?
As a UX team, our goal is to design the market’s best data analytics product for the line of business (LOB). This includes people without data analysis backgrounds, such as Product Managers, Operations Specialists, and Marketers. So when we are tasked with the design of a new data element, our primary focus is creating intuitive user interfaces that level the analytics playing field and provide non-technical users the ability to get answers to their questions and tell compelling data stories to their audience. At the same time, we must ensure that data professionals have the powerful tools they need to perform more complex data analysis.
For this project, I worked side-by-side with Cheng, my engineering partner. We started by identifying goals for the new KPI chart:
- Introduce new chart functionality, notably the ability to specify a timeline and comparison metrics.
- Make KPI charts easy to create and customize
- Enable all charts to be aesthetically pleasing.
Read about all of the visualizations Sigma’s product supports.
What problem we want to solve
To create an effective KPI chart, we must first understand what types of questions our customers would want to answer with it. With this in mind, we conducted extensive user research by interviewing our customers and exploring how they have deployed KPI charts using other analytics products.
From our research, we found that users expect a KPI chart to answer the following critical question:
1. What are the most critical metrics for measuring success in a particular area of their business?
2. How is the organization performing against its goals and targets?
3. What are the trends and patterns in company performance over time?
4. Are there any specific areas where performance has been declining or improving?
Using these key business questions as our guide, we identified the necessary functionality that the new KPI chart needed to support:
1. Summarize the most important metric for the customer’s use case.
2. Establish a reference system to help people understand a key metric's performance.
3. Track key metrics over time to identify trends and patterns.
4. Have the ability to dive into the data patterns.
Read more about Sigma’s grid layout system.
Our Solution
To answer the business questions customers want answers to, we started by identifying the data required to analyze data across three dimensions:
1. The key metric
2. Comparison
3. Time period
The Key Metric
Users can drag and drop their key metric column into the “value” field to define the key metric.
By default, the value is summed, but we offer several preset aggregation functions to give greater flexibility in data analysis. This allows people to quickly understand the performance of their key metric and compare it with other metrics.
Comparison
After getting the key metric set up, the KPI chart's second step is establishing a reference system to explain this number. Is it a positive value compared to my goal? This reference comparison will help the end user of the dashboard understand the meaning behind the number.
Time Period
The KPI chart also allows the user to add a time dimension to the chart. By adding a time column, we will add a line chart (which can also be displayed as an area chart), which shows value changes over time. This helps the people identify trends and patterns in performance—the time dimension reference helps contextualize what the changing values may mean for their business.
More than a simple chart
When talking to our customers, it also became clear that time was the most requested reference dimension for the KPI chart. Time granularity also varied from use case to use case, so we enhanced the KPI chart with many functions to configure time dimensions. Our customers consistently requested that the KPI chart support period-over-period time analysis.
While being the most requested time-based analysis, period-over-period comparisons are particularly challenging for people to configure. As part of the KPI chart’s design, we created configuration shortcuts so that people could create period-over-period analysis in a few clicks, rather than having to remember the formulas to do this manually.
Truncate your date column into the desired period scale.
Select Desired period-over-period comparison
Compare to other values over time
Next, through interviews with our customers, we also observed that people intuitively want to compare two metrics over time. For example, customers might want to compare operating costs against revenue over a specific period to see if the company is hitting its quarterly profit goals. We made this easy to achieve by adding a comparison value after they defined the time dimension of interest.
Powerful and Beautiful
As a product designer, I am keenly aware of how important it is for charts to look beautiful without needing hours of tedious fussing. We want all of our customers to confidently share their analysis and visualizations with the intended audience.
Using the ubiquitous “less is more” principle, we also opted to simplify the KPI chart’s formatting options—drastically reducing the effort required to create a beautiful visualization. Sounds simple enough, right? Not quite.
🤯 Our previous single-value visualization offered 48 different layout combinations. In testing them one-by-one, we realized that 45 of those 48 possible combinations were decidedly not beautiful. It can be difficult for people to quickly pick the layout that works best for their data—offering 48 possible formatting combinations simply made the task overwhelming. To address this issue, we drastically reduced the number of layout options for the KPI chart, limiting the configuration options to those that are most effective and visually pleasing.
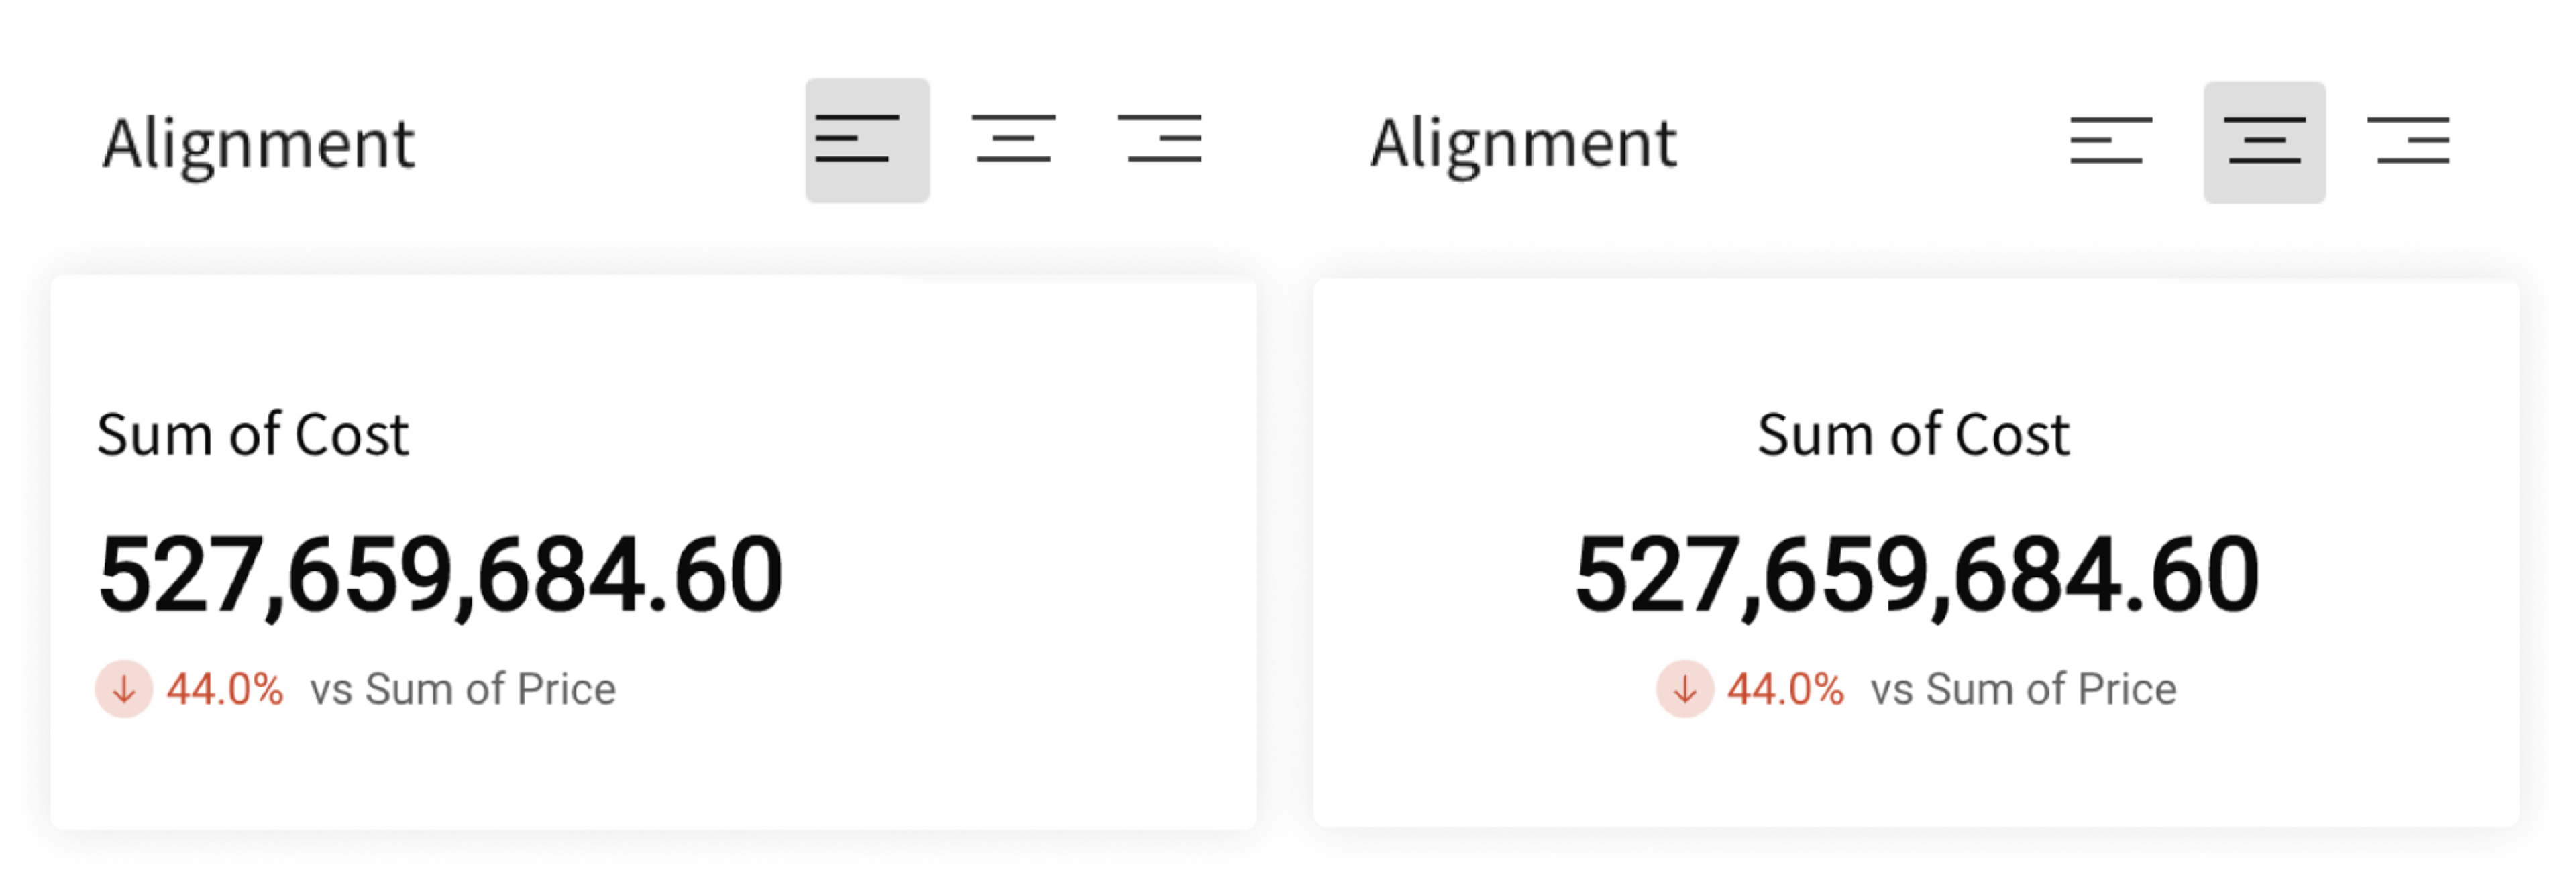
In order to make styling the KPI chart as quick as possible, we also packaged the most common layouts into pre-designed alignment templates that cover the most common use cases. People can now switch to their preferred layout in just one click. For those who want to dive a little deeper into the customization, each component of the KPI chart can be further configured to achieve a more tailored design. By streamlining the layout configuration process, we can empower users to create stylish and effective visualizations with minimal effort.
In addition to providing alignment templates, we improved the font and color schemes so the key metric stands out, making the overall chart composition more harmonious. We also carefully selected color combinations that were both visually appealing and accessible for individuals with different types of color blindness.
Finally, based on the feedback received during the alpha-to-beta stage, we identified some areas for improvement. One of the issues that users encountered was with the period-over-period options, specifically when conducting a month-over-month analysis where the current month was not over—resulting in an incomplete comparison. To address this, we plan to provide more granular options for users to specify the two periods they want to compare, which should improve the accuracy of the analysis.
Now that we have successfully released the first version of the new KPI chart, it’s time to take a moment to identify what I have learned throughout this project.
Trying to please everyone by assembling the laundry list of related feature requests could have resulted in an incomplete feature that didn’t solve the real problem. In order to truly design what our customers needed, we had to slow down in the early stages of the project to fully understand our customers’ business use cases. Once we understood that, we had to uncover the root causes of why the existing single value chart was not delivering the results our customers expected.
Approaching future projects in this way, we can proactively deliver solutions that will help our customers achieve their goals without the need for them to explicitly request features. This approach not only makes for a more intuitive and user-friendly product, but also enables us to anticipate user needs and provide solutions before they even realize they need them.
Get your Ultimate KPI Playbook.