Report Factory Hell

You deliver a requested report to a business colleague, but they aren’t happy. They claim you didn’t effectively fill their request, or they have follow-up questions.
Before you know it, you’ve spent hours generating low-level, ad-hoc reports in attempt to give them the answers they need. This is report factory hell, and it’s a terrible place to be. But don’t lose hope. You can escape. Allow us to show you how.
The Big Bang
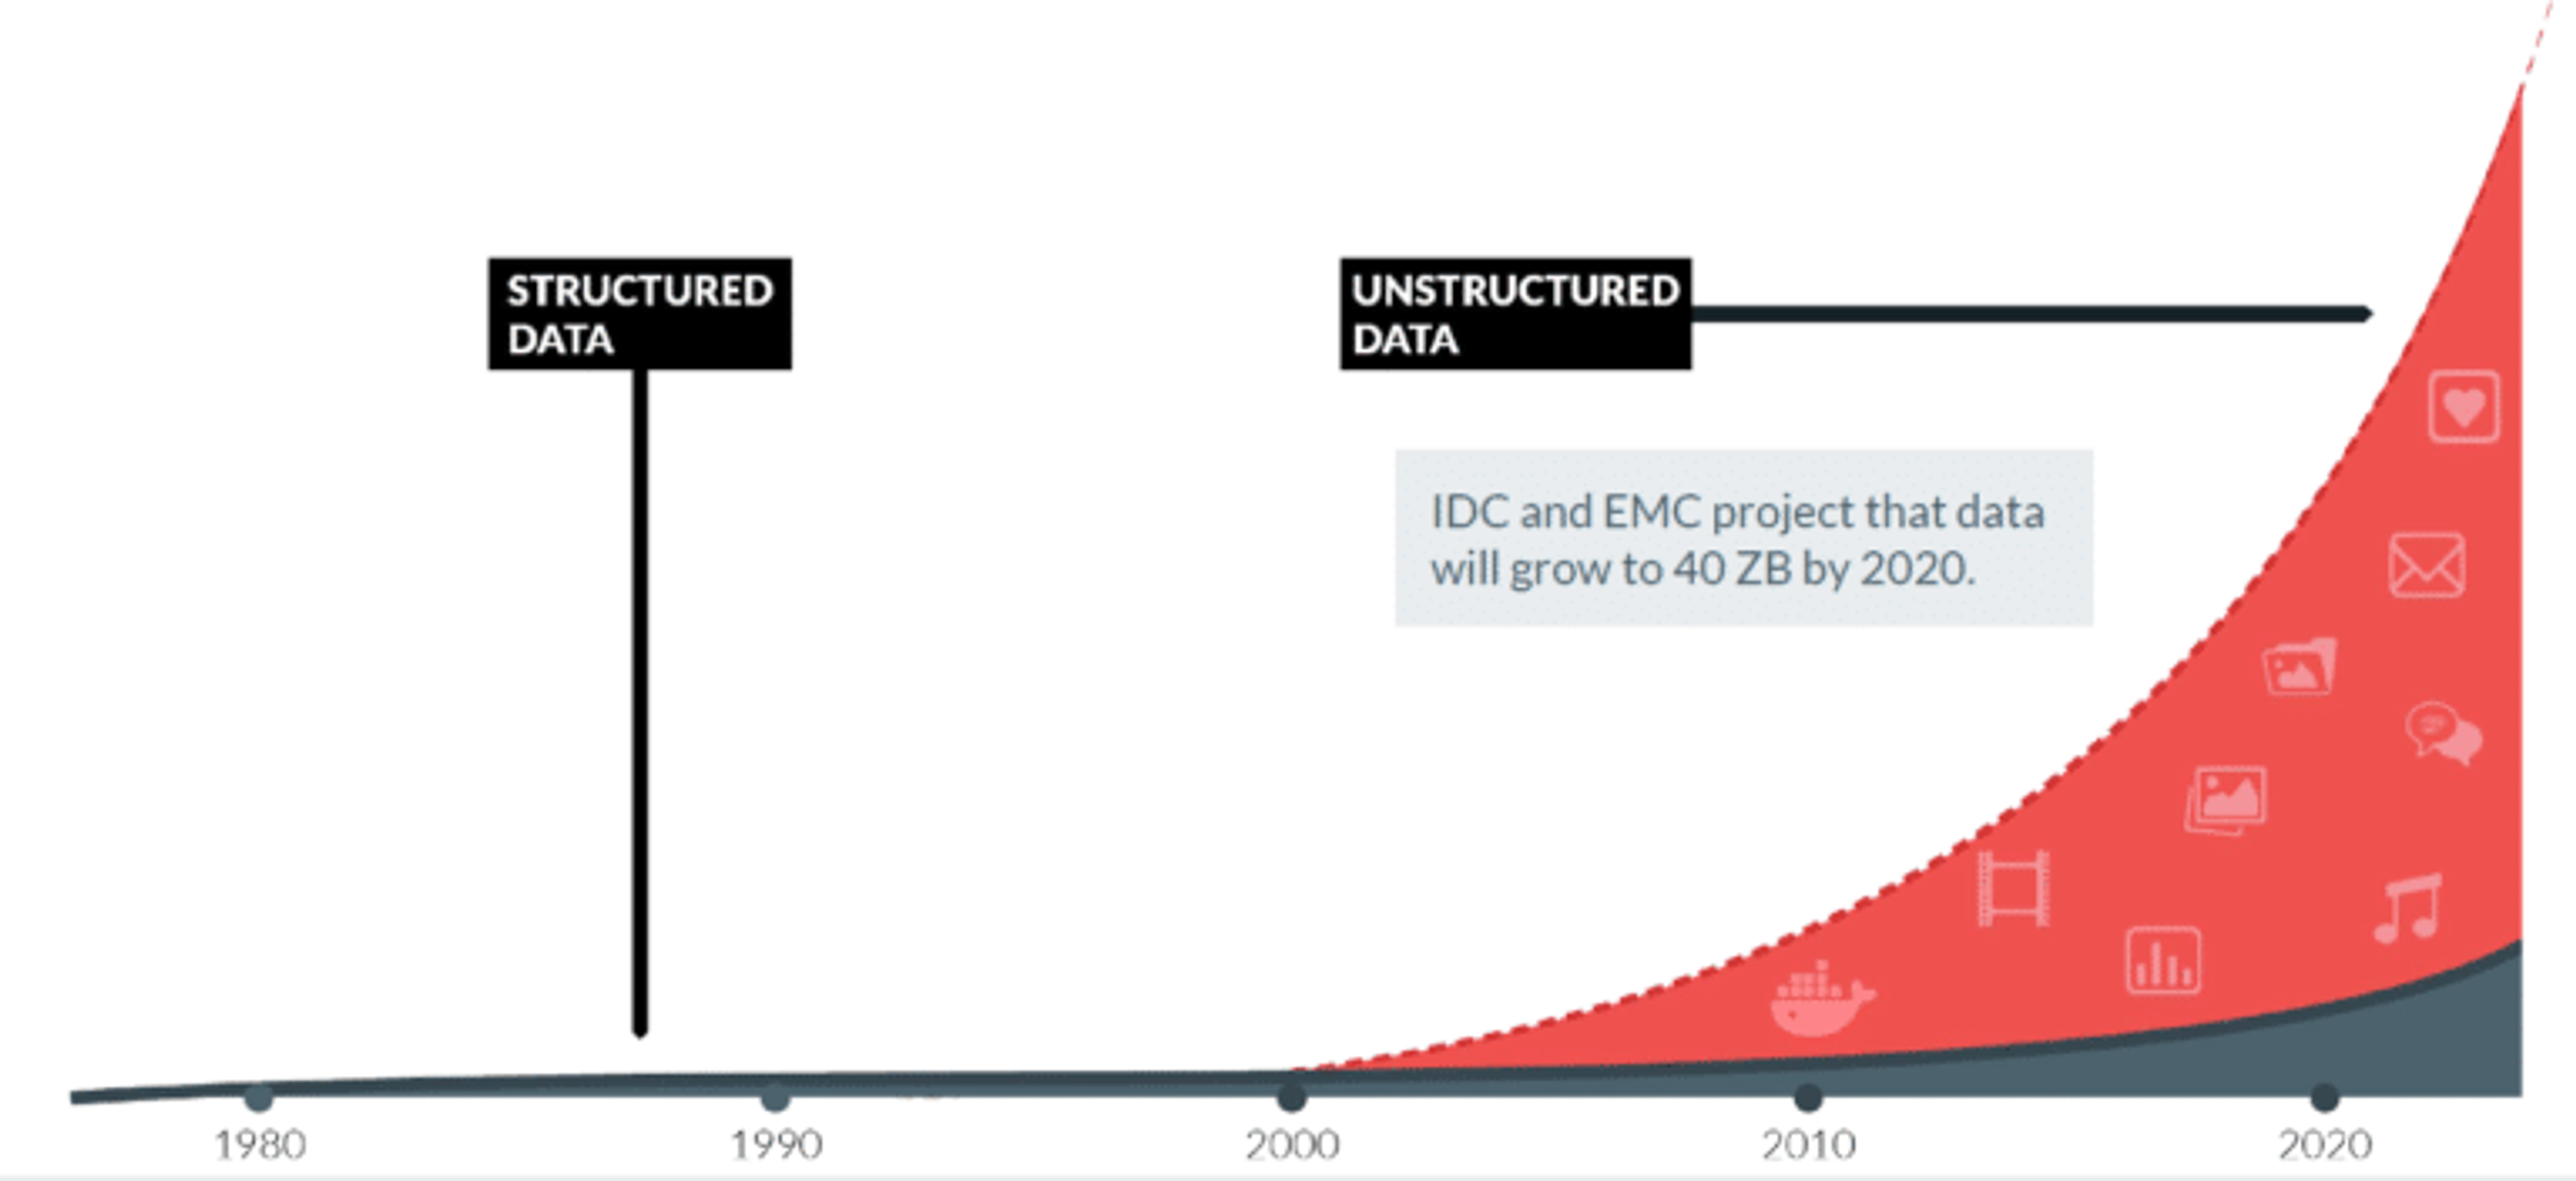
Over the last decade, the amount of data that is created, consumed, and stored has exploded. This exponential growth has been fueled by wearables, IoT, social media, and mobile phones. Just take a look at what’s created in just one internet minute!
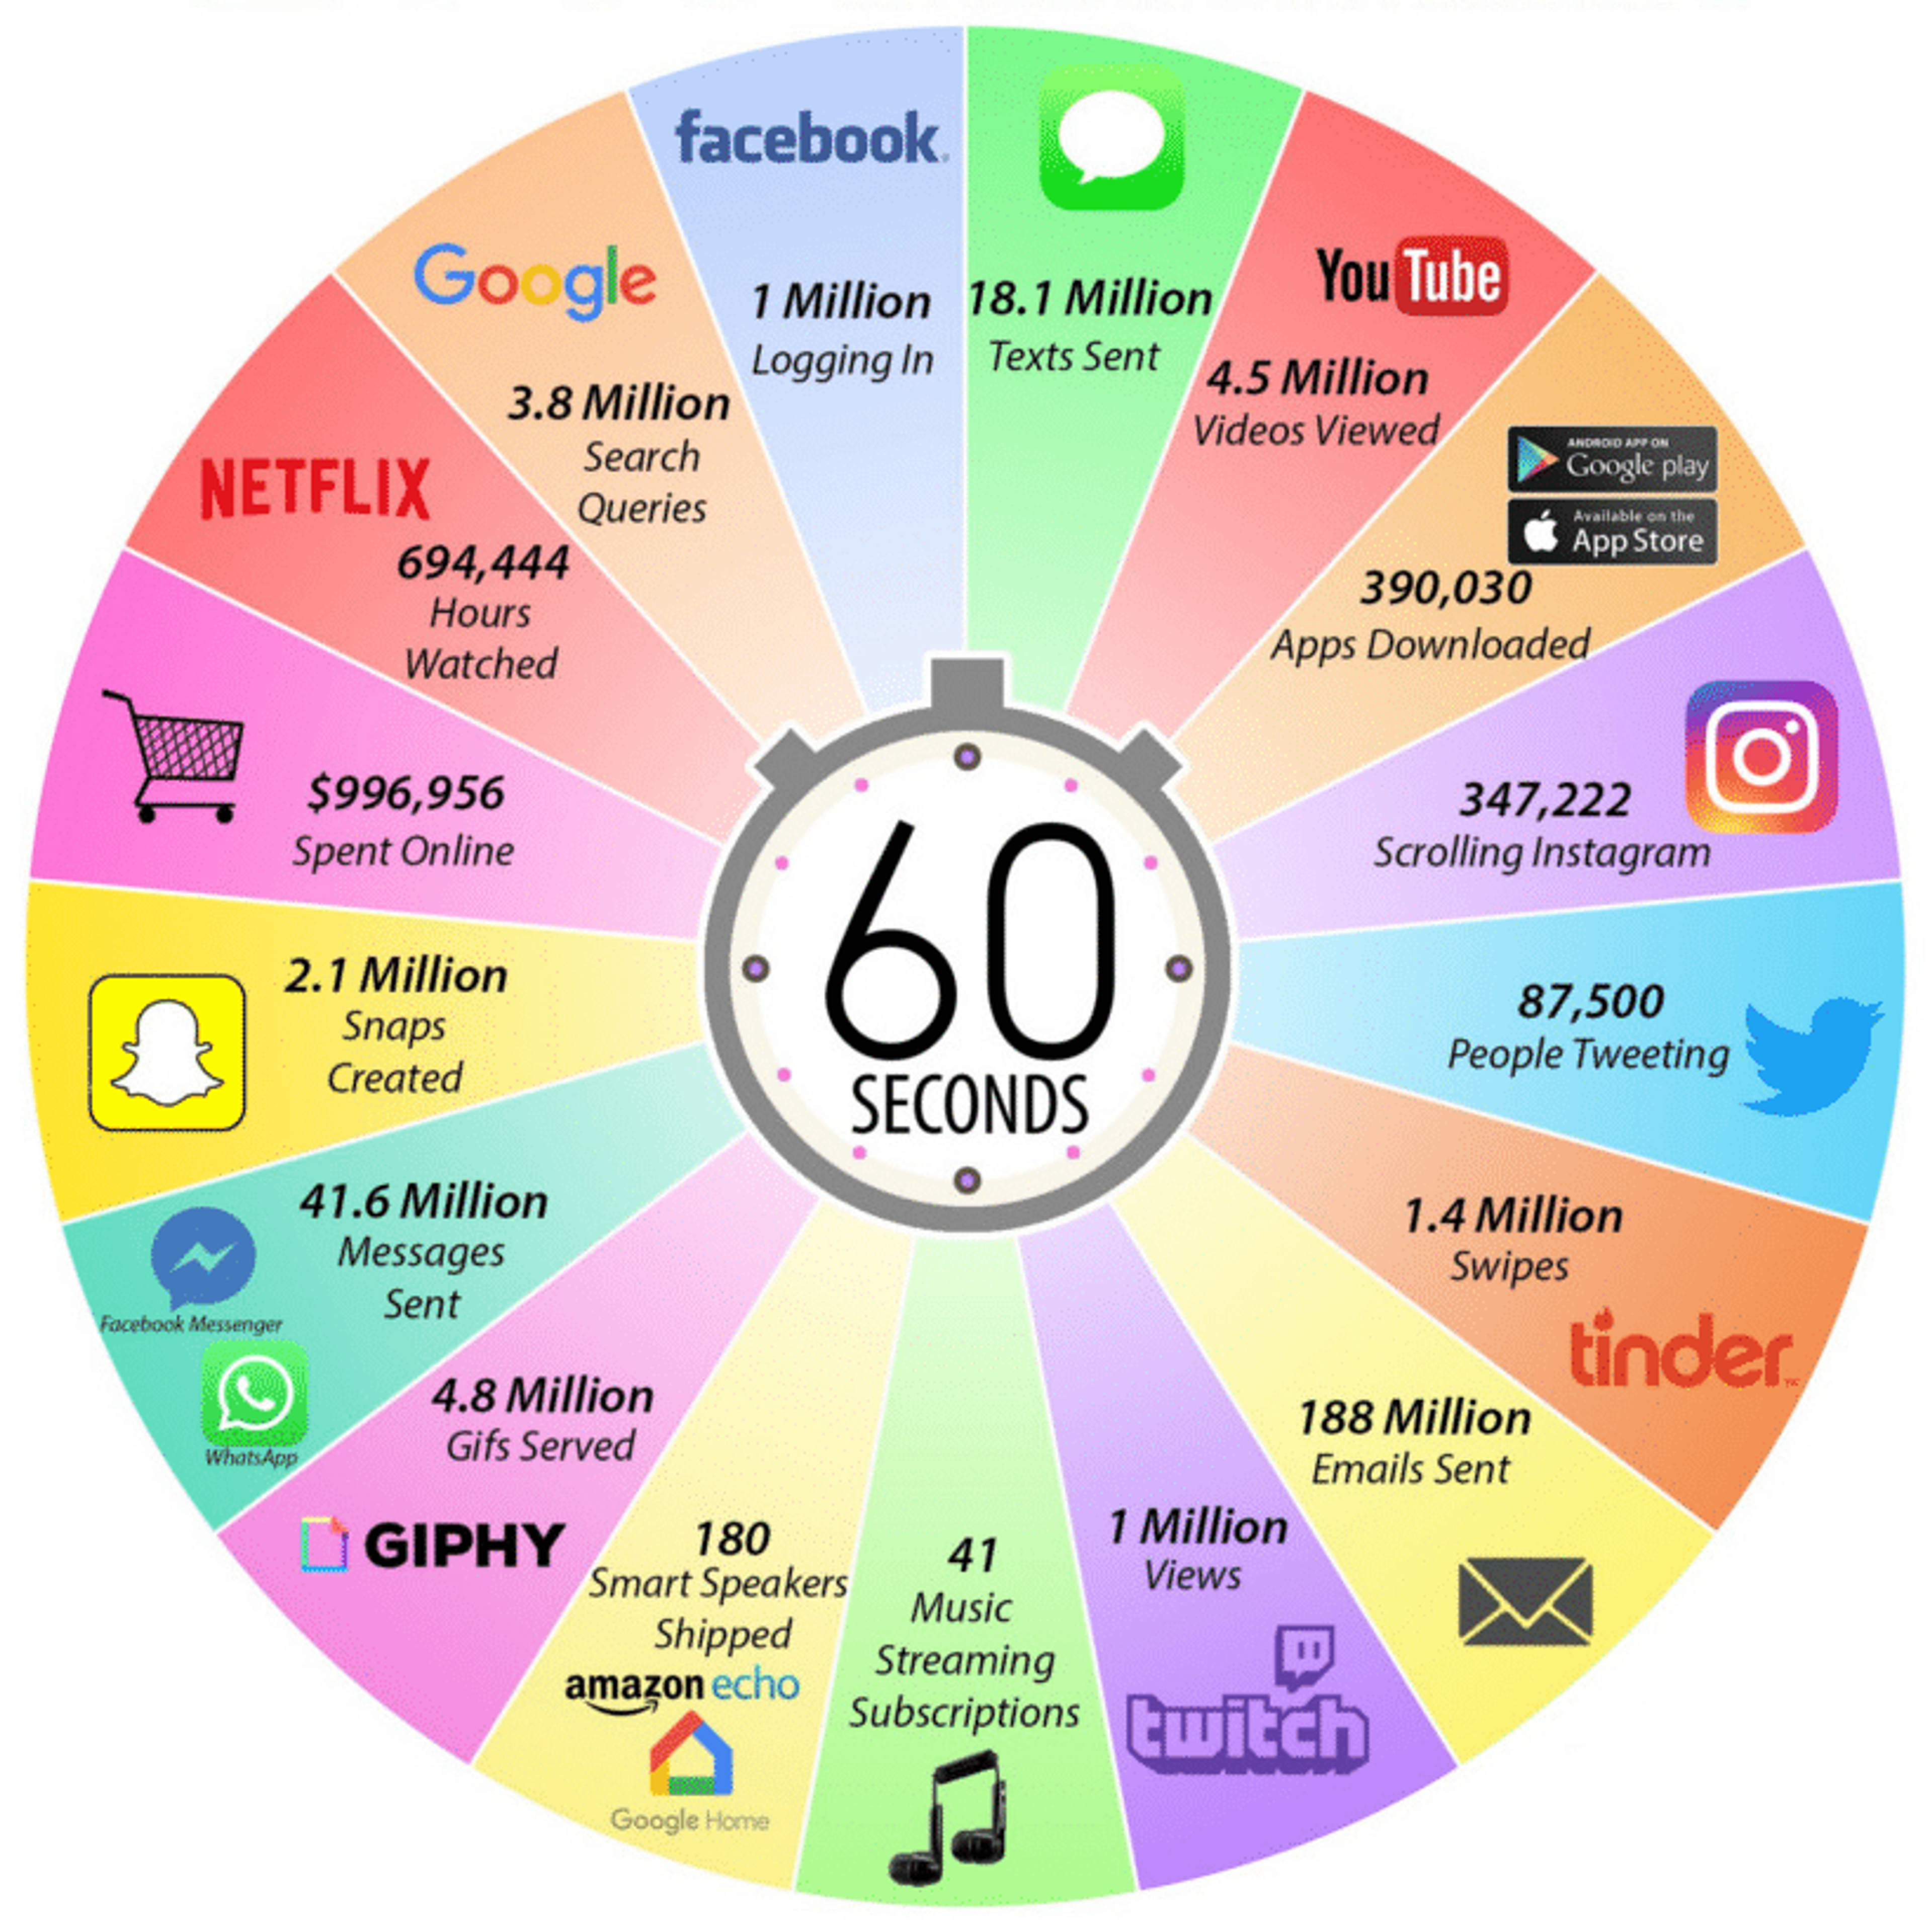
This is what happens in an internet minute (2019)
All of this data is a potential treasure trove for companies that are able to use it effectively. Combing through structured, unstructured, and semi-structured data, leading companies are hoping to find patterns, identify emerging trends, and extract insights that aren’t obvious from the surface — insights that will drive better decision-making and give them an edge over the competition. They’re employing data engineers, data scientists, and data analysts in record numbers to carry out these initiatives.
But despite the mountains of data at their fingertips, and armies of data experts at their disposal, most organizations are not enjoying data bliss. In fact, most BI teams have descended into the depths of report factory hell.

Far from basking in a utopia of data-fueled insights, data and BI teams find themselves bombarded with competing requests, working through a never-ending queue of low-level ad-hoc reports. This renders them unable to tackle the high-value data projects that move the needle and provide the job satisfaction they’re seeking.
The descent usually follows this predictable pattern:
- GLUTTONY. As the amount of data grows, the number of requests for reports, dashboards, and answers grows along with it. The needs of the many rely on the expertise of a few, resulting in a broken and bottlenecked process. And because these requests come from a variety of departments, there’s no real way to prioritize them — leaving everyone on the BI team scrambling to complete dozens of “urgent” requests.
- ANGER. Business leaders tend to underestimate the complexity of their requests and overestimate what data teams actually have access to. Data and BI teams are left operating with little context about the problems they’re being asked to solve, and may find it difficult to present their findings in terms business users understand. When data falls short of being the infallible guide business users expect, or a report takes weeks of back-and-forth and still isn’t quite right, they can lose confidence in the organization’s investment in data science.
- TREACHERY. Ad-hoc requests are a major drain on the BI team’s time and resources. Ad hoc is Latin for “as the occasion requires.” But business is ad hoc by nature. Competing requests pour in, inundating the BI team with tedious, time consuming, and often duplicate work. Some data analysts spend up to 50% of their time fulfilling ad-hoc requests.
- When data governance is weak and people engage in shadow IT, data becomes a weapon. Sensitive information may find its way into dozens of downloaded spreadsheets. Ungoverned and insecure data increases the risk of security breaches and can violate data privacy laws, which is a huge liability in our post-GDPR world.
- GREED. In today’s on-demand world, companies need to move lightning fast, and course-correct in real time to compete. The confidence that data-driven decision making can provide is appealing to business leaders across the organization. In every team and department, people need to be able to ask questions, get answers, and keep iterating to gain insights.
- But this puts incredible strain on the BI team. A sharp divide exists between those who speak the “language of data” and non-technical domain experts. Instead of investing in education, promoting data literacy, and laying the foundation for collaboration between these two camps, companies throw bodies and technology at the problem, setting everyone up for failure.
- HERESY. When business users start getting impatient and fail to see the value of the BI team’s insights, they may take matters into their own hands. A dubious patchwork of data extracts and spreadsheet sprawl results in analyses that contradict each other. Confusion reigns when there’s no single source of truth.
- LIMBO. These reports often lead to more questions, creating an endless loop of creation, presentation, and iteration. Even worse, these low level reports tend to add little value to the org as a whole, leaving BI teams with minimal time and resources to do broader, more strategic work with farther-reaching impact.
This is report factory hell. But how did we get here?
And more importantly, how do we get out?
The Great Divide
The term “business intelligence” was coined by Richard Miller Devens in his 1865 work Cyclopaedia of Commercial and Business Anecdotes. He used it to describe how banker Sir Henry Furnese had put himself ahead of the competition by collecting and analyzing the information at his disposal to make better business decisions. At this point, the business expert and the person collecting and analyzing the data were one and the same. And the tools required to do this were little more than a pen and paper.
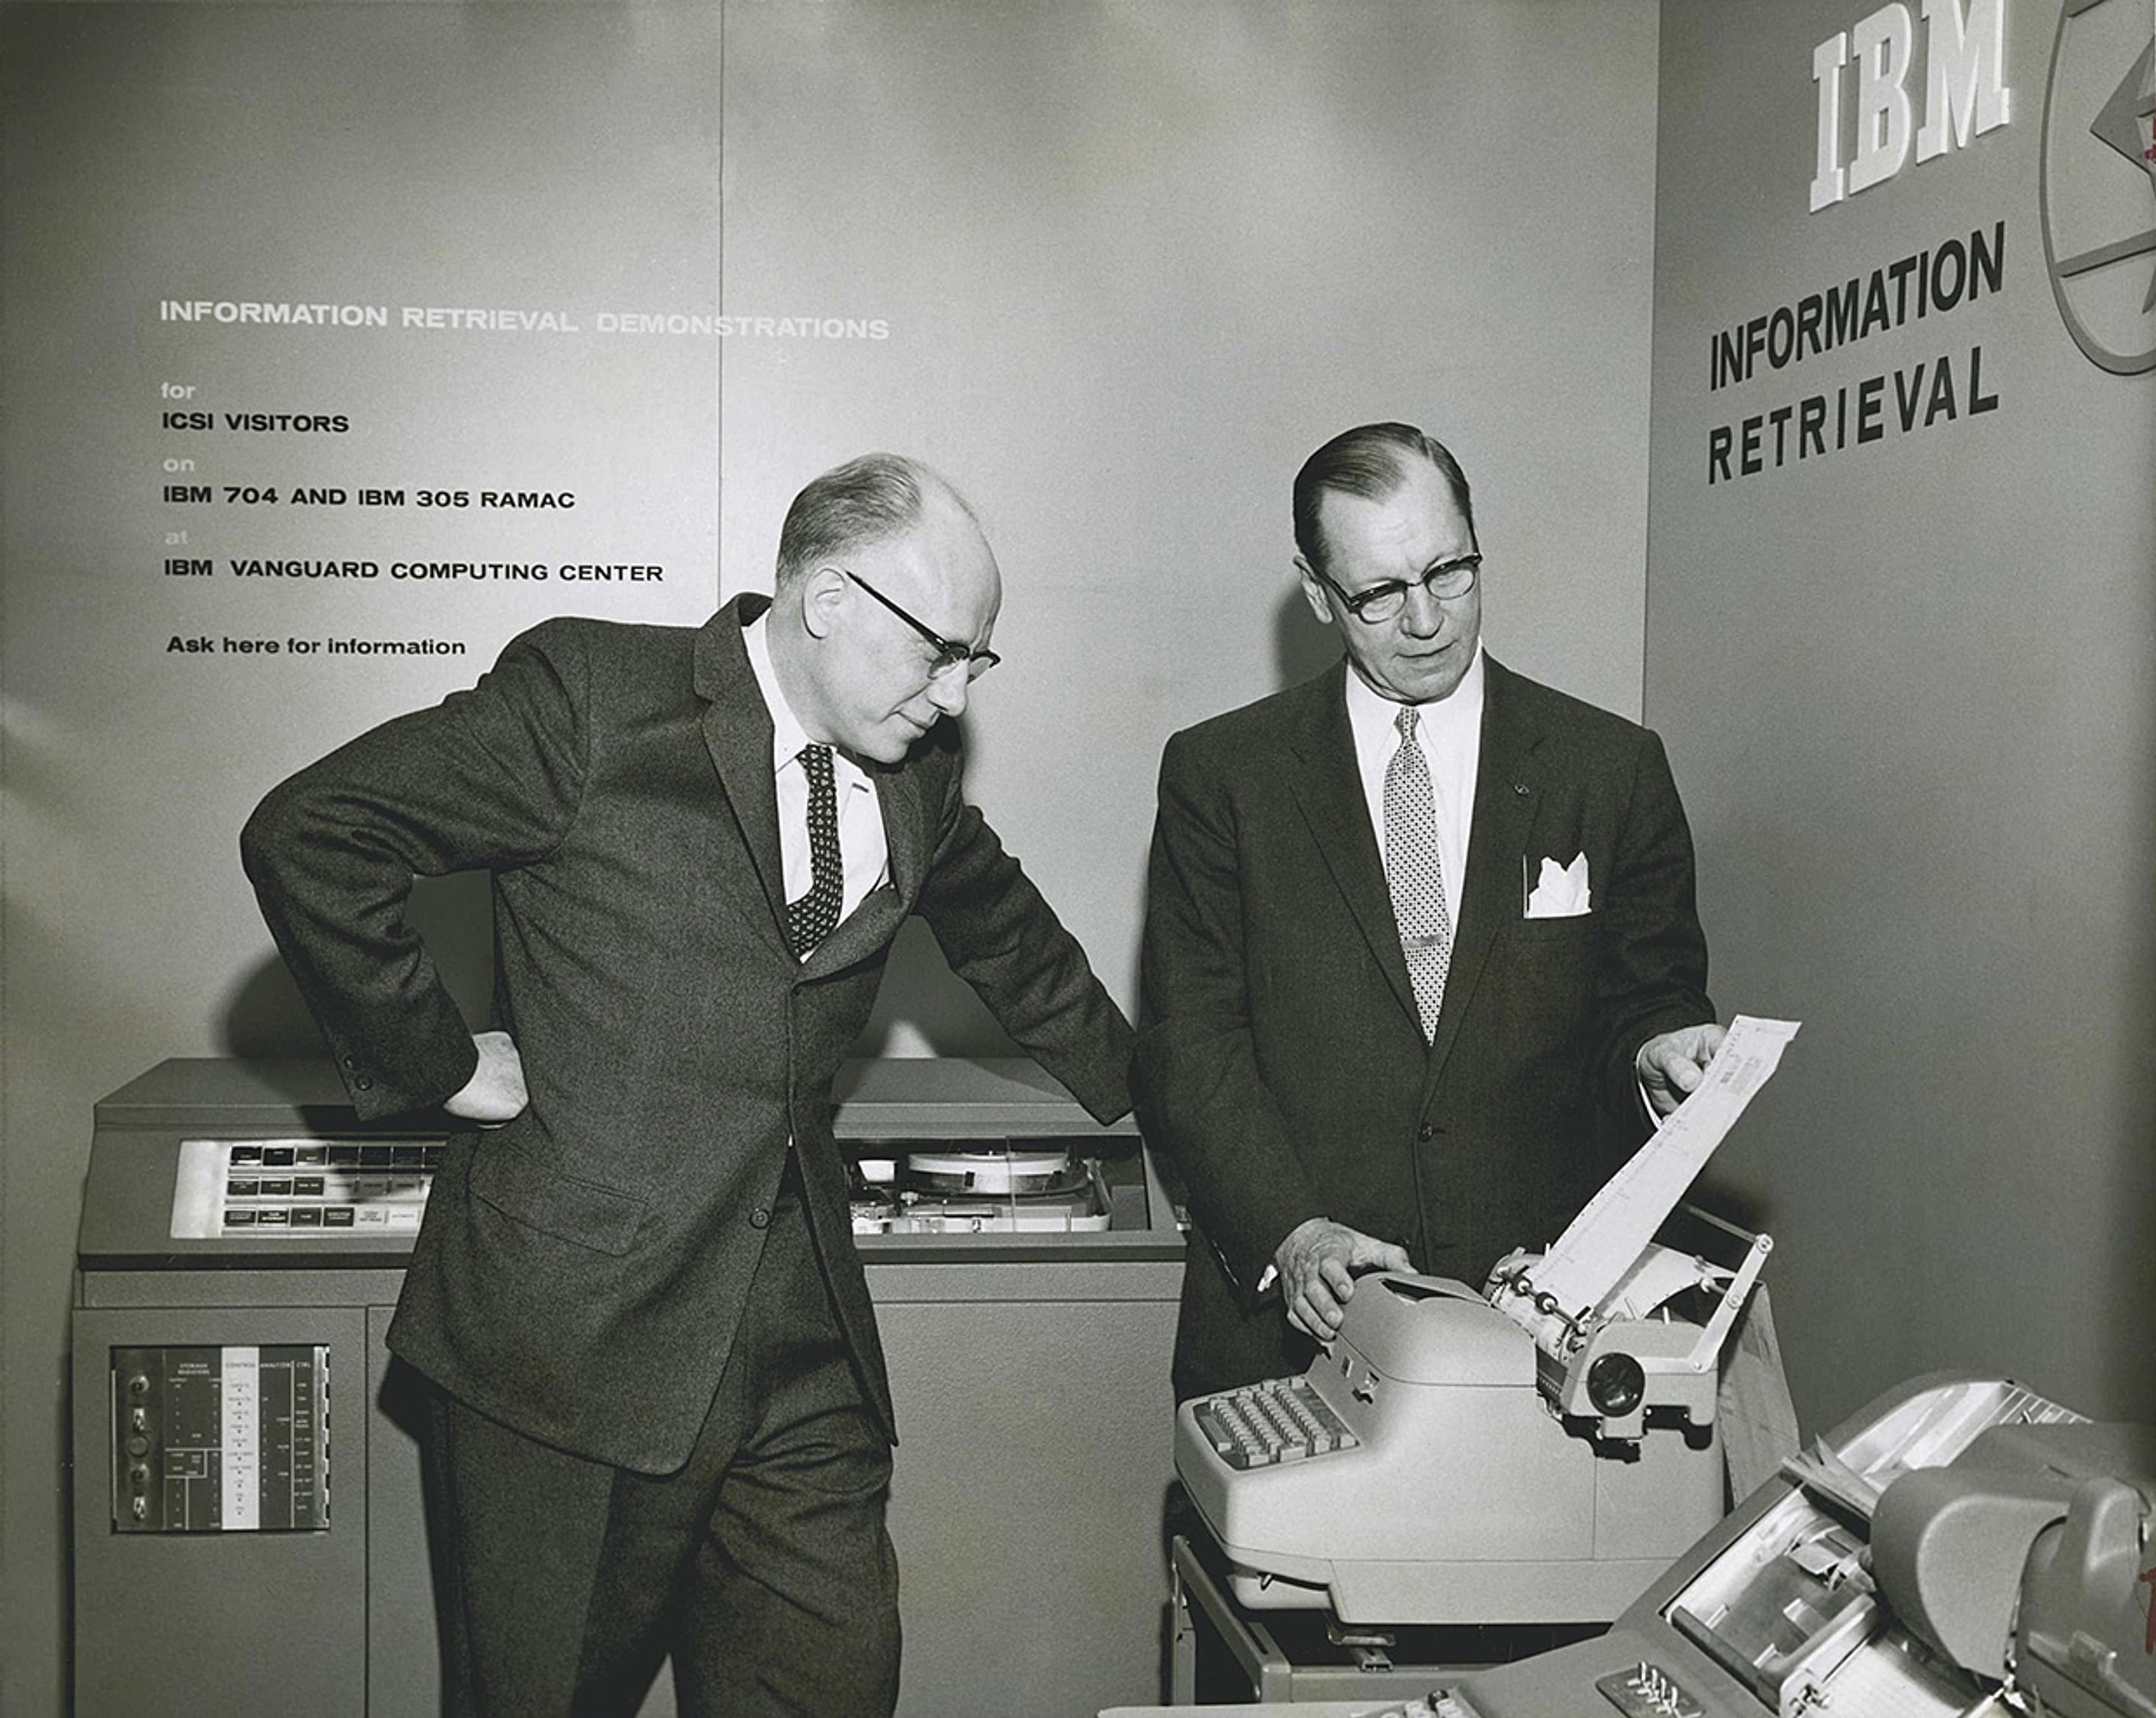
But starting in the 1950’s, aided by the growth of computers and the birth of the digital era, business intelligence became a specialized occupation. As computing continued to mature throughout the 60s, the skills necessary to collect and translate data grew too complex for the average office worker to manage.
In the 1970s, relational databases were invented by Edgar F. Codd. SQL became the language of databases and created a gap between those who could access and interpret data and those who couldn’t but needed it to make business decisions.
For over a decade now, self-service analytics have been heralded as the solution that would bridge this gap, freeing BI teams to focus on their work while giving business users the ability to get the reports they need to make better decisions. But in practice, self-service analytics have been a tremendous disappointment.
The empty promises of
By this definition, self-service analytics have been largely a myth. Far from “hands off, ” the tools that claim to offer self-service BI still require a significant amount of work from the IT department — not to mention loads of complicated SQL to set up, use, and maintain. Days, or even weeks, of specialized training and/or daily assists from data and BI teams are necessary to answer even basic questions. Unsurprisingly, the adoption of these solutions hovers at a paltry 35%.
Business people know their jobs well, but most have modest technical abilities. Nobody can do everything. So as a way to satiate them, they’ve been given simplified, limited dashboards. But these don’t actually allow them to explore, ask questions, and uncover game-changing insights. Insights require domain expertise as well as data expertise.
Is it possible to deliver BI teams from report factory hell and give business users the insights they desire?
Deliverance Comes from the Cloud
It’s possible to strike a balance between governance and freedom. Cloud data platforms and Sigma are making the dream of true self-service BI possible. The cloud data analytics stack incorporates core principles that were previously restricted to software development: version control, live data access, and connected environments. Sigma leverages the strengths of cloud data platforms to bring business leaders back into the data conversation and give BI teams the ability to help drive business outcomes.
- ENABLE EVERYONE TO EXPLORE. Sigma’s spreadsheet-like interface is flexible, yet familiar, connecting business users directly to the cloud data platform— no SQL required. With some basic spreadsheet formulas, teams can explore and analyze billions of rows of data in real time without writing a single line of code.
- FOCUS ON THE WORK THAT MATTERS. By empowering line-of-business experts to explore the data themselves, BI teams are free to pursue higher-priority work like uncovering new data sources, building new data models, and solving impactful problems so they can uncover more value for the organization. Sigma even has a SQL runner so you can make use of pre-existing code.
- MAINTAIN SECURITY AND COMPLIANCE. This freedom and flexibility doesn’t come at the cost of security or control. Sigma sits on top of your existing cloud database, using a secure connection to query your data platform directly. Results of queries are returned in the browser — no data is ever stored at any time. Administrators can set permissions by team and namespace, and can restrict data access directly from the database as well. Sigma is a single point-of-access for your data, so you can establish robust data governance, eliminate dangerous Excel extracts, and keep data off local PCs.
- REUSE ANALYSES AND COLLABORATE WITH OTHERS. Sigma empowers business and BI users to collaborate with one another to build more robust and contextual data models and foundational datasets. When everyone can share and build on each other’s work, the time to insight and data ROI is accelerated exponentially. Data in Sigma remains accurate and up-to-the-minute because it’s directly accessed from your cloud data platform so you never have to worry about duplicating efforts or creating redundant reports again. Sigma even offers the ability to write views back to your cloud data platform so you can reuse analyses across applications.
- BUILD, SHARE, AND EMBED INTERACTIVE DASHBOARDS. Don’t limit your team to stale reports or dead-end dashboards. Using Sigma on top of your cloud data platform, the data is always fresh and can be customized to fit any team’s needs. Dashboards and visualizations in Sigma can be shared directly or embedded in a private company portal, third-party application, or a public web page that’s available to anyone. Business users are free to go beyond the dashboard and explore the underlying data at will.
Let’s Sigma together! Schedule a demo today.