Data and Analytics Strategy: A Practical Framework

A data and analytics strategy is the enterprise plan that turns cloud warehouse data into consistent decisions across the business. It answers what the company wants to accomplish with data, who owns the numbers, and how those numbers get from the warehouse into the hands of the people making calls.
This guide covers what a data and analytics strategy is, why enterprises need one, how to build it, and how to measure whether it's working.
Key takeaways
- A data and analytics strategy names the decisions the business needs to make, the data required to make them, and who owns keeping that data trustworthy.
- When creating a data and analytics strategy, anchor every element to a revenue, cost, or risk outcome. Work backward from the decision the business needs to make to the data that serves it.
- A complete strategy coordinates four components: governance and data quality, self-service access and literacy, tooling and infrastructure, and organizational ownership.
What is a data and analytics strategy?
A data and analytics strategy aligns how data is governed, accessed, and acted on with specific business outcomes. It defines the direction that the operating model, tools, and team structures execute. The strategy also names the decisions the business needs to make, the data required to make them, and who is accountable for keeping that data trustworthy.
Every element of the data strategy should trace to a revenue, cost, or risk outcome. Many companies work backward, hunting for a purpose for the data they already have. Anchor on the decision the business needs to make, then work back to the data that serves it.
A data and analytics strategy versus data and analytics tools
A data and analytics strategy and the tools that support it often get treated as the same thing, and the confusion is expensive. A strategy sets the direction: it defines the business outcomes, decides which capabilities are needed, and determines which tools qualify. A tool is a specific product the organization adopts to execute against that direction. The strategy is broader, longer-lived, and should come first.
How they differ:
- Scope. A strategy covers governance, ownership, literacy, and business outcomes. A tool covers configuration, integration, and training on a specific product.
- Endpoint. Adopting a tool ends at go-live. A strategy is a live capability that gets revised as the business changes.
- Ownership. A strategy is owned by a data leader accountable for business results. A tool implementation is owned by whoever runs the project.
- Direction of influence. The strategy should decide which tools to buy. When it runs the other way, the tool's assumptions quietly become the company's assumptions.
Data analytics projects typically fail when they aren't aligned with business strategy. Recurring causes of failure include not understanding the real needs of the business and failing to get business and IT speaking a common language.
3 reasons enterprises need a data and analytics strategy
Without a documented strategy, tool and headcount investment can outpace measurable business outcomes. The inconsistency compounds quietly inside each team and becomes visible only when an executive asks one question and gets three answers.
1. To stop tool sprawl before it drains budget
Without a coordinating plan, enterprises accumulate overlapping analytics tools that each add cost without adding clarity. Each additional tool adds license spend, integration work, and another version of the truth. Across the full SaaS portfolio, underused or redundant applications add avoidable cost that a strategy would have prevented by naming the platforms that qualify and the ones that don't.
2. To keep metrics consistent across teams
Without shared definitions, teams produce contradictory numbers and executive trust in the data erodes. One region defines an active customer as someone who purchased in the last 90 days while another uses 180, and cross-regional reporting quietly stops meaning anything. Data inconsistency across siloed sources is one of the hardest data quality problems to fix, and the resulting firefighting takes time away from analysis that would move the business.
3. To make self-service access work in practice
Without a plan for literacy, trust, and support, self-service investments produce licenses nobody logs into. Only about 25% of employees actively use business intelligence (BI) and analytics tools, and skill shortfalls, culture, resistance to change, and data quality limit adoption further. A strategy budgets for the training and change work that turns access into usage.
The core components of a data and analytics strategy
A complete strategy covers four components: governance and data quality, self-service access and literacy, tooling and infrastructure, and organizational ownership. Coordinating all four is harder than executing any one in isolation.
1. Governance and data quality
Governance assigns decision rights and accountability for data, so a disputed number has an owner who can settle it. It covers ownership, quality standards, policies, and security, and it defines how much users can trust the data they use for decisions. Purpose-built platforms with security and governance built into the query path can make these standards enforceable at runtime rather than aspirational.
2. Self-service access and analytics literacy
Productive self-service requires both business-user access to data and the literacy to interpret it. Roughly 70% of business intelligence (BI) users are casual users with a limited BI skillset. For about 60% of business users, a tailored parameterized dashboard is the practical ceiling of self-service. A strategy plans for training, coaching, and support alongside access, because access alone doesn't ensure adoption.
3. Tooling and infrastructure
The cloud data warehouse (CDW), whether Databricks, Snowflake, BigQuery, or Amazon Redshift, is the foundation this component builds on. Analytics and AI tools sit on top of it and depend on the warehouse being reliable and governed. Tooling decisions should follow from the use cases and the governance model, not precede them.
4. Organizational ownership and accountability
Ownership assigns a single point of accountability within every domain, plus a data leader whose mandate is business results. Domain owners answer for data quality, while the data leader remains accountable for the strategy's business objectives.
How to build a data and analytics strategy
Building a data and analytics strategy often follows a sequence: objectives, then maturity assessment, then architecture, then governance, then rollout. Skipping a step tends to stall progress, usually on culture and change management rather than technology.
Define business objectives
Align the strategy to specific revenue, cost, or risk outcomes before anything else. Start with the mission and goals of the organization, then determine where data and analytics can move them. Projects that start with tools instead of goals produce roadmaps that are just lists of dashboards. Write down the specific decisions the strategy will improve and the financial outcome each one touches. That list becomes the filter for every later choice. If a proposed dashboard can't be traced back to a decision on the list, it waits.
Assess current data maturity
Audit tooling, skills, and governance weaknesses before designing anything else. A maturity audit should score analytics maturity dimensions, including organization, resources, data infrastructure, analytics, and governance, benchmarked against industry peers. Use the assessment to place the organization on a defined analytics maturity scale, so the roadmap closes real weaknesses instead of assumed ones.
Select an architecture and platform
Fix the data model before scaling access to it. Design a common data platform around a focused set of high-priority use cases, not every dataset you hold. Scaling access to a broken data model just distributes the inconsistency to more people. A warehouse-native architecture keeps that model as the single source rather than copying it into a separate analytics tier.
Establish governance and ownership
Governance should land before access scales. Assign domain owners, publish quality standards, and define stewardship roles now, because teams that bolt governance on later find their new tools querying data no one can vouch for. The quality standards should live where the people using the data can read them.
Roll out and iterate
Sequence adoption in phases across a few high-priority domains at a time, prioritized by use case. That reduces the risk of expanding before a use case is proven. Treat each domain's data as a maintained product to support repeatable delivery of new business use cases, and set a defined value-delivery timeline for each domain.
Best practices for data and analytics strategy implementation
Strategies that hold up in the field share four habits, and they work best treated as a checklist.
- Start with a small, high-impact use case. A constrained pilot with a measurable outcome beats a broad program that takes too long to demonstrate value. Prove value in one domain, then expand.
- Involve business users alongside IT from the start. Change management deserves as much energy as architecture. Data translators who bridge analytics output and business operations turn insights into actions teams actually take.
- Standardize on shared definitions and metrics. Build a global business glossary where domain teams contribute regional context, but enterprise terms stay consistent, so "active customer" means one thing everywhere.
- Revisit the strategy on a fixed cadence. Set a recurring review cadence, plus a review at any major inflection point. Use quarterly reviews to reassess technology operating models.
These best practices separate a strategy that survives its first year from one that quietly gets shelved after go-live. All four come down to discipline about how the existing strategy gets used, contested, and updated in the open.
How to measure the impact of a data and analytics strategy
Measurement turns a strategy from a document into a management tool. Without instrumentation, leadership can't tell whether the strategy is working, whether adoption is real, or whether the outcomes it promised are landing. The four areas below give leading and lagging indicators across adoption, business outcomes, speed, and trust.
- Measure adoption by tracking monthly active users, the share of data questions answered without analyst involvement, and the reduction in ad hoc report requests hitting the data team.
- Measure business outcomes by tying each use case to a revenue, cost, or risk metric with a baseline and a target, and report against it on the same cadence as the strategy review.
- Measure time to insight and time to action by choosing three to five recurring business questions and tracking the elapsed time from question asked, to trusted answer available, to decision taken.
- Measure data trust and governance by surveying business users on a data trust score and tracking whether business stakeholders or the data team identify data issues first.
Baseline all four before rollout, so the first quarterly review has something to compare against instead of a starting guess.
How Sigma supports your data and analytics strategy
Sigma is the runtime layer to build and scale governed analytics, AI Apps, and agents. It sits between your cloud data warehouse and the AI tools generating against that data. It turns what they produce into governed software with one control plane for permissions, audit, lineage, and change management.
For a data and analytics strategy, Sigma is the execution surface where the components of the strategy meet the user.
Governance and data quality on Sigma
Sigma queries Databricks, Snowflake, BigQuery, or Amazon Redshift directly. Row-level and column-level security are inherited from the warehouse at query time, and source warehouse data doesn't leave the warehouse perimeter. Workbooks, AI Apps, and agents can use the same governed source, giving teams one place to resolve disputed numbers.
Self-service access and literacy on Sigma
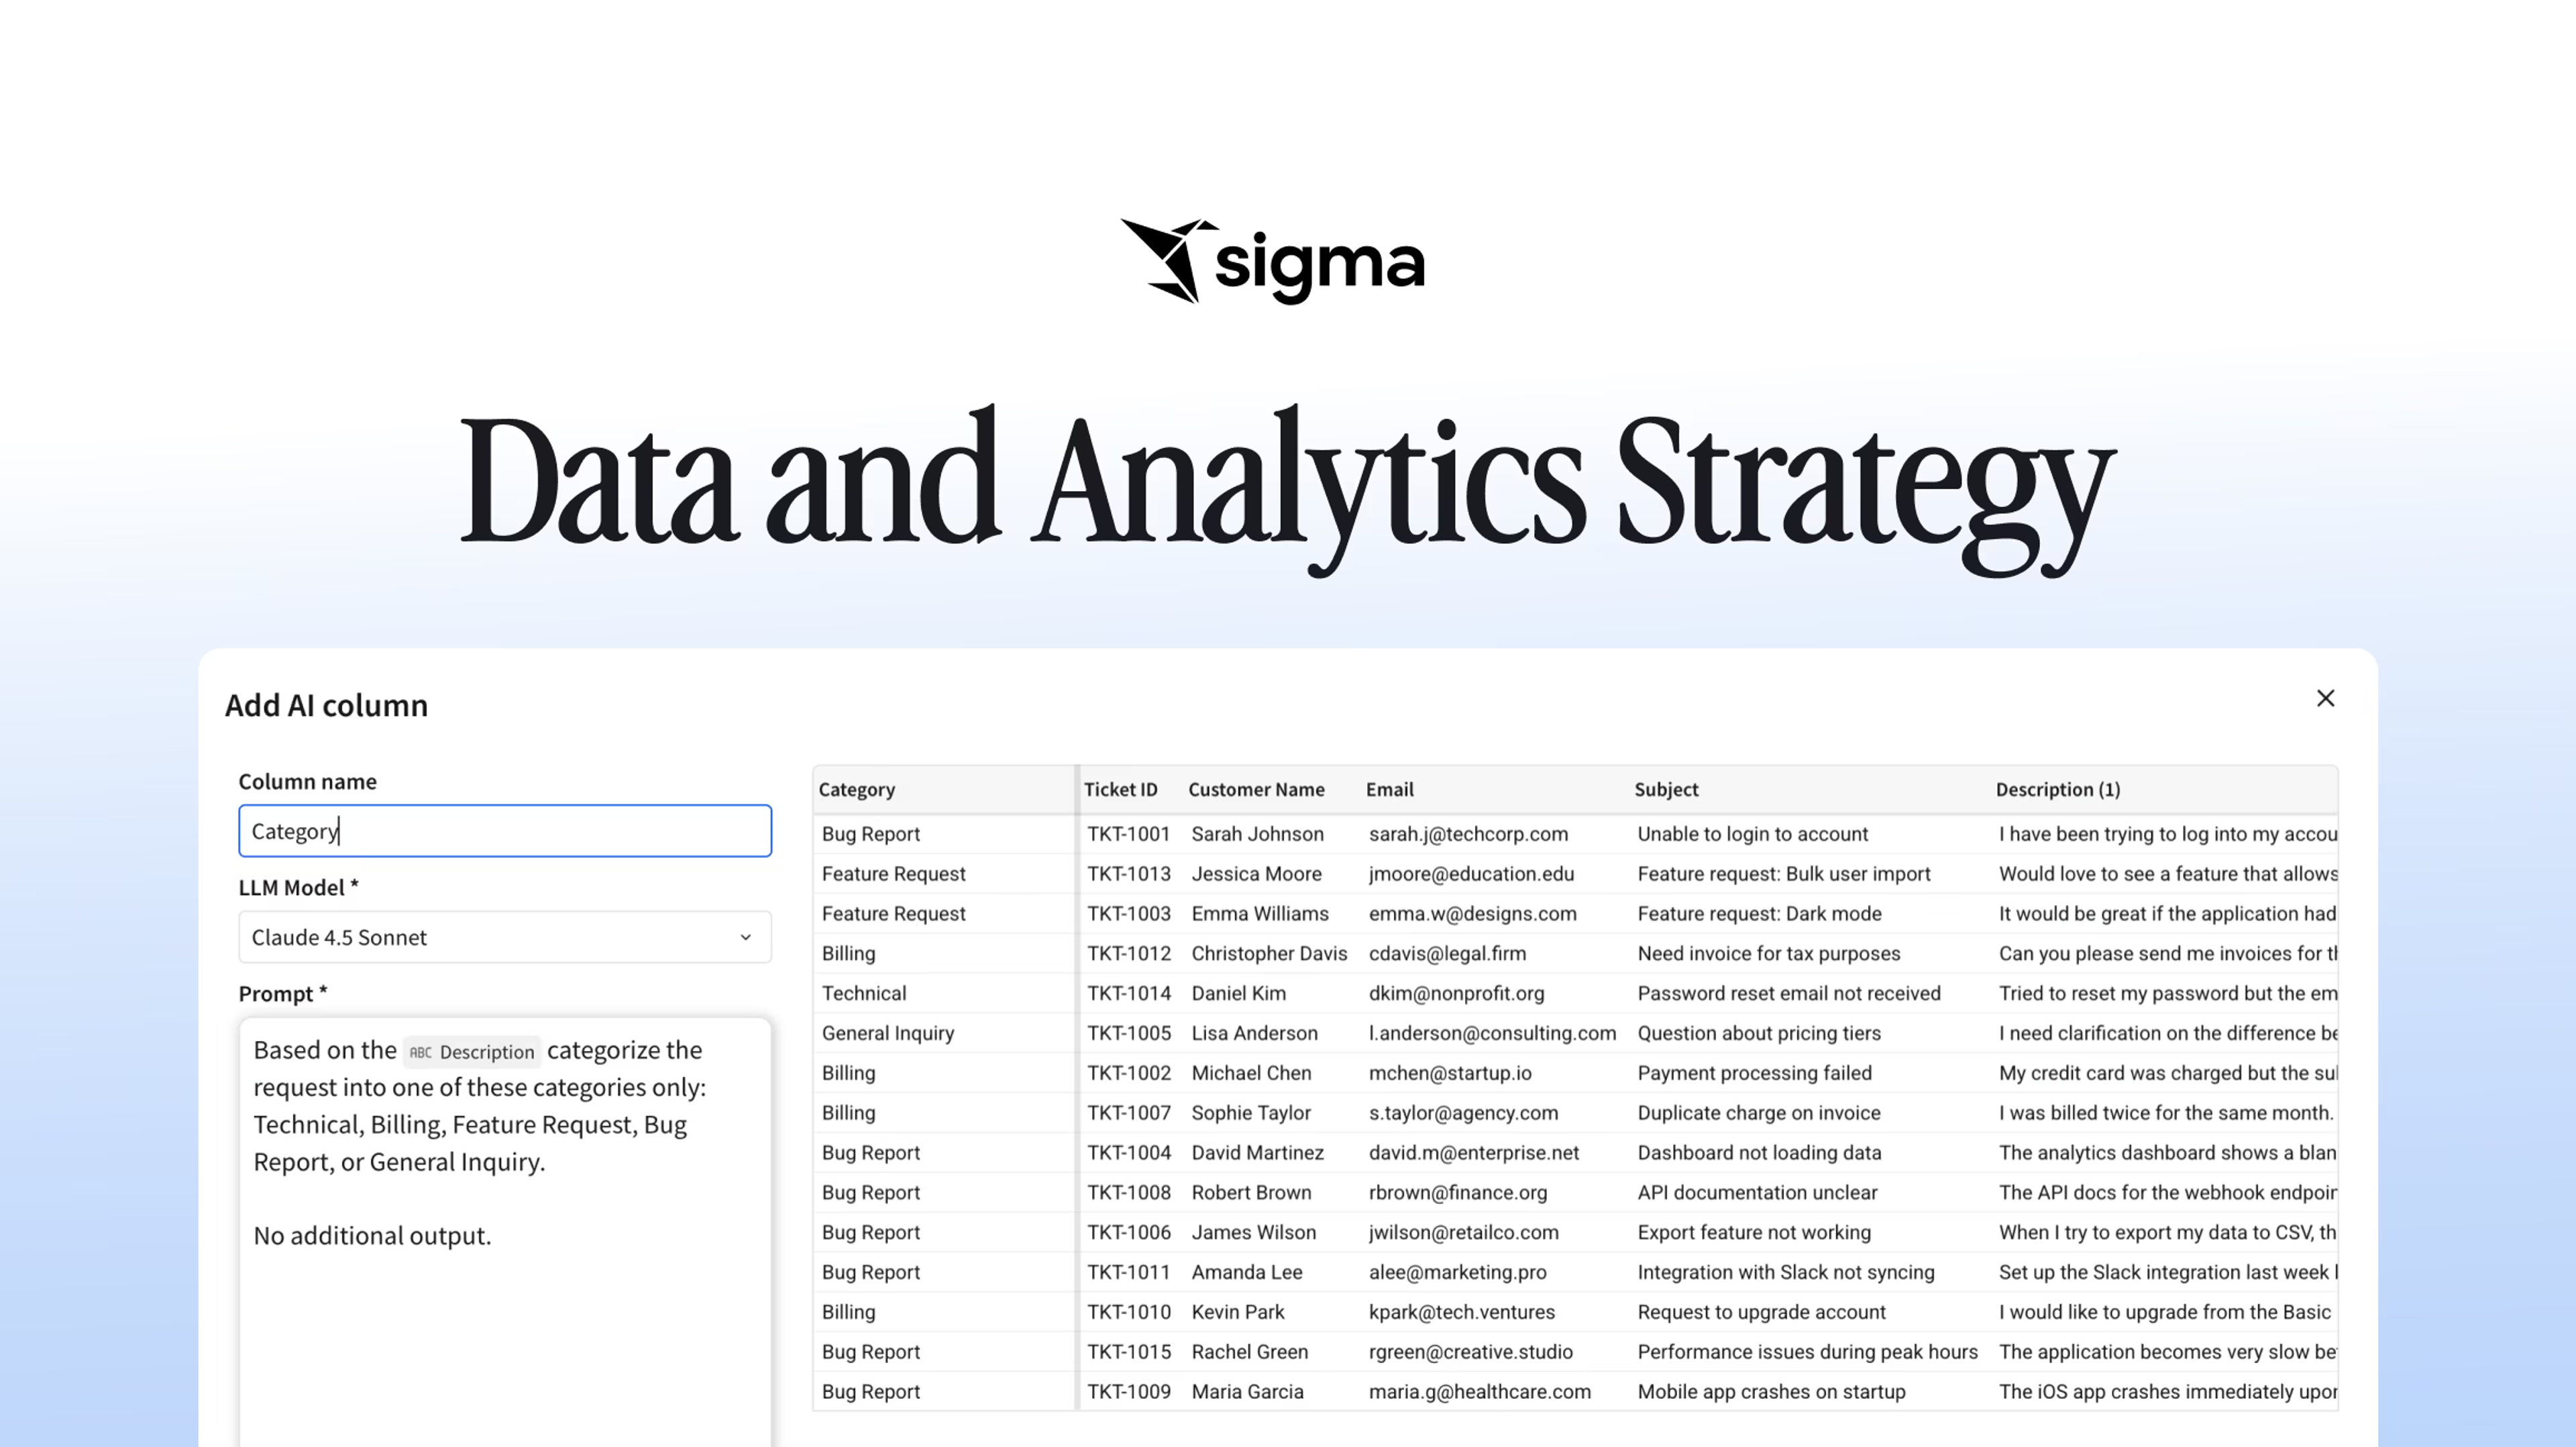
Workbooks and Sigma Assistant are where business users explore, build, automate, and act on live warehouse data. The familiar spreadsheet interface lets business users analyze warehouse-scale datasets without writing SQL. Analyze with Sigma Assistant supports natural-language questions, while Build with Sigma Assistant lets users describe the AI App or dashboard they want, so the practical ceiling of self-service moves well past the parameterized dashboard.
Tooling and infrastructure on Sigma
Sigma is warehouse-native across Databricks, Snowflake, BigQuery, Amazon Redshift, and other modern warehouses, so the tooling decision doesn't lock the strategy to a single cloud. Input Tables put governed writeback in the same workbook as the analysis, so teams enter forecasts, add commentary, and approve changes without dropping into a spreadsheet on someone's laptop.
Ownership and measurement on Sigma
Version history, audit trails, and inherited permissions give domain owners a defensible answer to "who changed this and when." Sigma's verified usage information can help teams assess adoption and identify heavily used workbooks, which feeds the measurement work directly.
With Sigma, one governed workbook can hold the definition of regional underperformance, and sales, finance, and marketing can all pull the same number from the same place. The meeting ends in a decision instead of an argument.
Build a data and analytics strategy with Sigma
Apply one test before you commit: when the 1,000th user arrives, does "active customer" still resolve to one warehouse column, or has finance gone back to CSV exports? Warehouse-native architecture keeps the analysis on live data.
Get a demo to see how the platform fits your data and analytics strategy, or try Sigma free to test it on your own warehouse.