
Built for data analysts
Crush your backlog and focus on impact. Explore live data, uncover insights, drive action — all in one platform.
How Sigma helps
Explore. Analyze. Act. Repeat.
Ad-hoc analysis without limits
Analyze trillions of rows using Excel-like syntax or SQL in a spreadsheet UI. No extracts, no bottlenecks.
Live dashboards, zero backlog
Build interactive dashboards, reports, and visualizations with real-time data. Stakeholders get answers, you get time back.

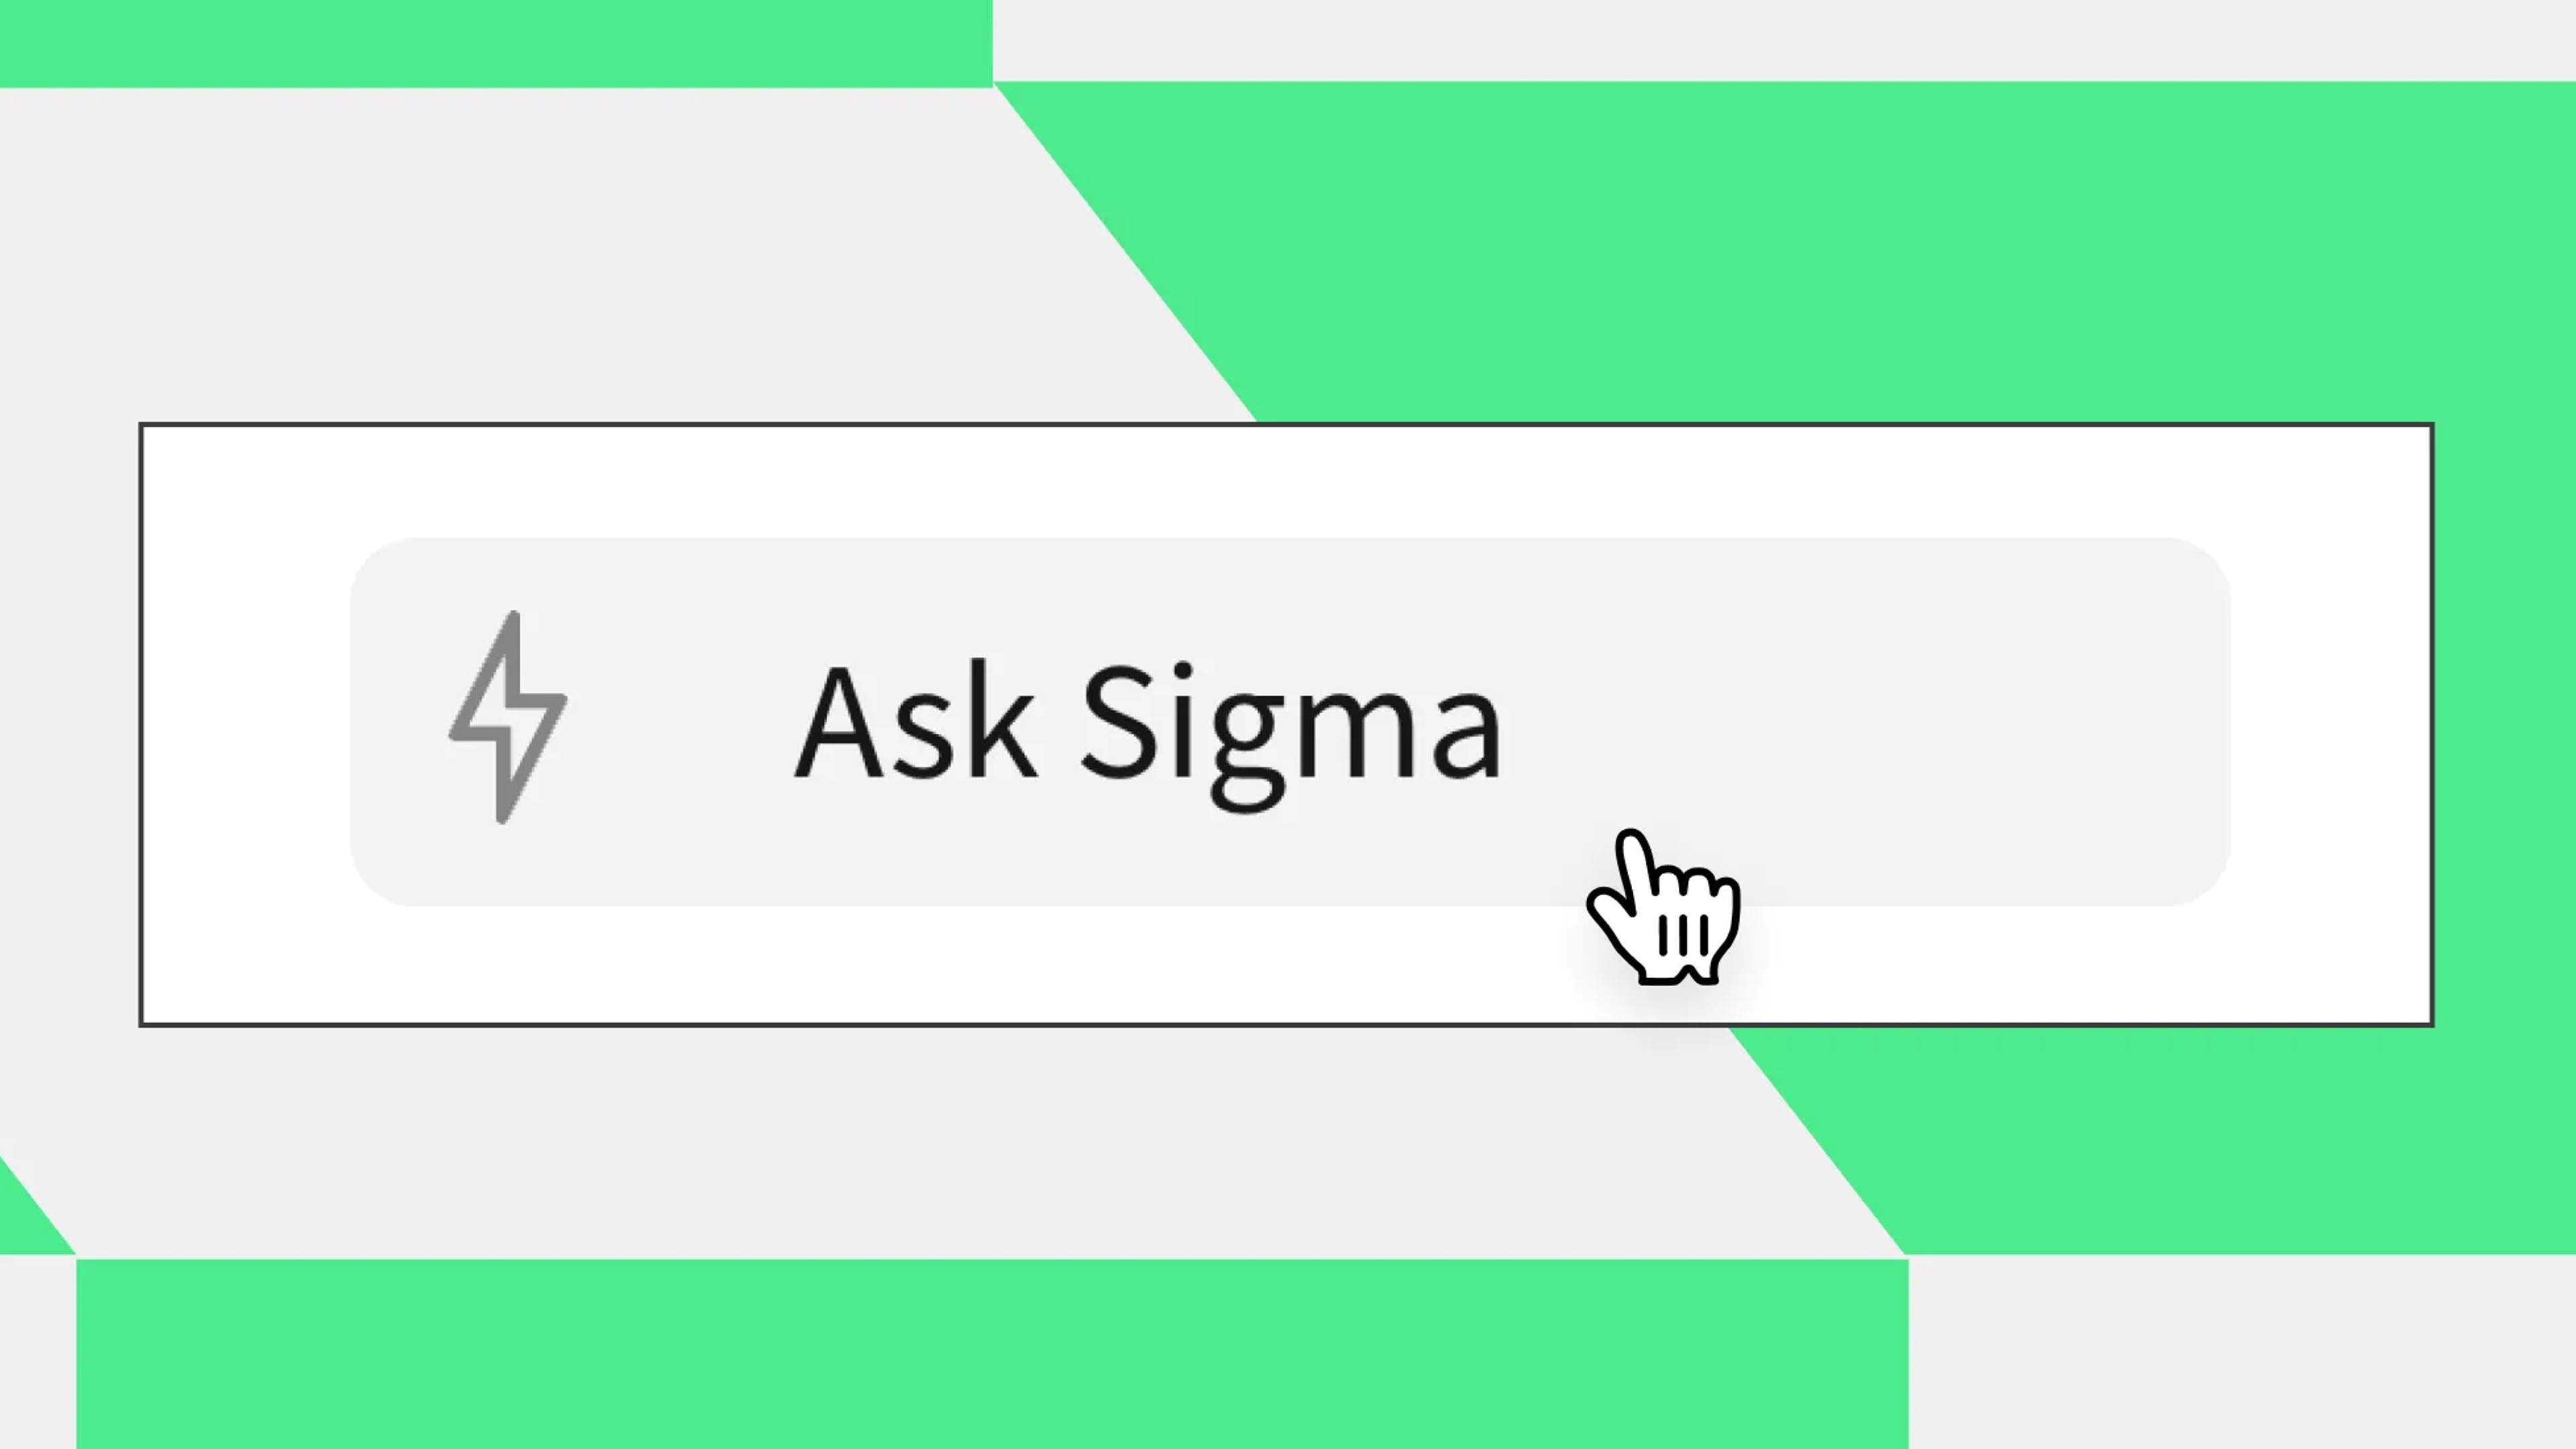
AI you can trust
Ask Sigma helps you jumpstart analysis by showing its work. Ask questions in plain English and get transparent, step-by-step answers.

Turn insights into apps
Automate workflows and build data apps so teams can update forecasts and take action, all in one place.

Features designed with data analysts in mind.
Real-time collaboration
Edit workbooks live with stakeholders for immediate action and alignment.
Data models
Define reusable metrics and relationships to enable consistency, governance, and self-service across teams.
Writeback
Update and enrich data directly in your CDW for workflows like forecasting and budgeting.
Drill anywhere
Explore data freely. Right-click, drill down, and analyze any field instantly for deeper insights.
Pivot tables
Analyze at any scale using sophisticated pivot tables with custom rows, columns, and hierarchies.
AI query
Run AI models on your data directly from the warehouse for advanced analysis.
“With Sigma, James has become a 100x analyst. His dashboards are impeccably designed and lead to countless big 'aha' moments.”
Christopher Sheehey
Director of Data Science, UnitedMasters
Top teams choose Sigma.
See for yourself. Sigma is a G2 crowd favorite, backed by countless reviews.

Related resources

How To Communicate Data To Stakeholders In A Way They Actually Understand
Make data insights clear and actionable for stakeholders. Learn to simplify analytics with storytelling, visualizations, and effective communication strategies.
Introducing Ask Sigma: AI That Works Like A Data Analyst
Ask Sigma is the AI partner to your analysis journey. It guides you through every step of your thought process and broadens your understanding of the data.
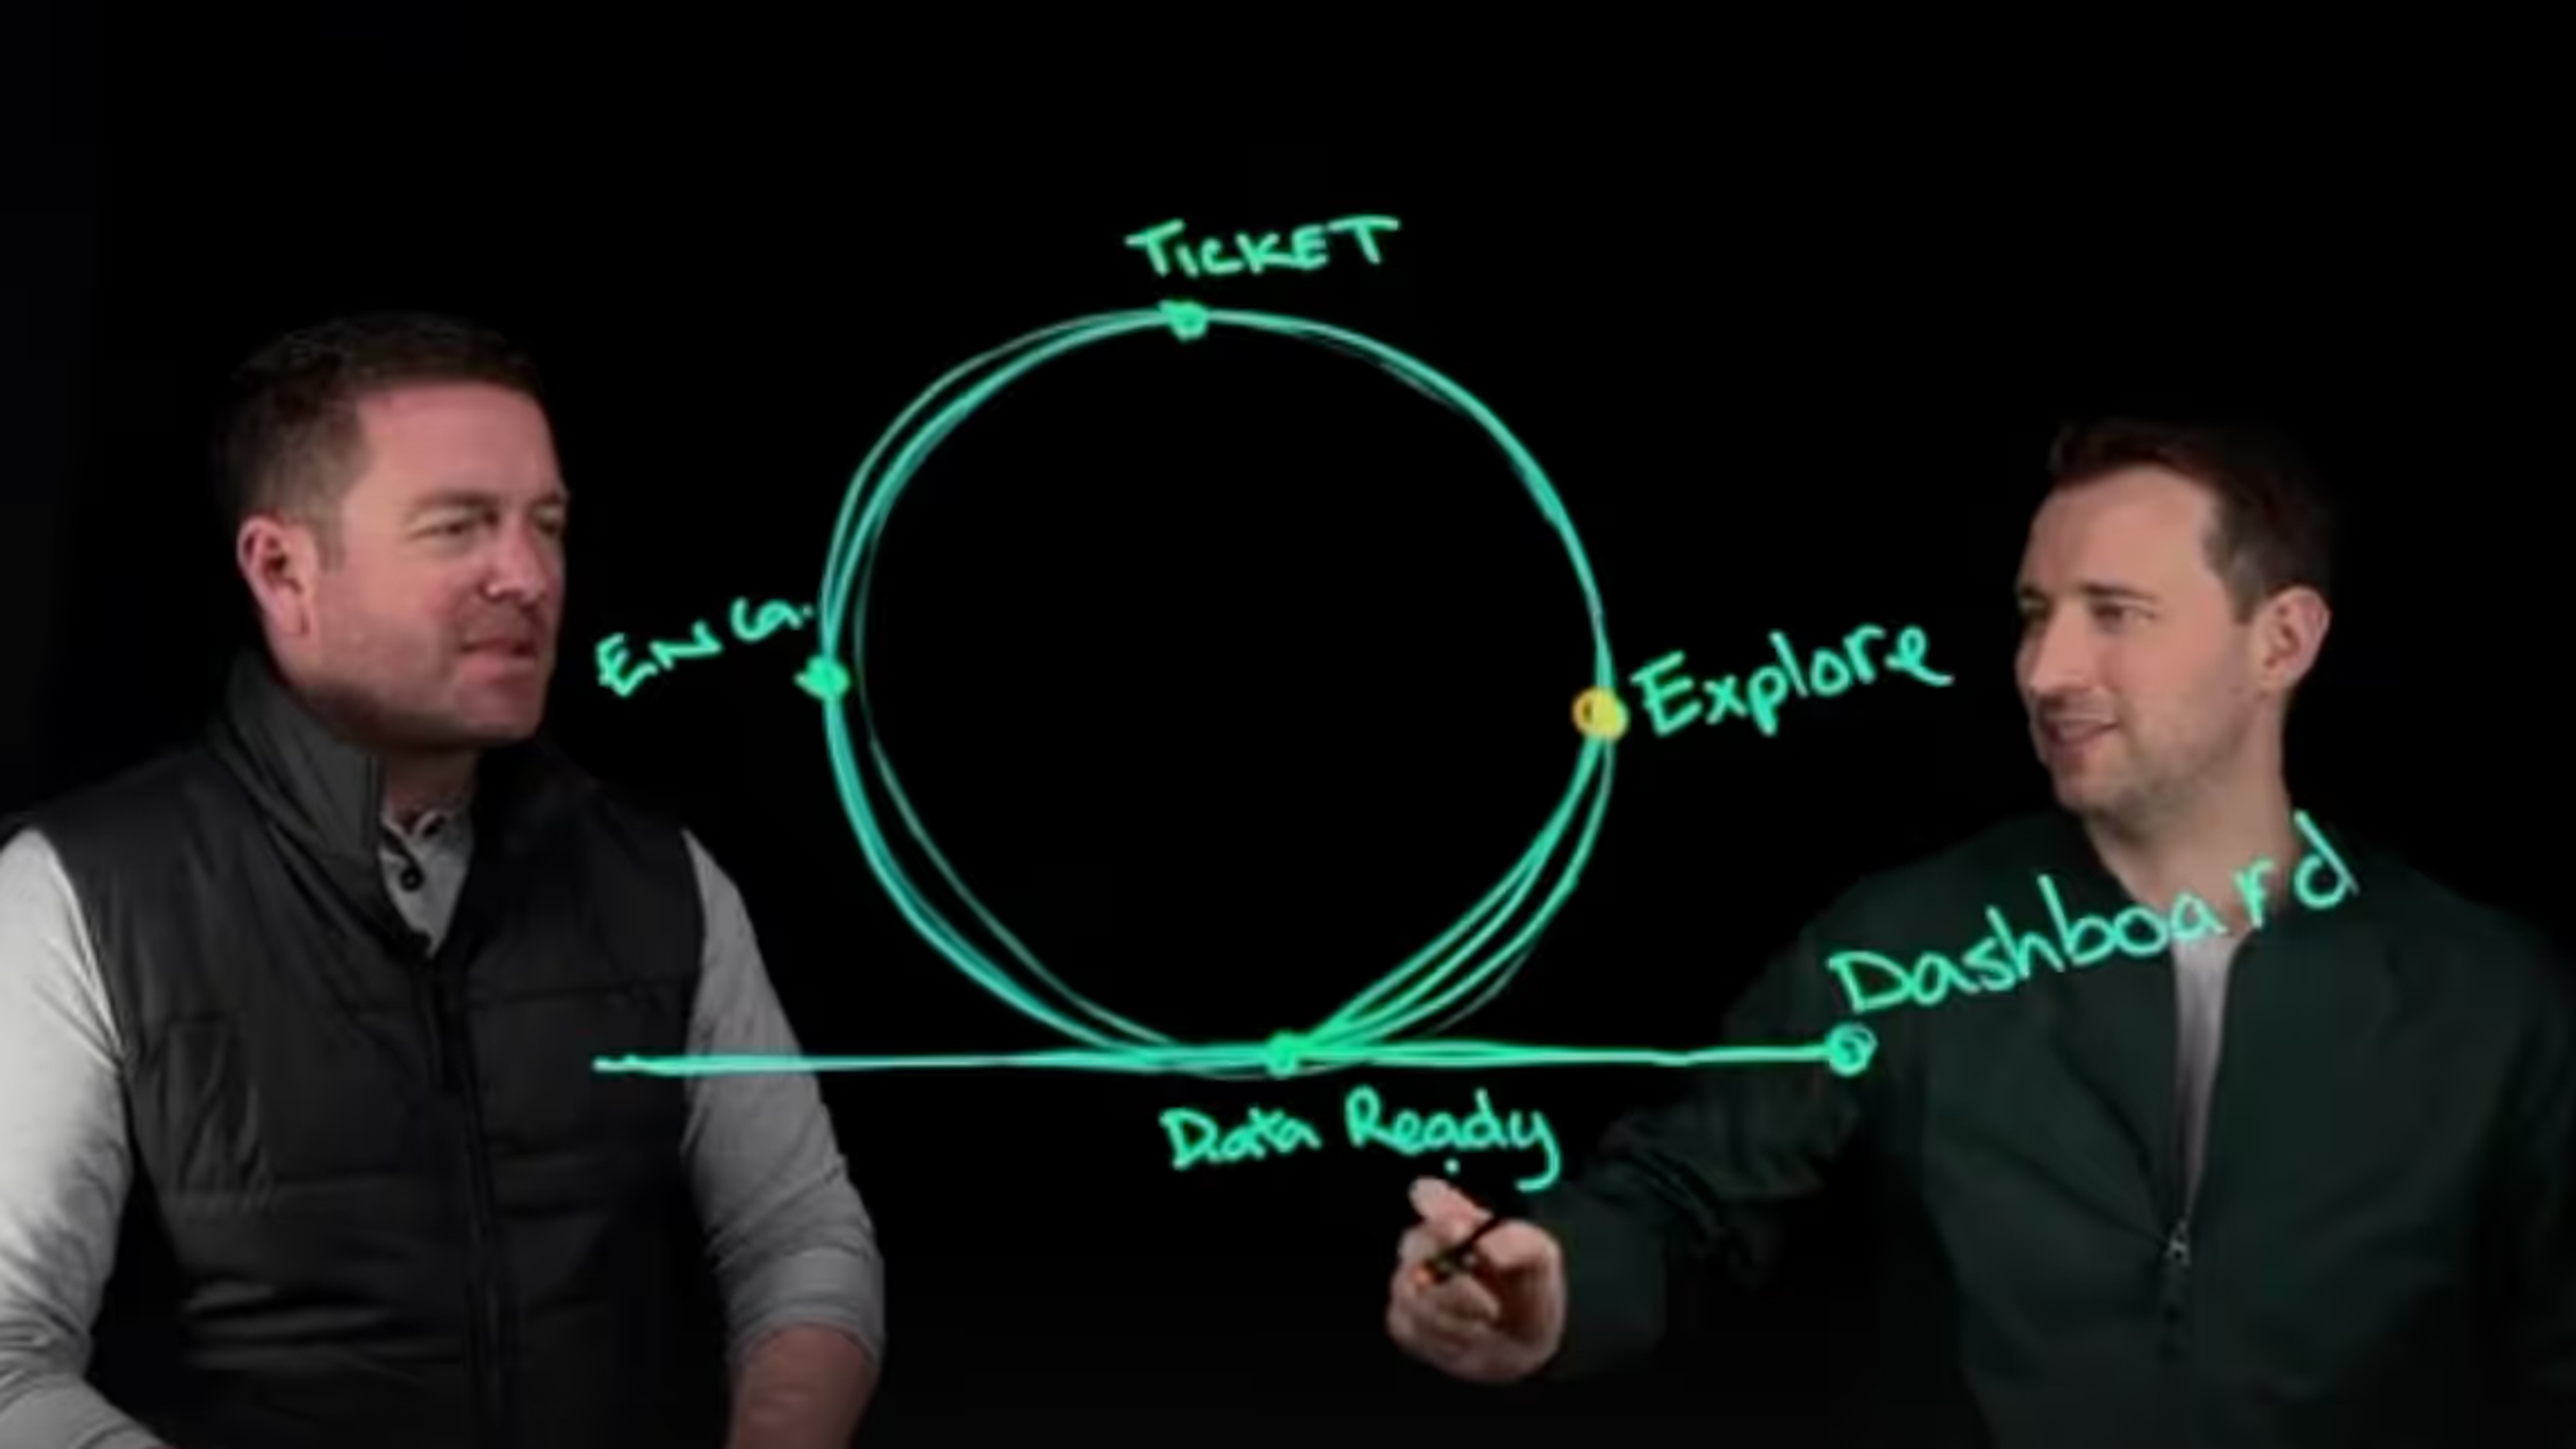
How Sigma Stops Endless Data Loops Between Business and Data Teams
Watch how Sigma solves the dashboard dilemma by simplifying data access and easing data team workloads.

Podium’s Data Transformation: How Sigma Simplified Analytics for Enhanced Decision-Making
Discover how Podium transitioned from a fragmented data landscape to streamlined analytics using Sigma, enabling faster, data-driven decisions across teams.

Alice + Olivia Chooses Sigma for Data Analysis
Ira Miller, VP of Information Technology at Alice + Olivia, shares how Sigma has helped streamline its data analysis process. Alice + Olivia is an expansive women's fashion retailer with 26 stores, a large wholesale business, and a direct-to-consumer business. Ira discusses how Sigma's user-friendly interface and Excel-like feel made it the ideal solution for their data analysis needs.

UnitedMasters: Revolutionizing Independent Music with Sigma
UnitedMasters recently received the Workbook Designer Award in Sigma’s first-ever Data Impact Awards.
Activate your data warehouse
Stop buying a new tool for every workflow. Build it once on governed data, then scale it across the business.