Google Analytics 4
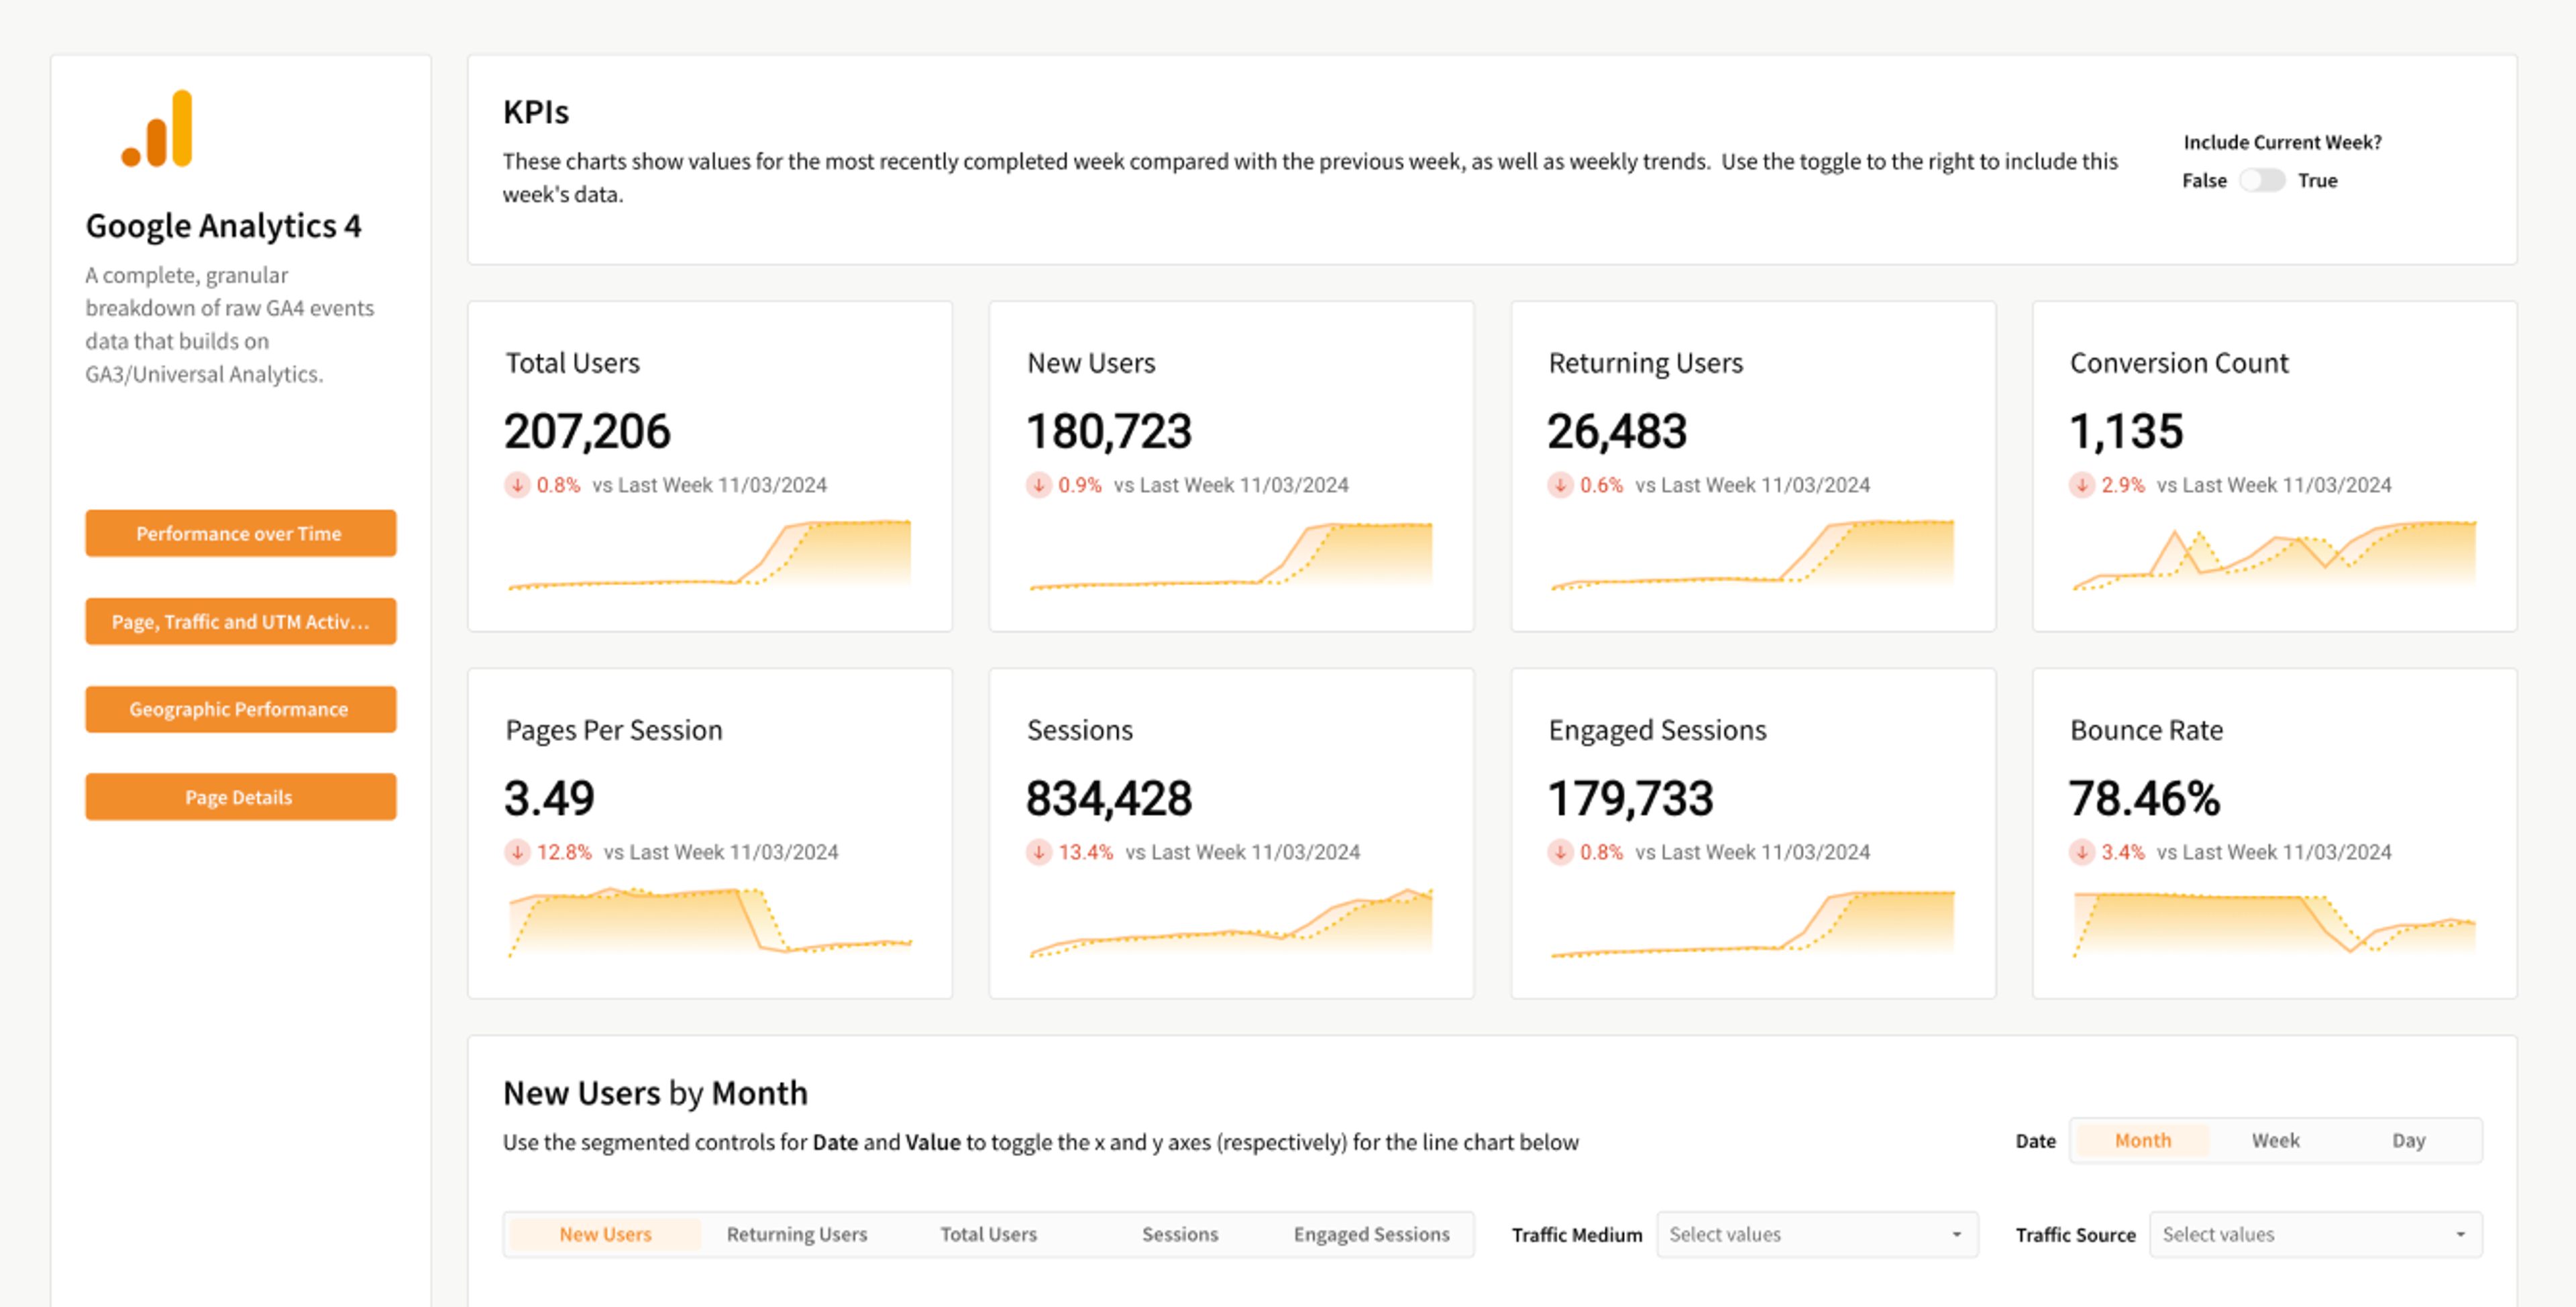
Analyze GA4 data beyond stock reporting. Drill all the way down to every page and individual session.
Request a demoRelated Interactive Demos
Demo
Learn moreProvider Anomaly Detection
Demo
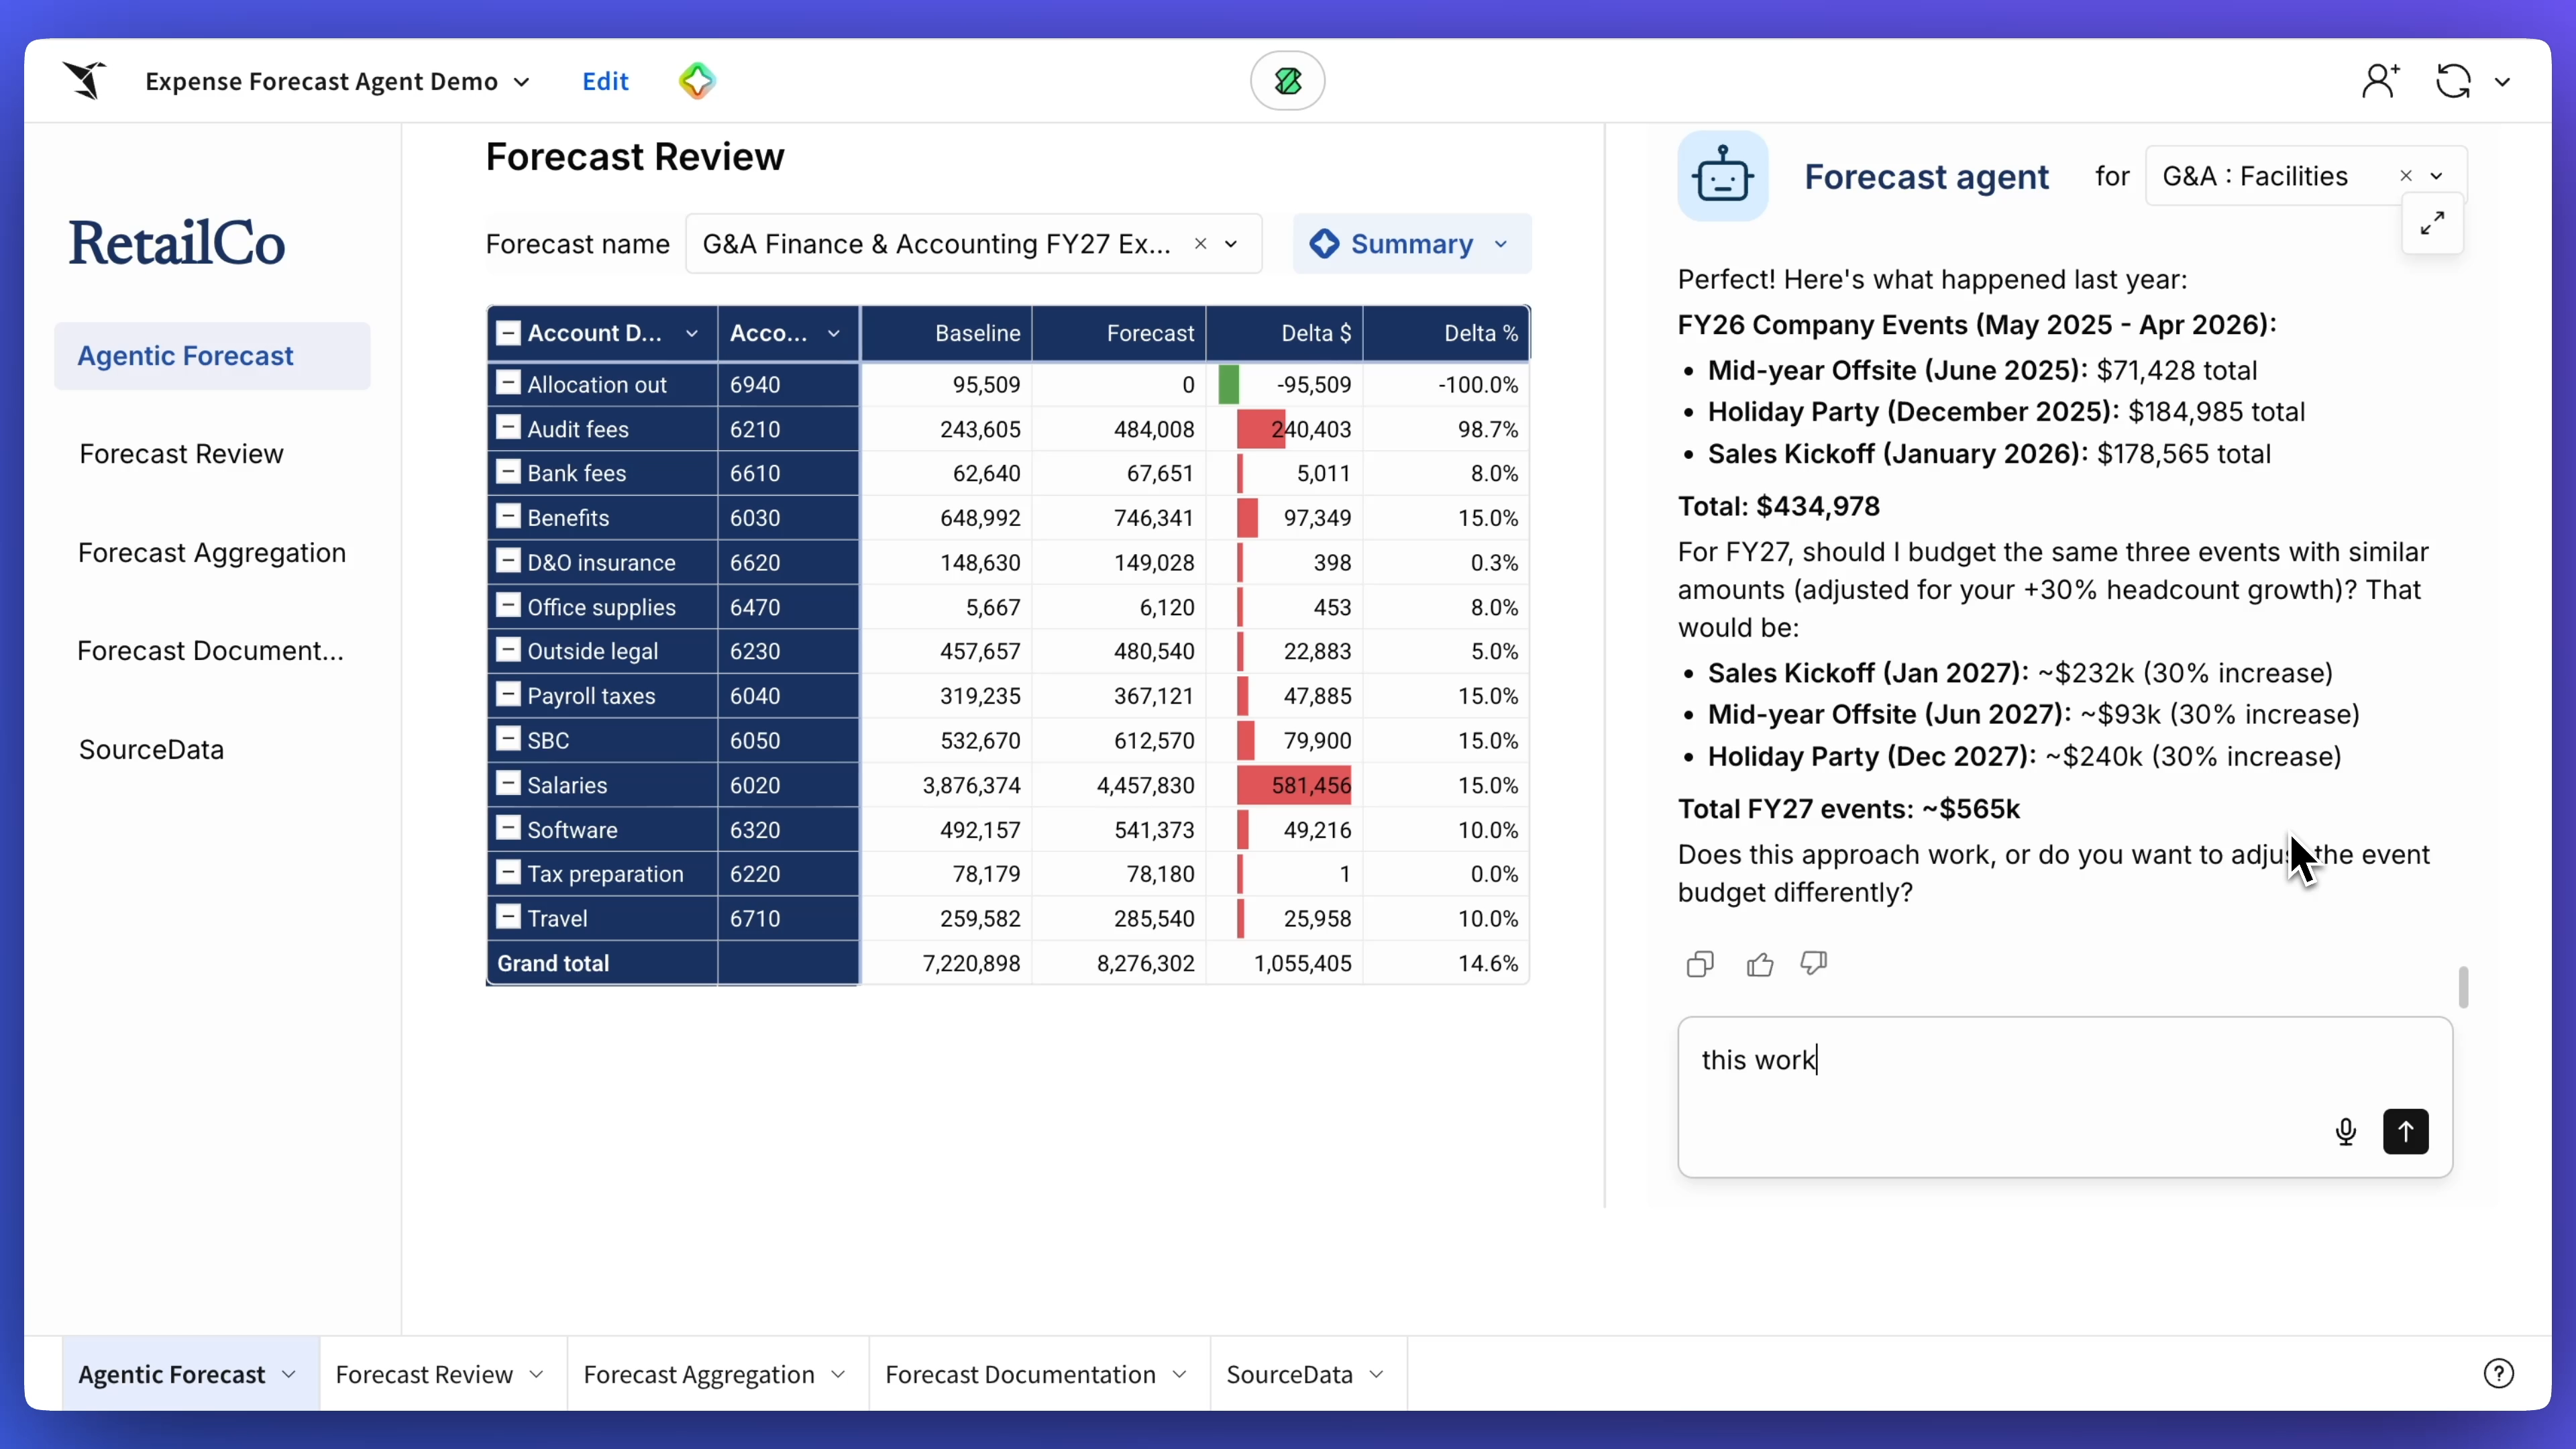
Learn moreExpense Forecast Agent
Automate budget forecasting on live data with an expense forecast agent that collects parameters, analyzes historical trends, and generates growth assumptions in one pass. The agent builds the forecast and documents the logic, while the workbook surfaces insights, breakdowns, and approval-ready memos.
Demo
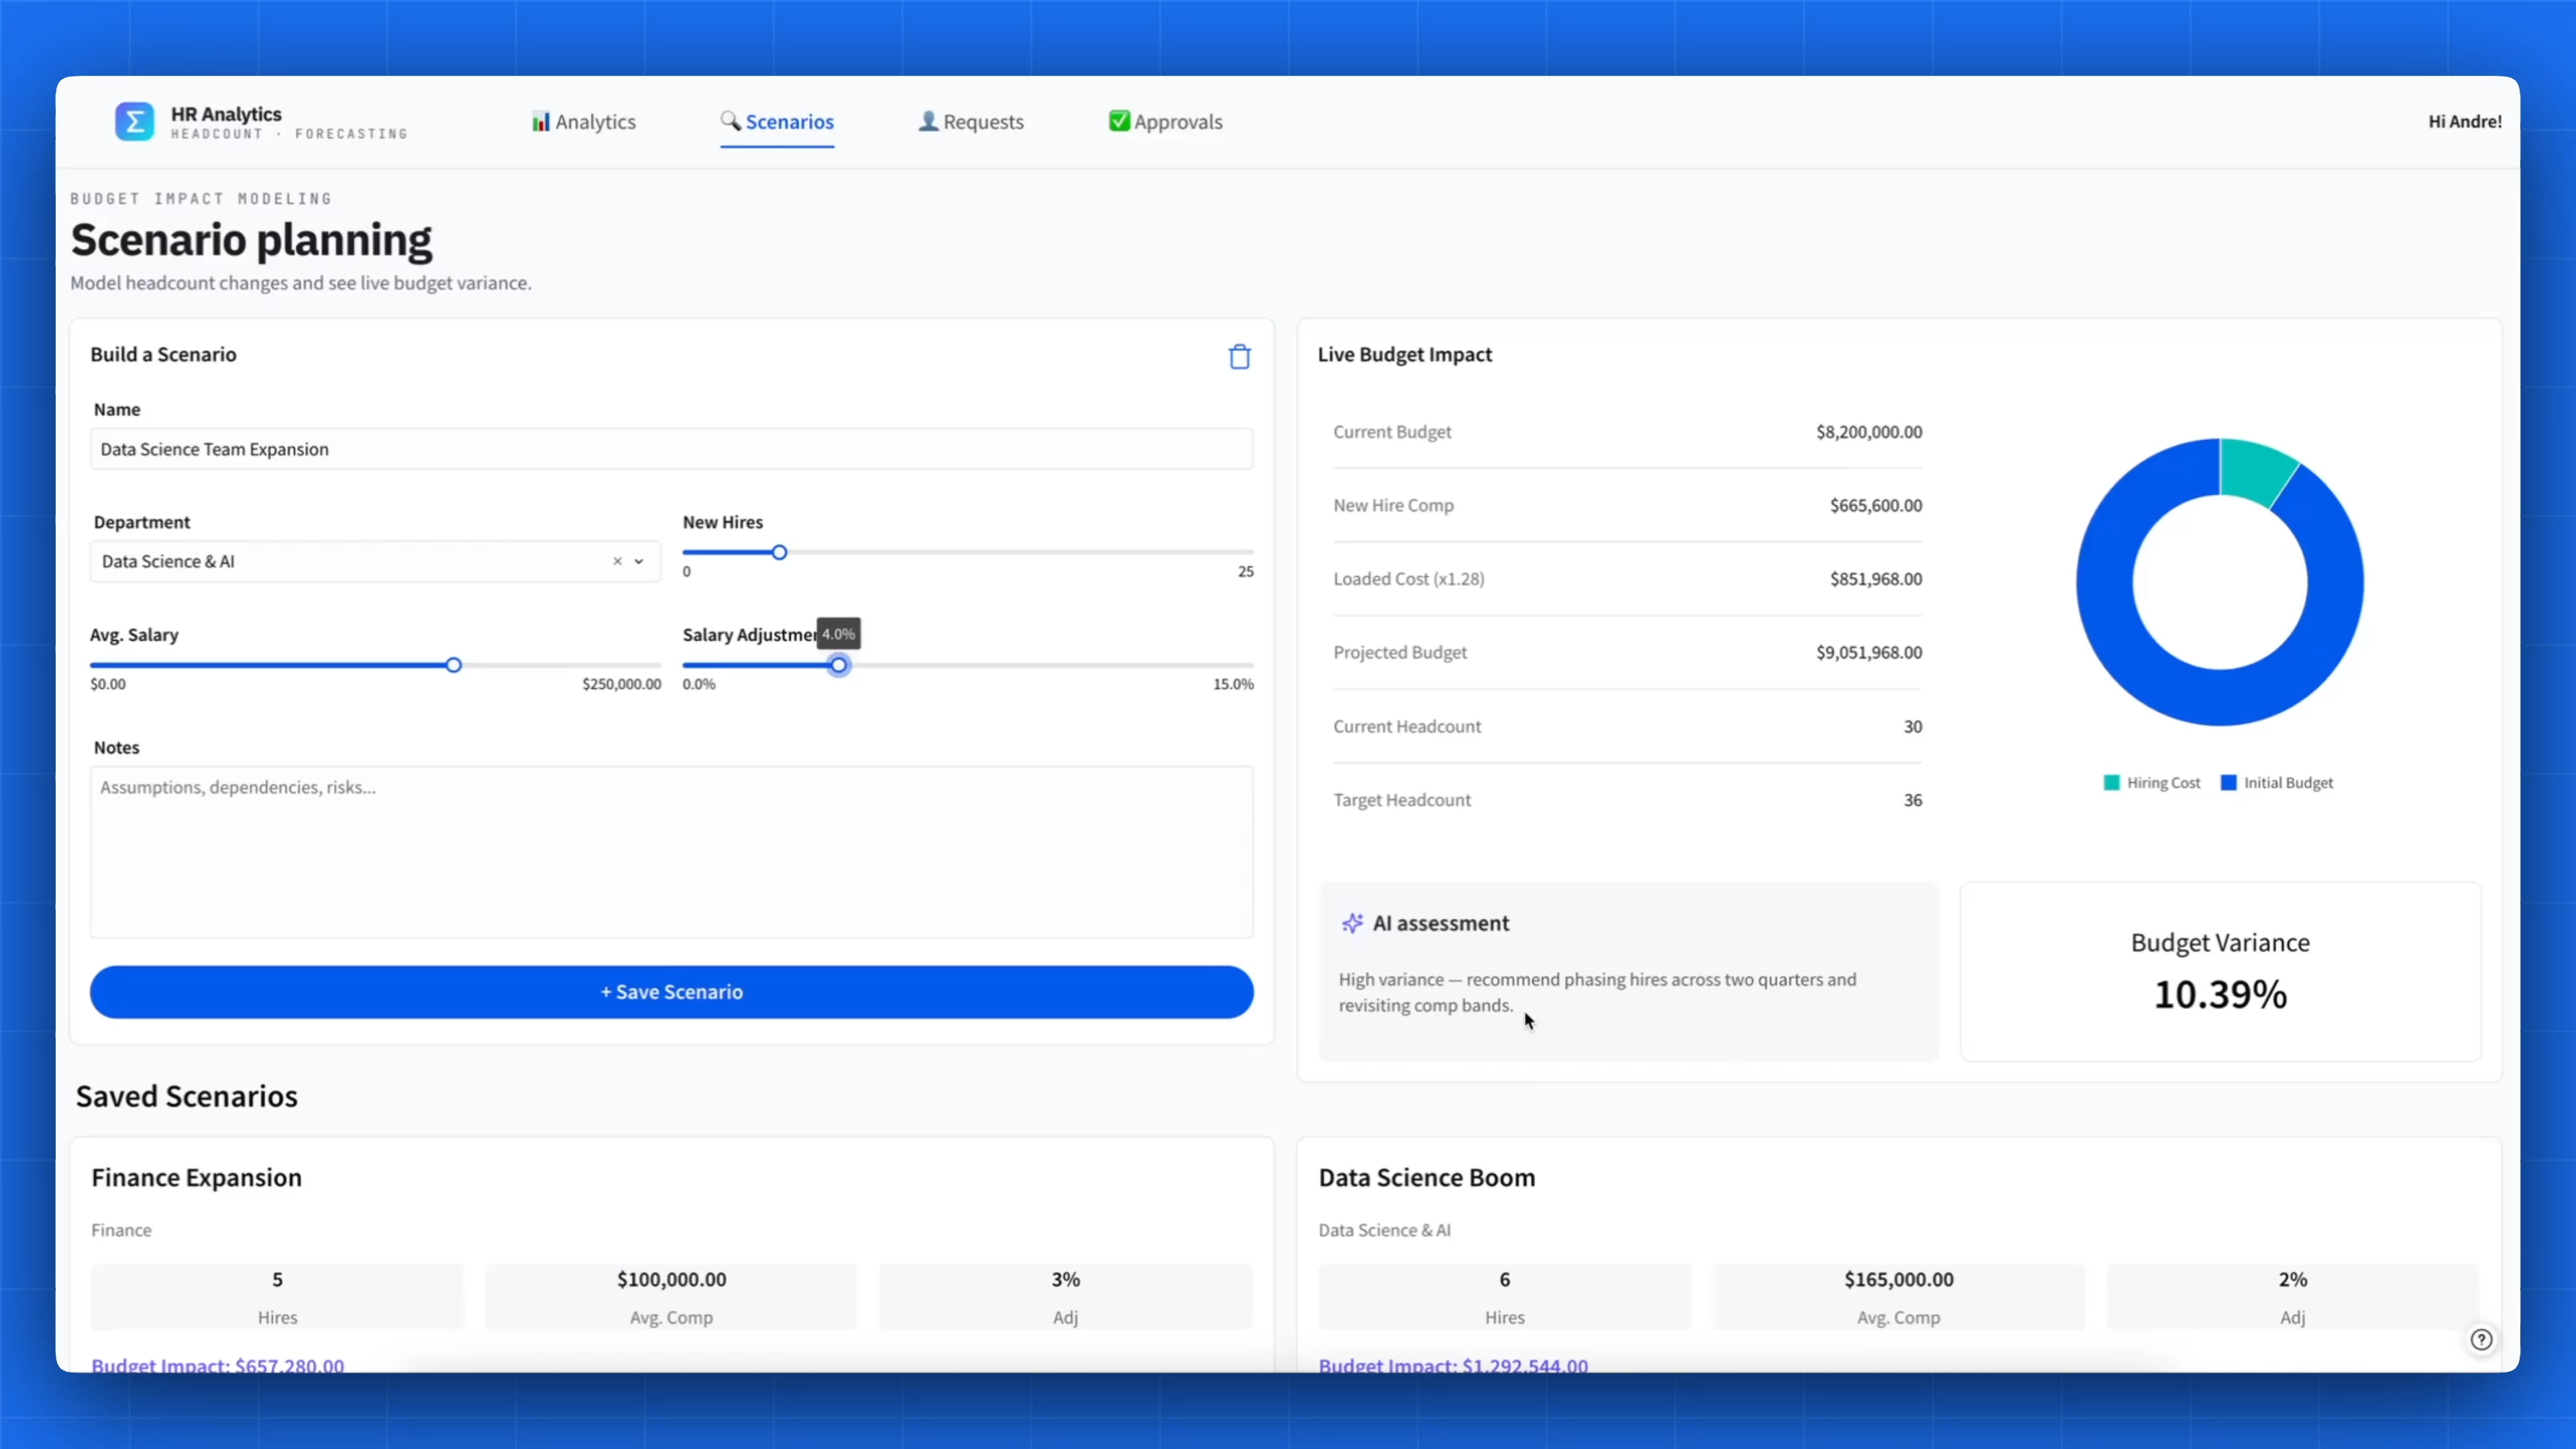
Learn moreAI-Driven Headcount Planning and Hiring Scenarios
HR leaders and hiring managers get a live view of headcount targets, pipeline risk, and attrition signals by department. Build hiring scenarios against your budget, then submit and approve requests directly in Sigma.
Activate your data warehouse
Stop buying a new tool for every workflow. Build it once on governed data, then scale it across the business.