Dynamic Profit & Loss Statement
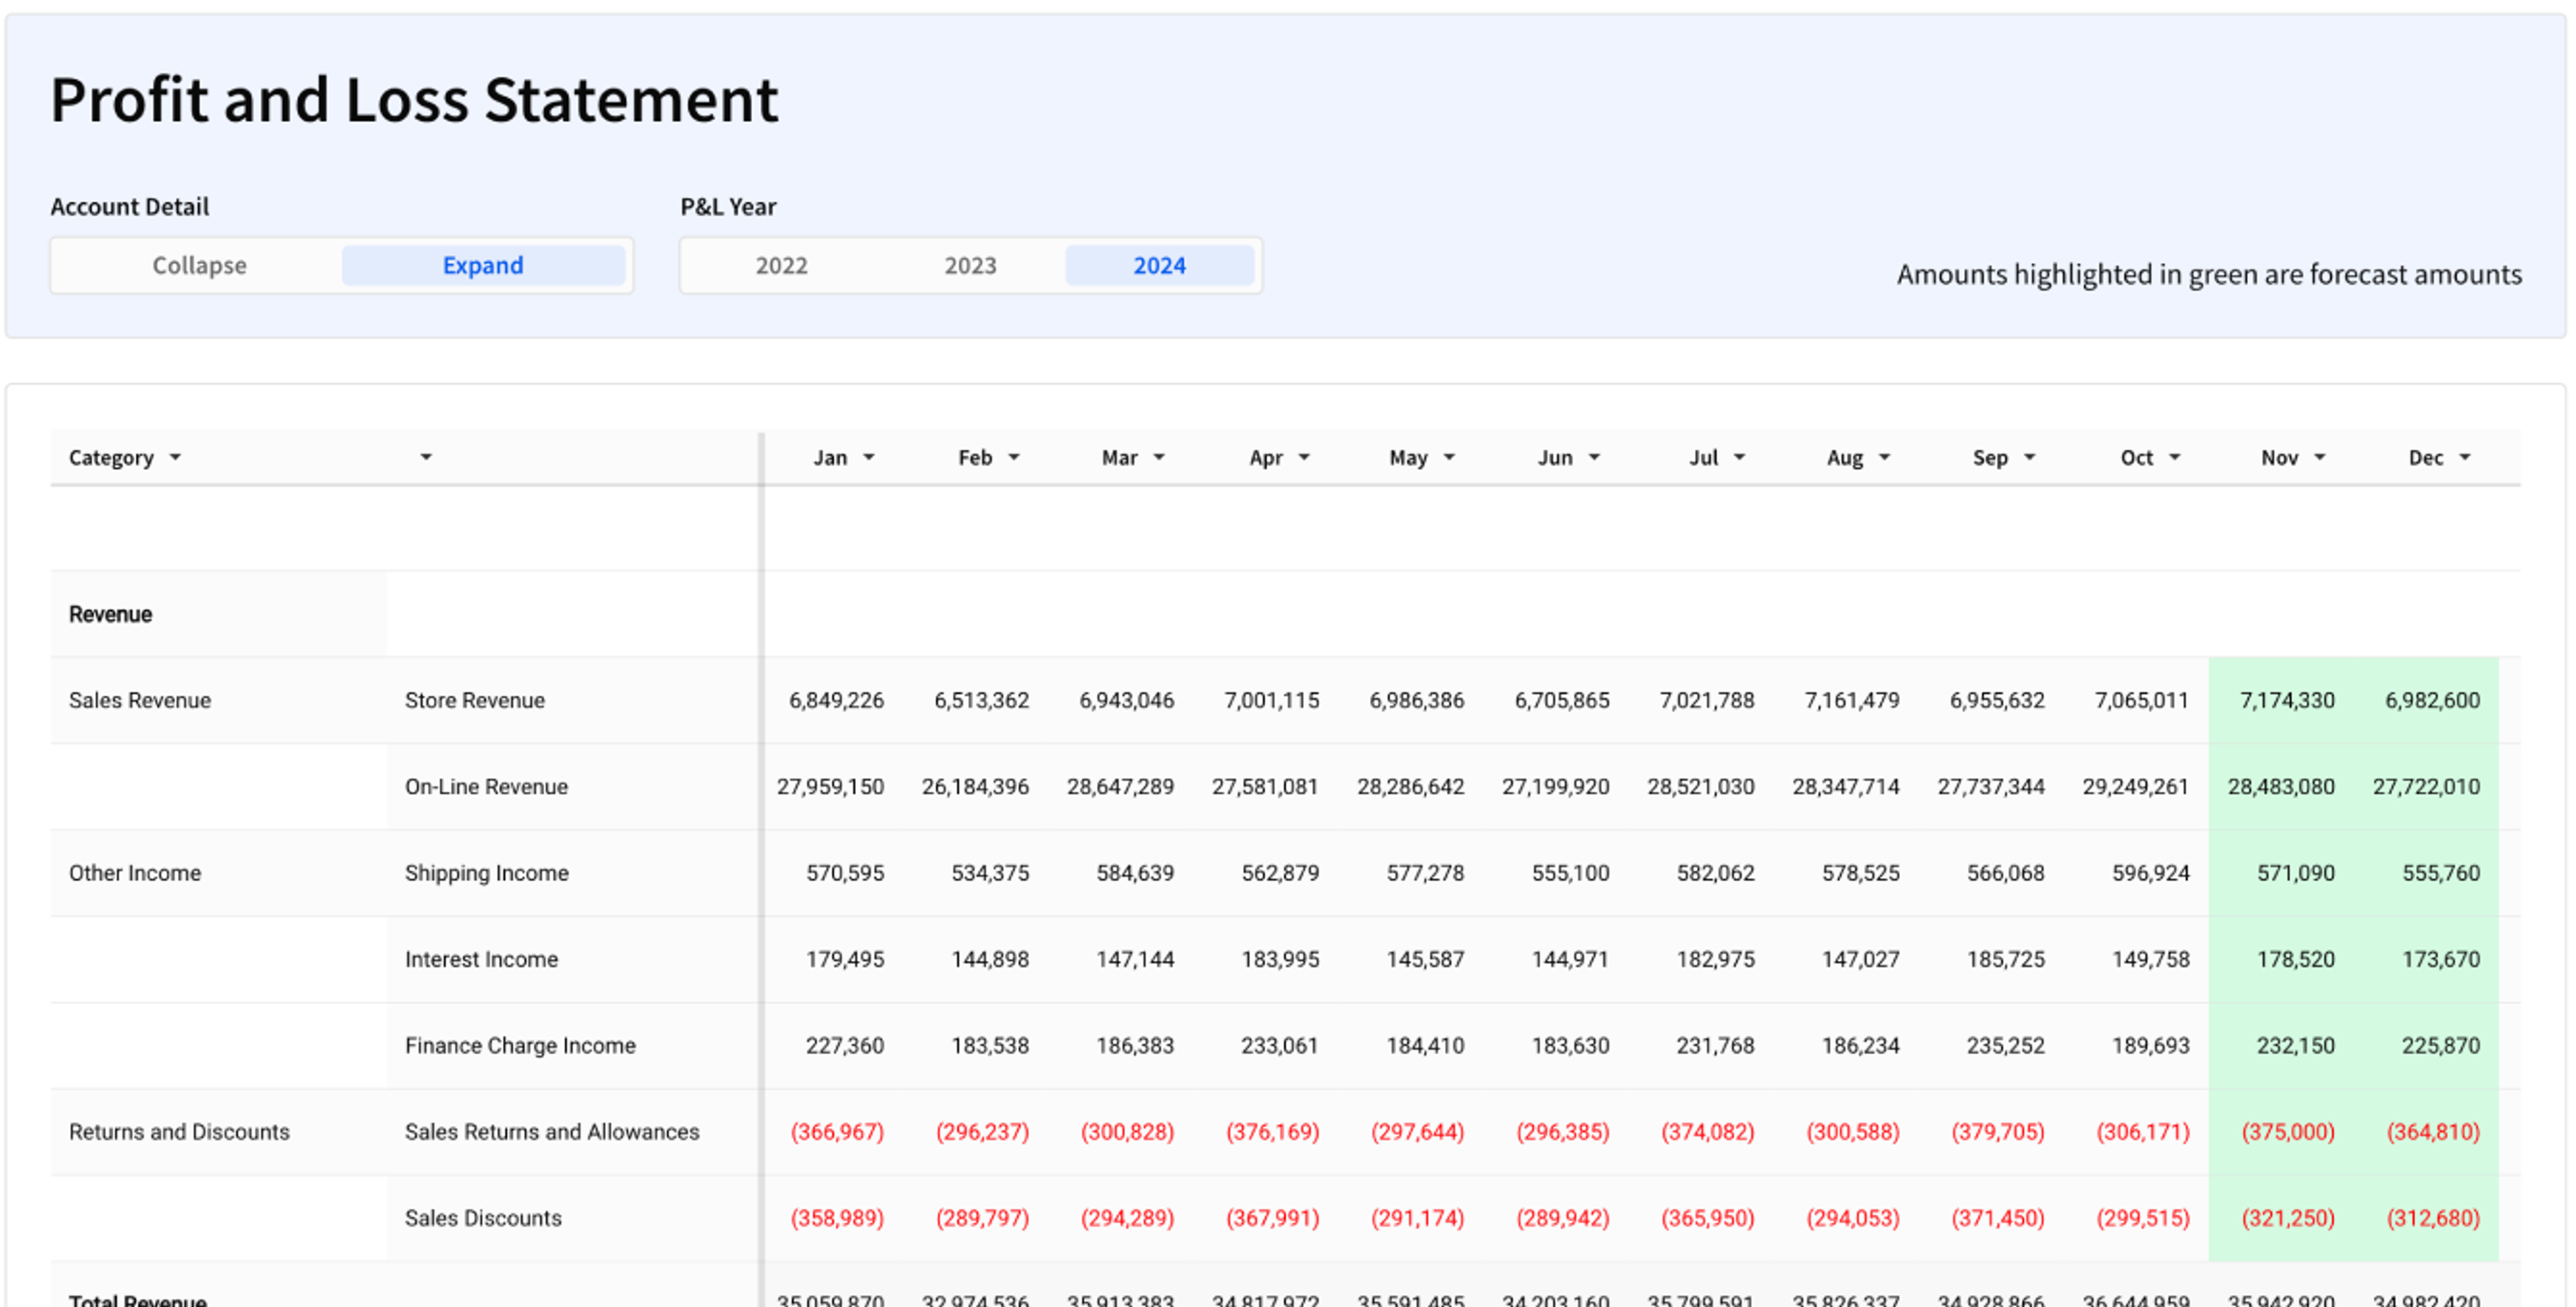
Build a P&L in Sigma. Toggle years, granularity, and forecasts at the click of a button, all on live warehouse data.
Request a demoRelated Interactive Demos
Demo
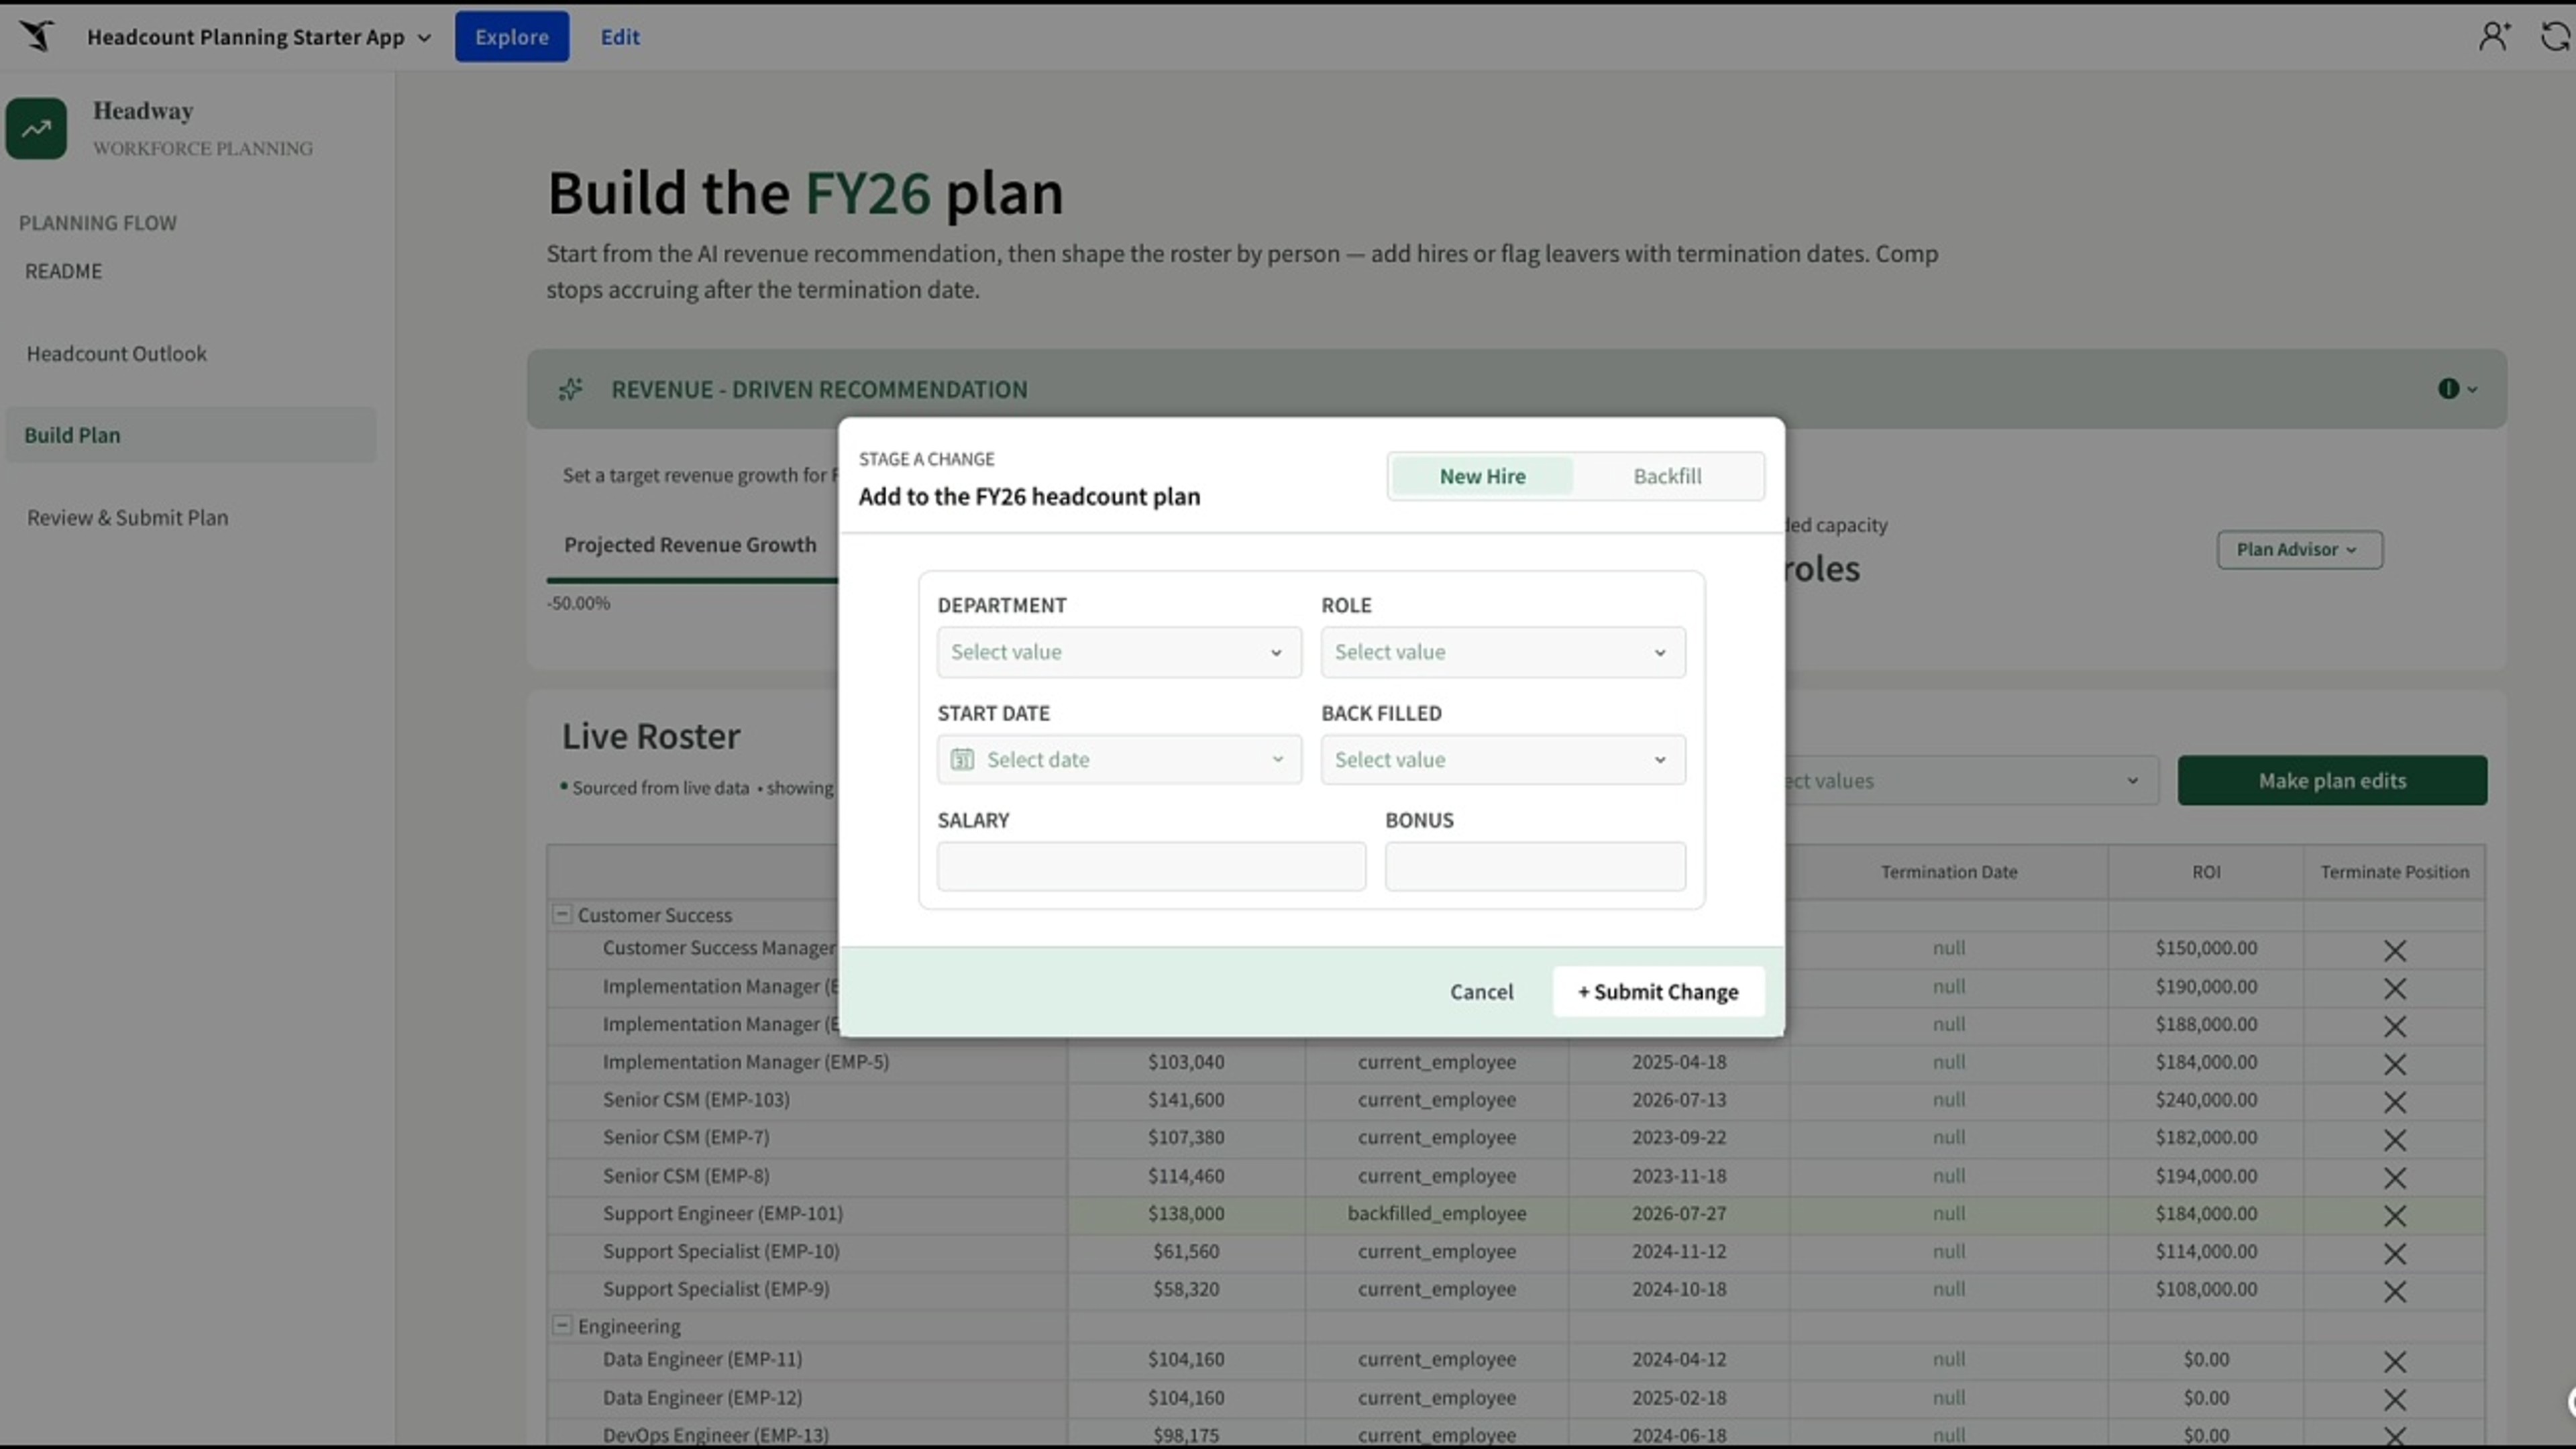
Learn moreHeadcount planning
Build a headcount plan tied to your revenue goals, with AI hiring recommendations and approvals that update the roster live, instead of a spreadsheet that drifts from the plan.
Demo
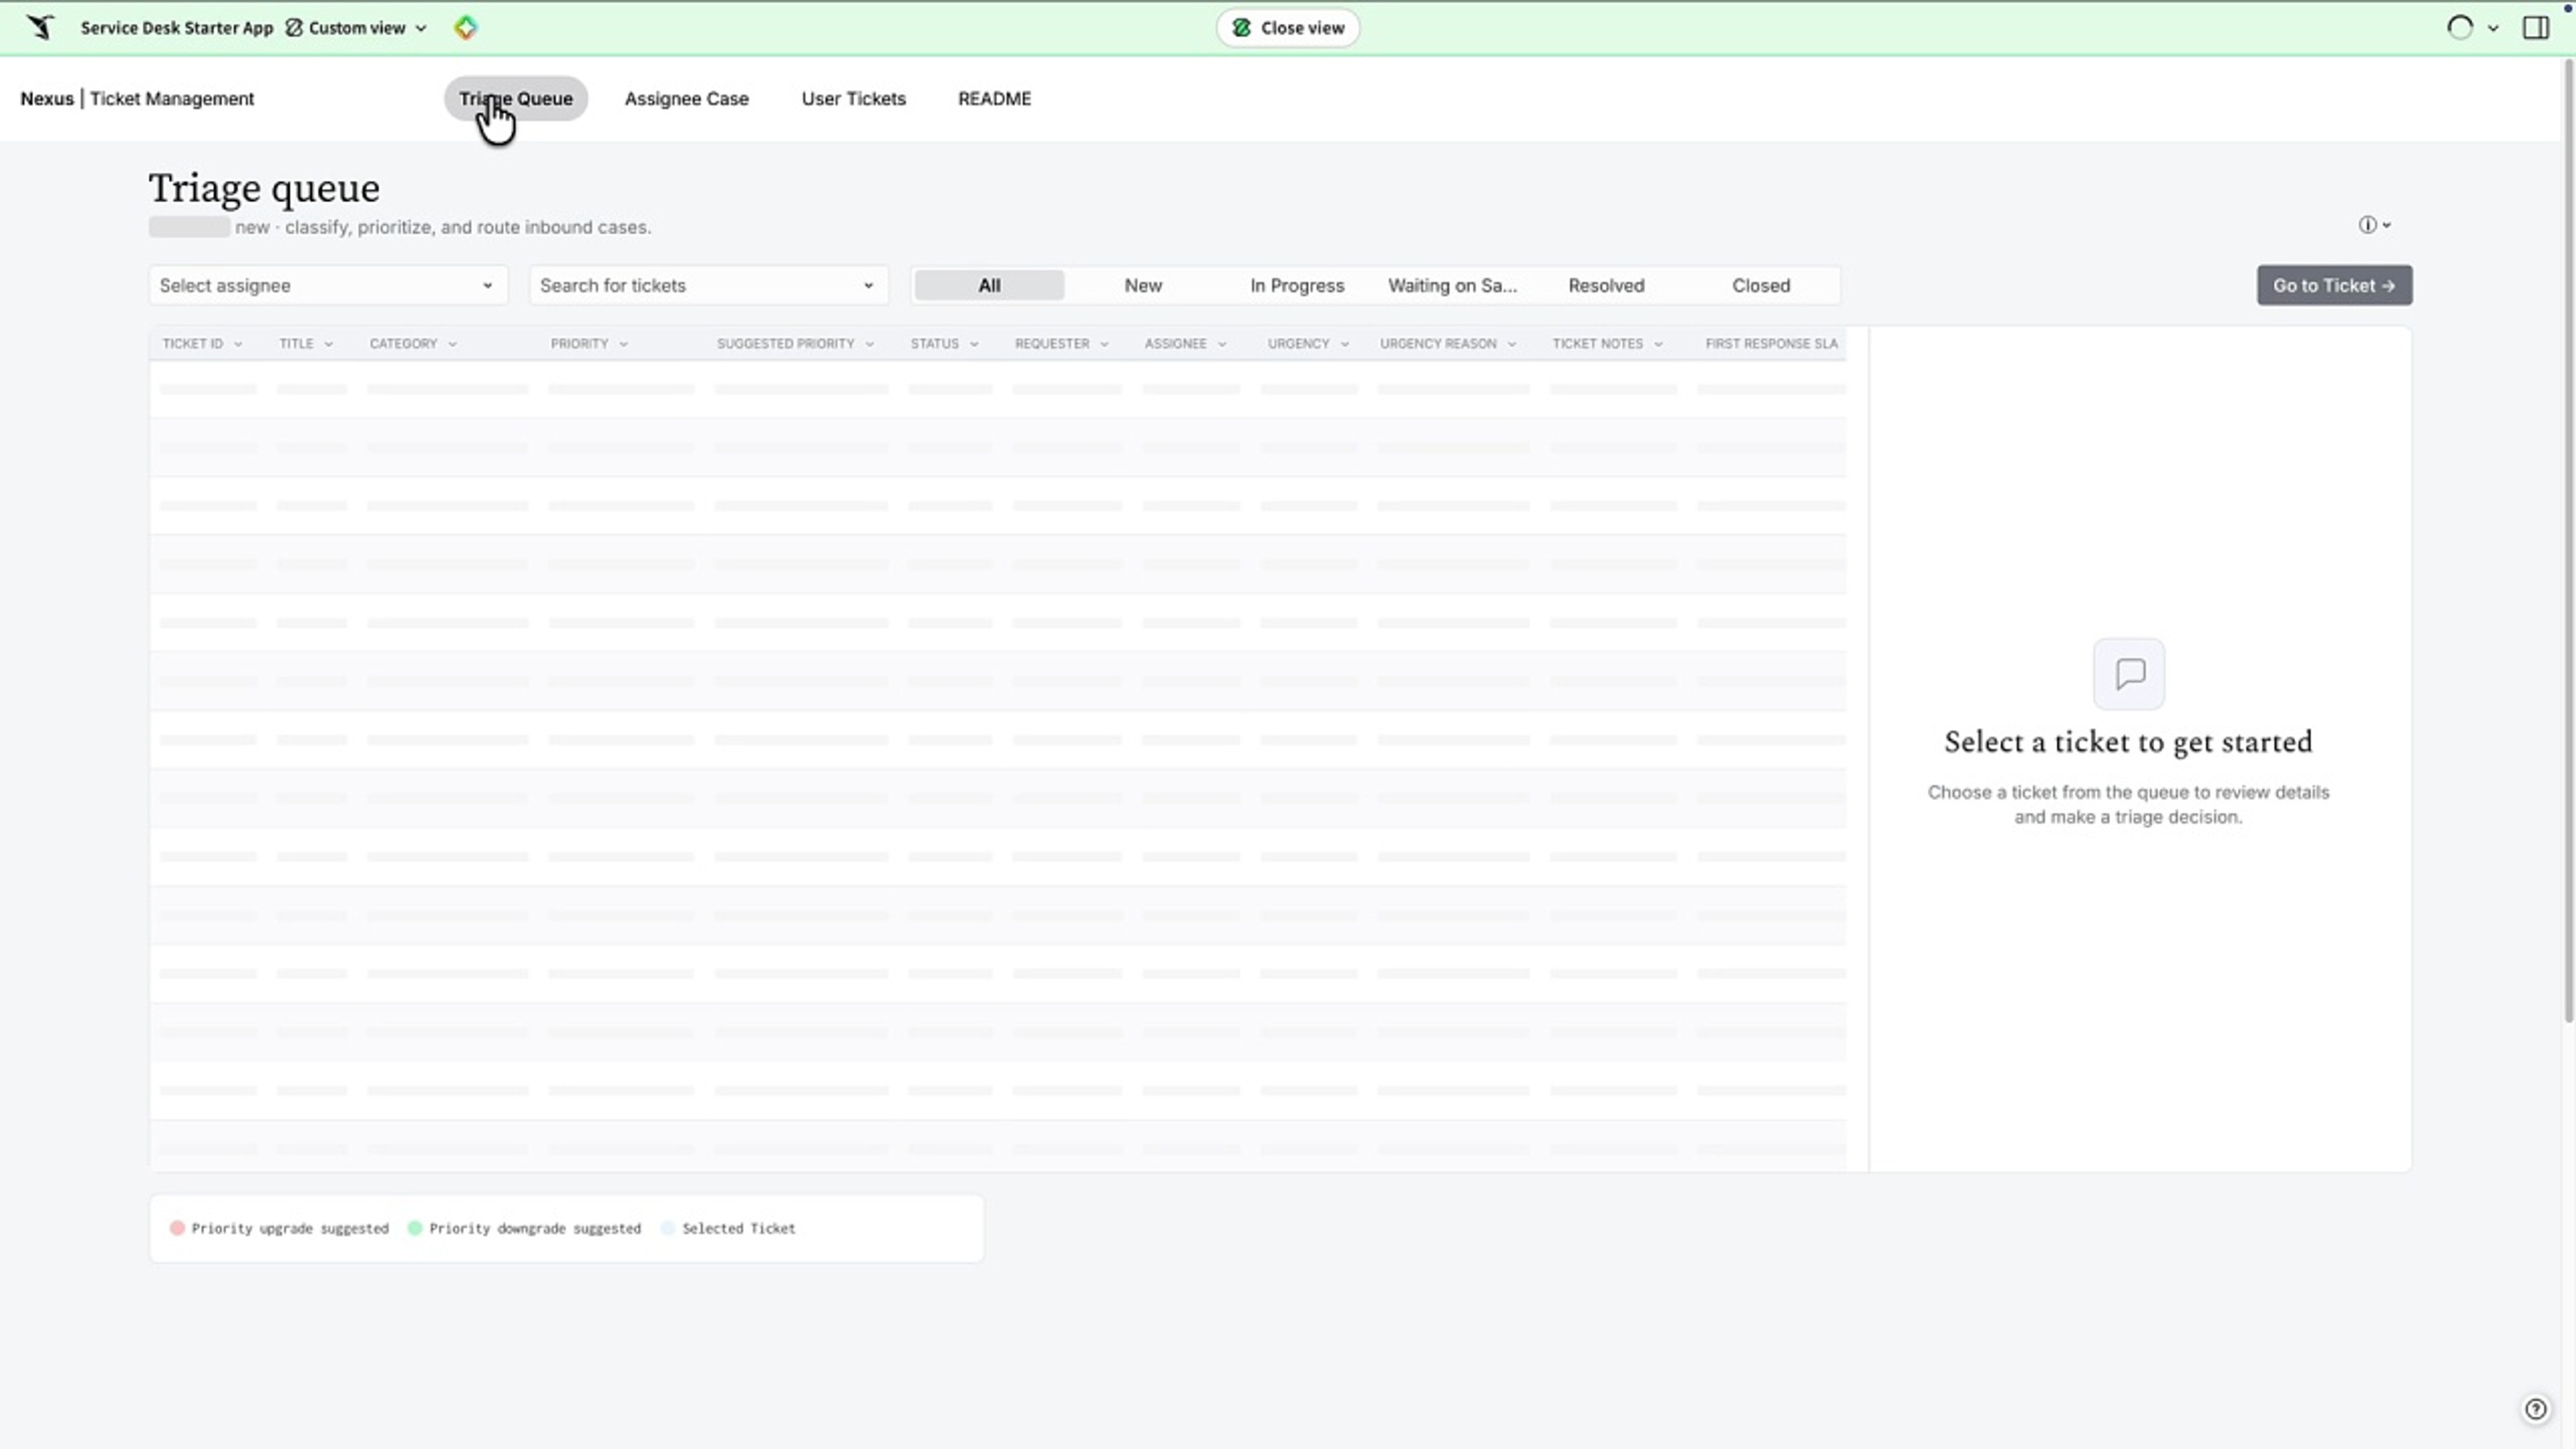
Learn moreTicketing
Take internal requests from intake to resolution in one place, with AI routing each ticket to the right owner and a live queue everyone can see.
Demo
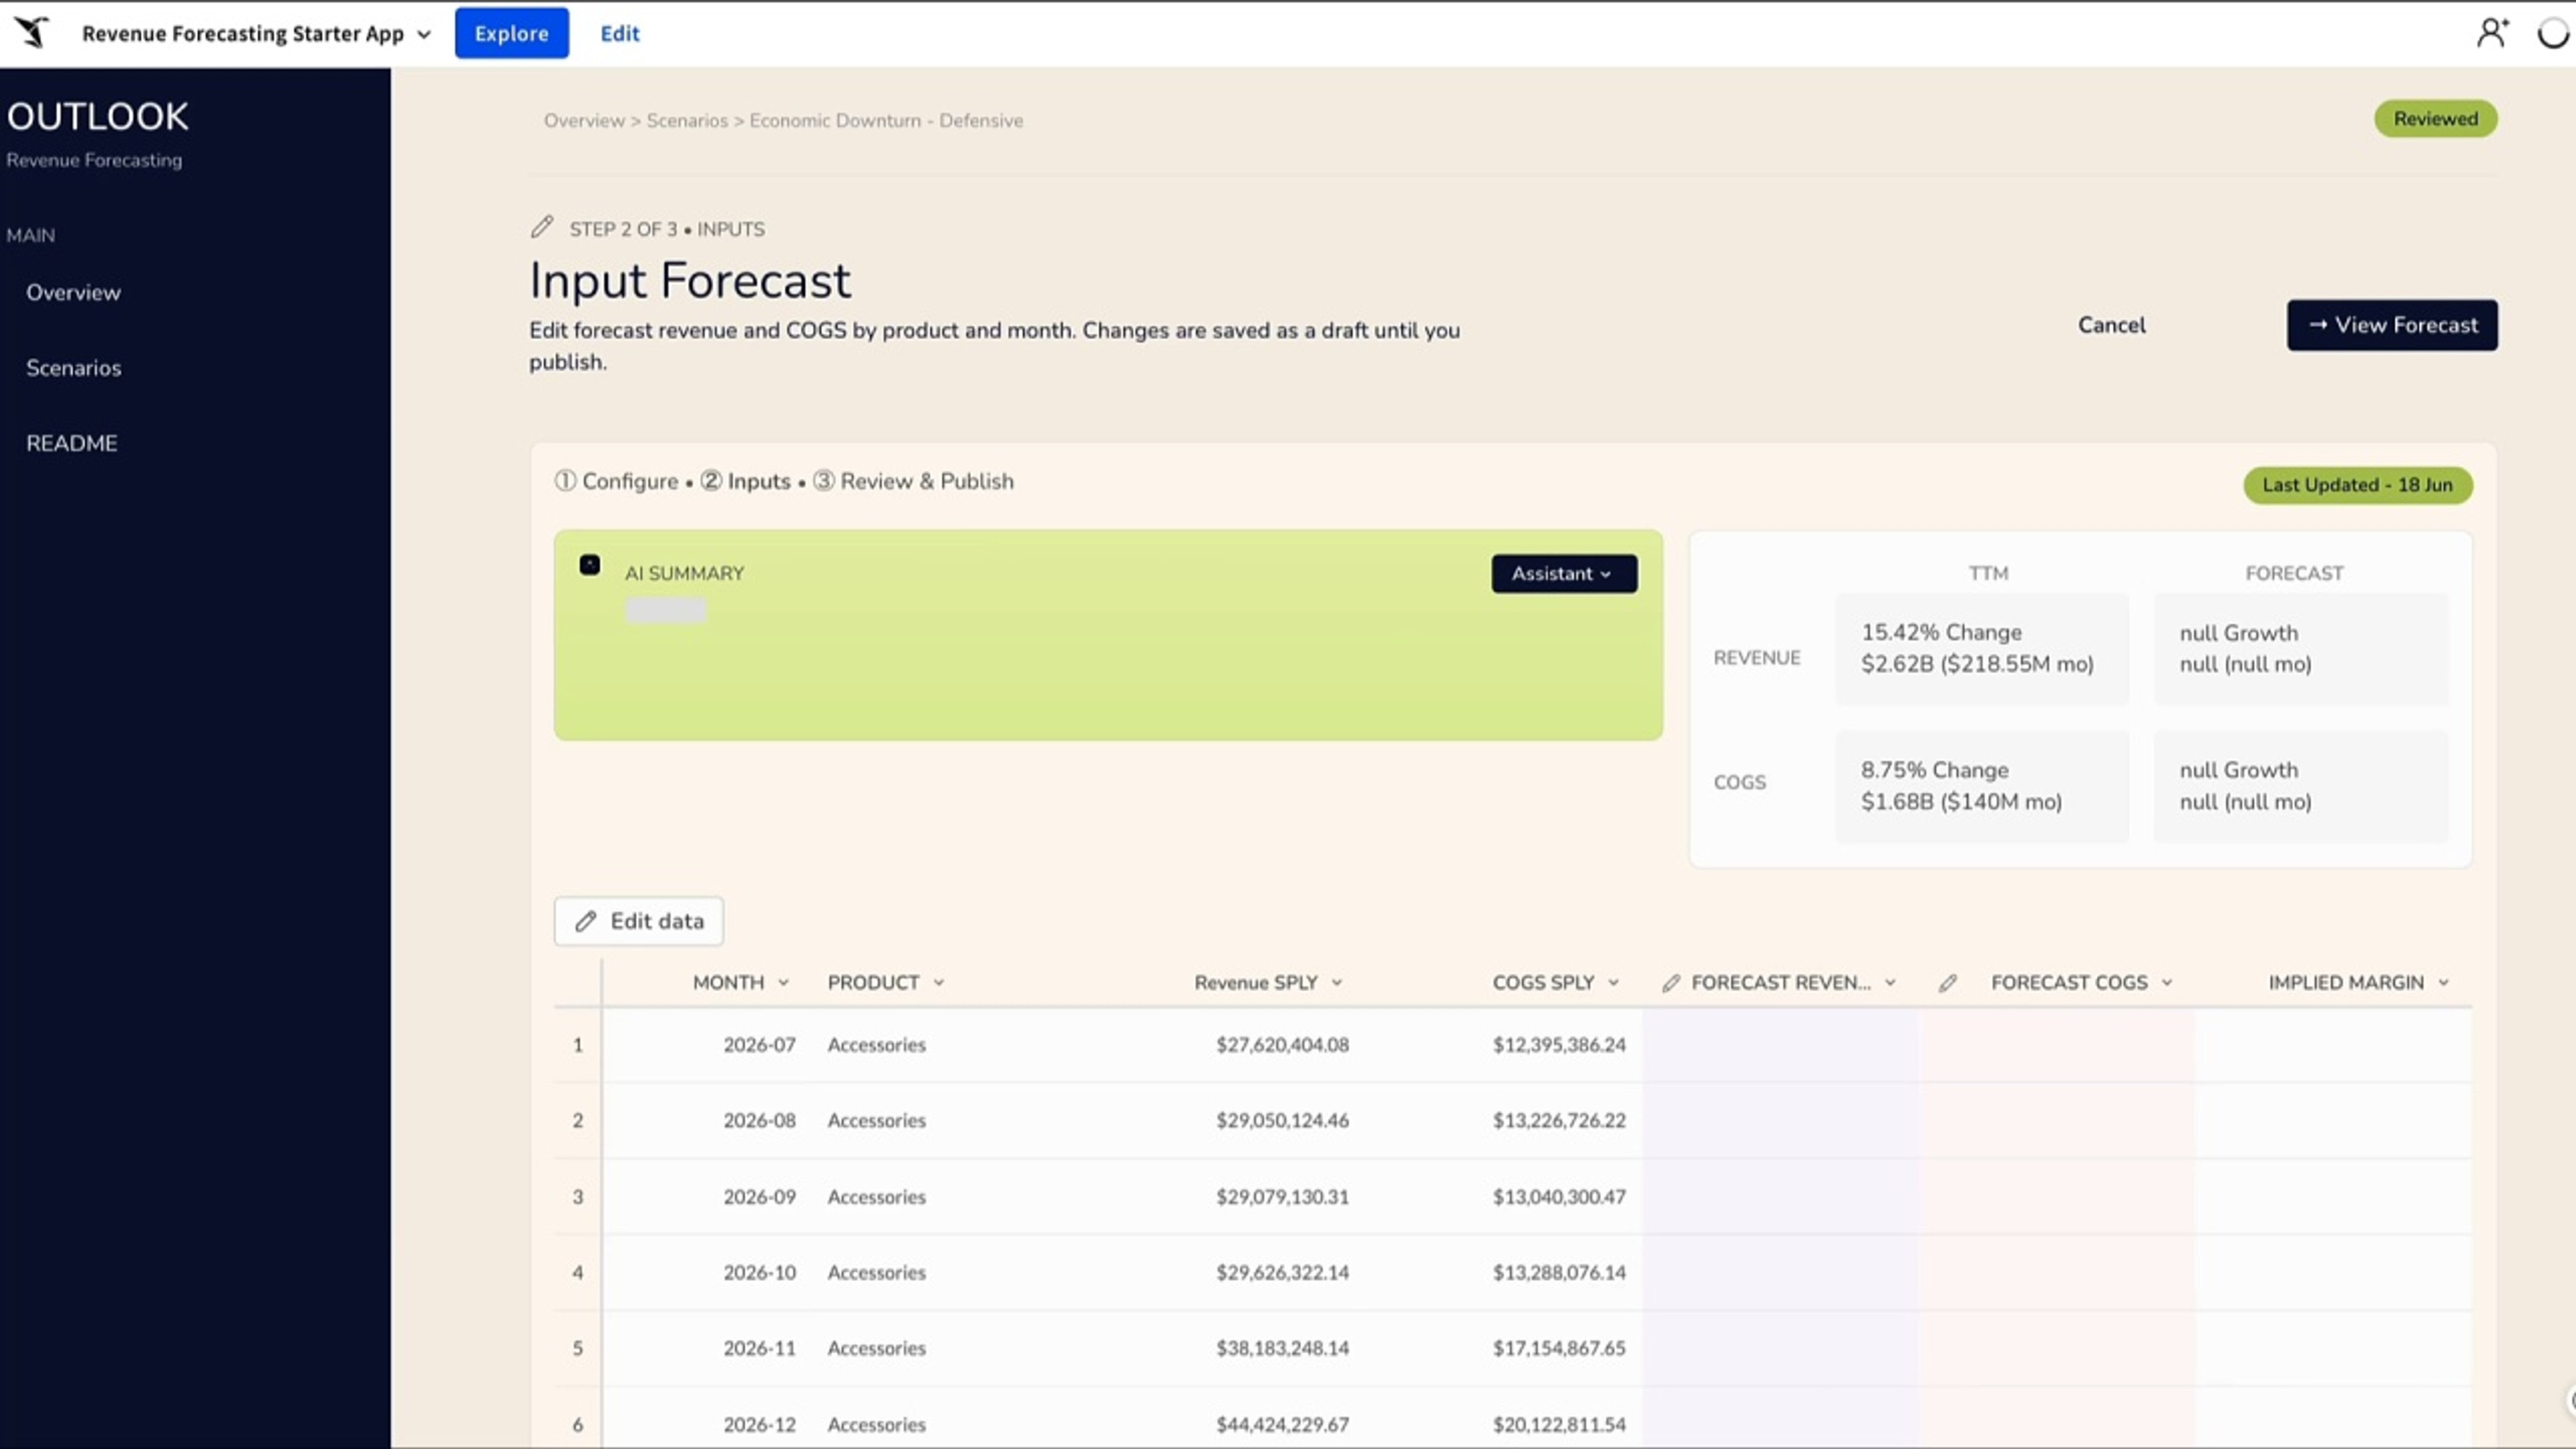
Learn moreRevenue forecasting
Spin up a revenue forecast scenario in minutes, adjust the inputs with AI guidance, and watch the impact update live, instead of waiting on a consultant or another spreadsheet.
Activate your data warehouse
Stop buying a new tool for every workflow. Build it once on governed data, then scale it across the business.