Lookup, Lookup!


We are launching Lookups, a powerful new feature that lets Sigma users connect related data elements in their Workbook using a familiar and simple interface: a spreadsheet formula. Business users can use Lookups to easily perform powerful SQL joins without knowing SQL at all. And using Rollups, you can easily aggregate the data you are looking up, using the same formula syntax. Lookups and Rollups work on cloud scale, with millions and billions of rows of data.
Sigma Workbooks let users bring together multiple elements into a unified canvas. Tables, charts, pivot tables, images and text share a responsive layout, letting users create and present their analysis in a single place. With Lookups, users can do even more with their workbooks.
When you are doing ad-hoc or one off analyses, you don’t want to wait until a data engineer has set up the correct joins for you. Or if users are operating on smaller datasets, they would have needed to export their data out to Excel/Google Sheets, and do VLOOKUPs there. Lookups solve these problems for both BI teams and business users by providing a simple and correct way to perform VLOOKUP style cardinality-preserving joins on related tables and translating skills that the user already has to unlimited scale, while going beyond what traditional spreadsheet implementations of VLOOKUP have to offer.
We built Sigma to bring the infinite scale and power of cloud data infrastructure into the familiar interface of a spreadsheet. Lookups bring us closer to this vision.
You can use Lookups today in your Workbooks by simply typing in a formula:
Lookup([AIRLINES/Airline], [Airline ID], [AIRLINES/Airline ID])
Now, let’s dive into some of the powerful analyses that lookups and rollups enable.
Lookups for enriching and labeling data
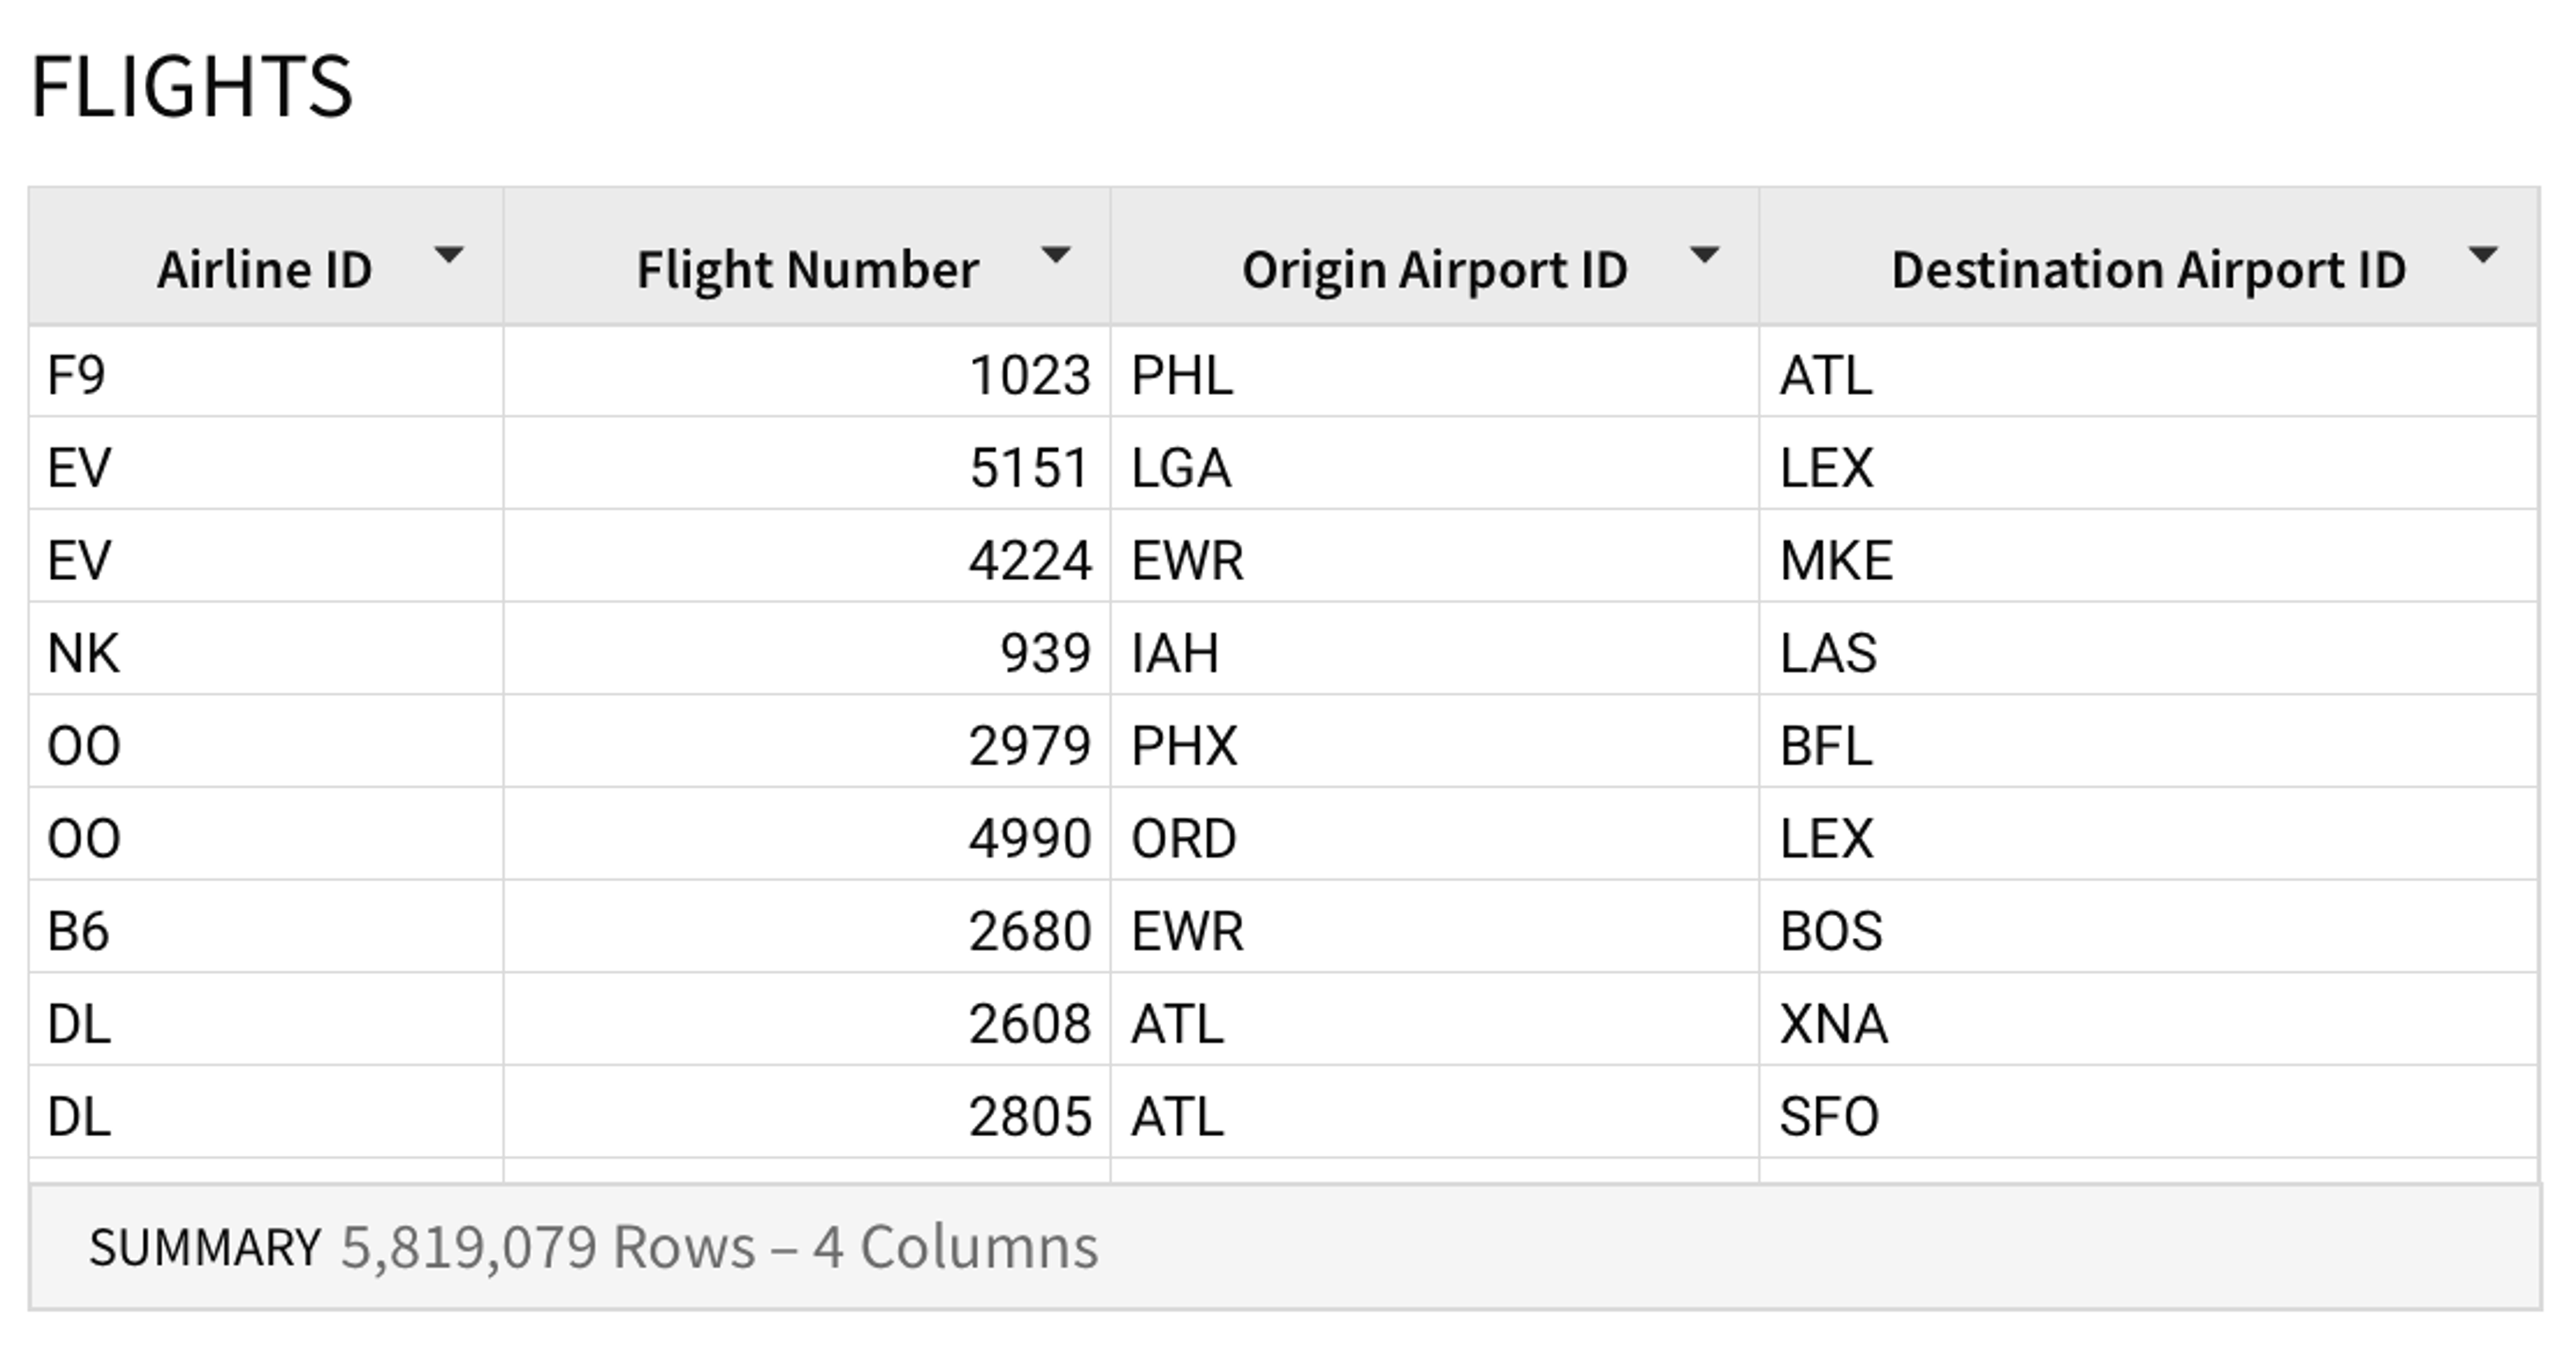
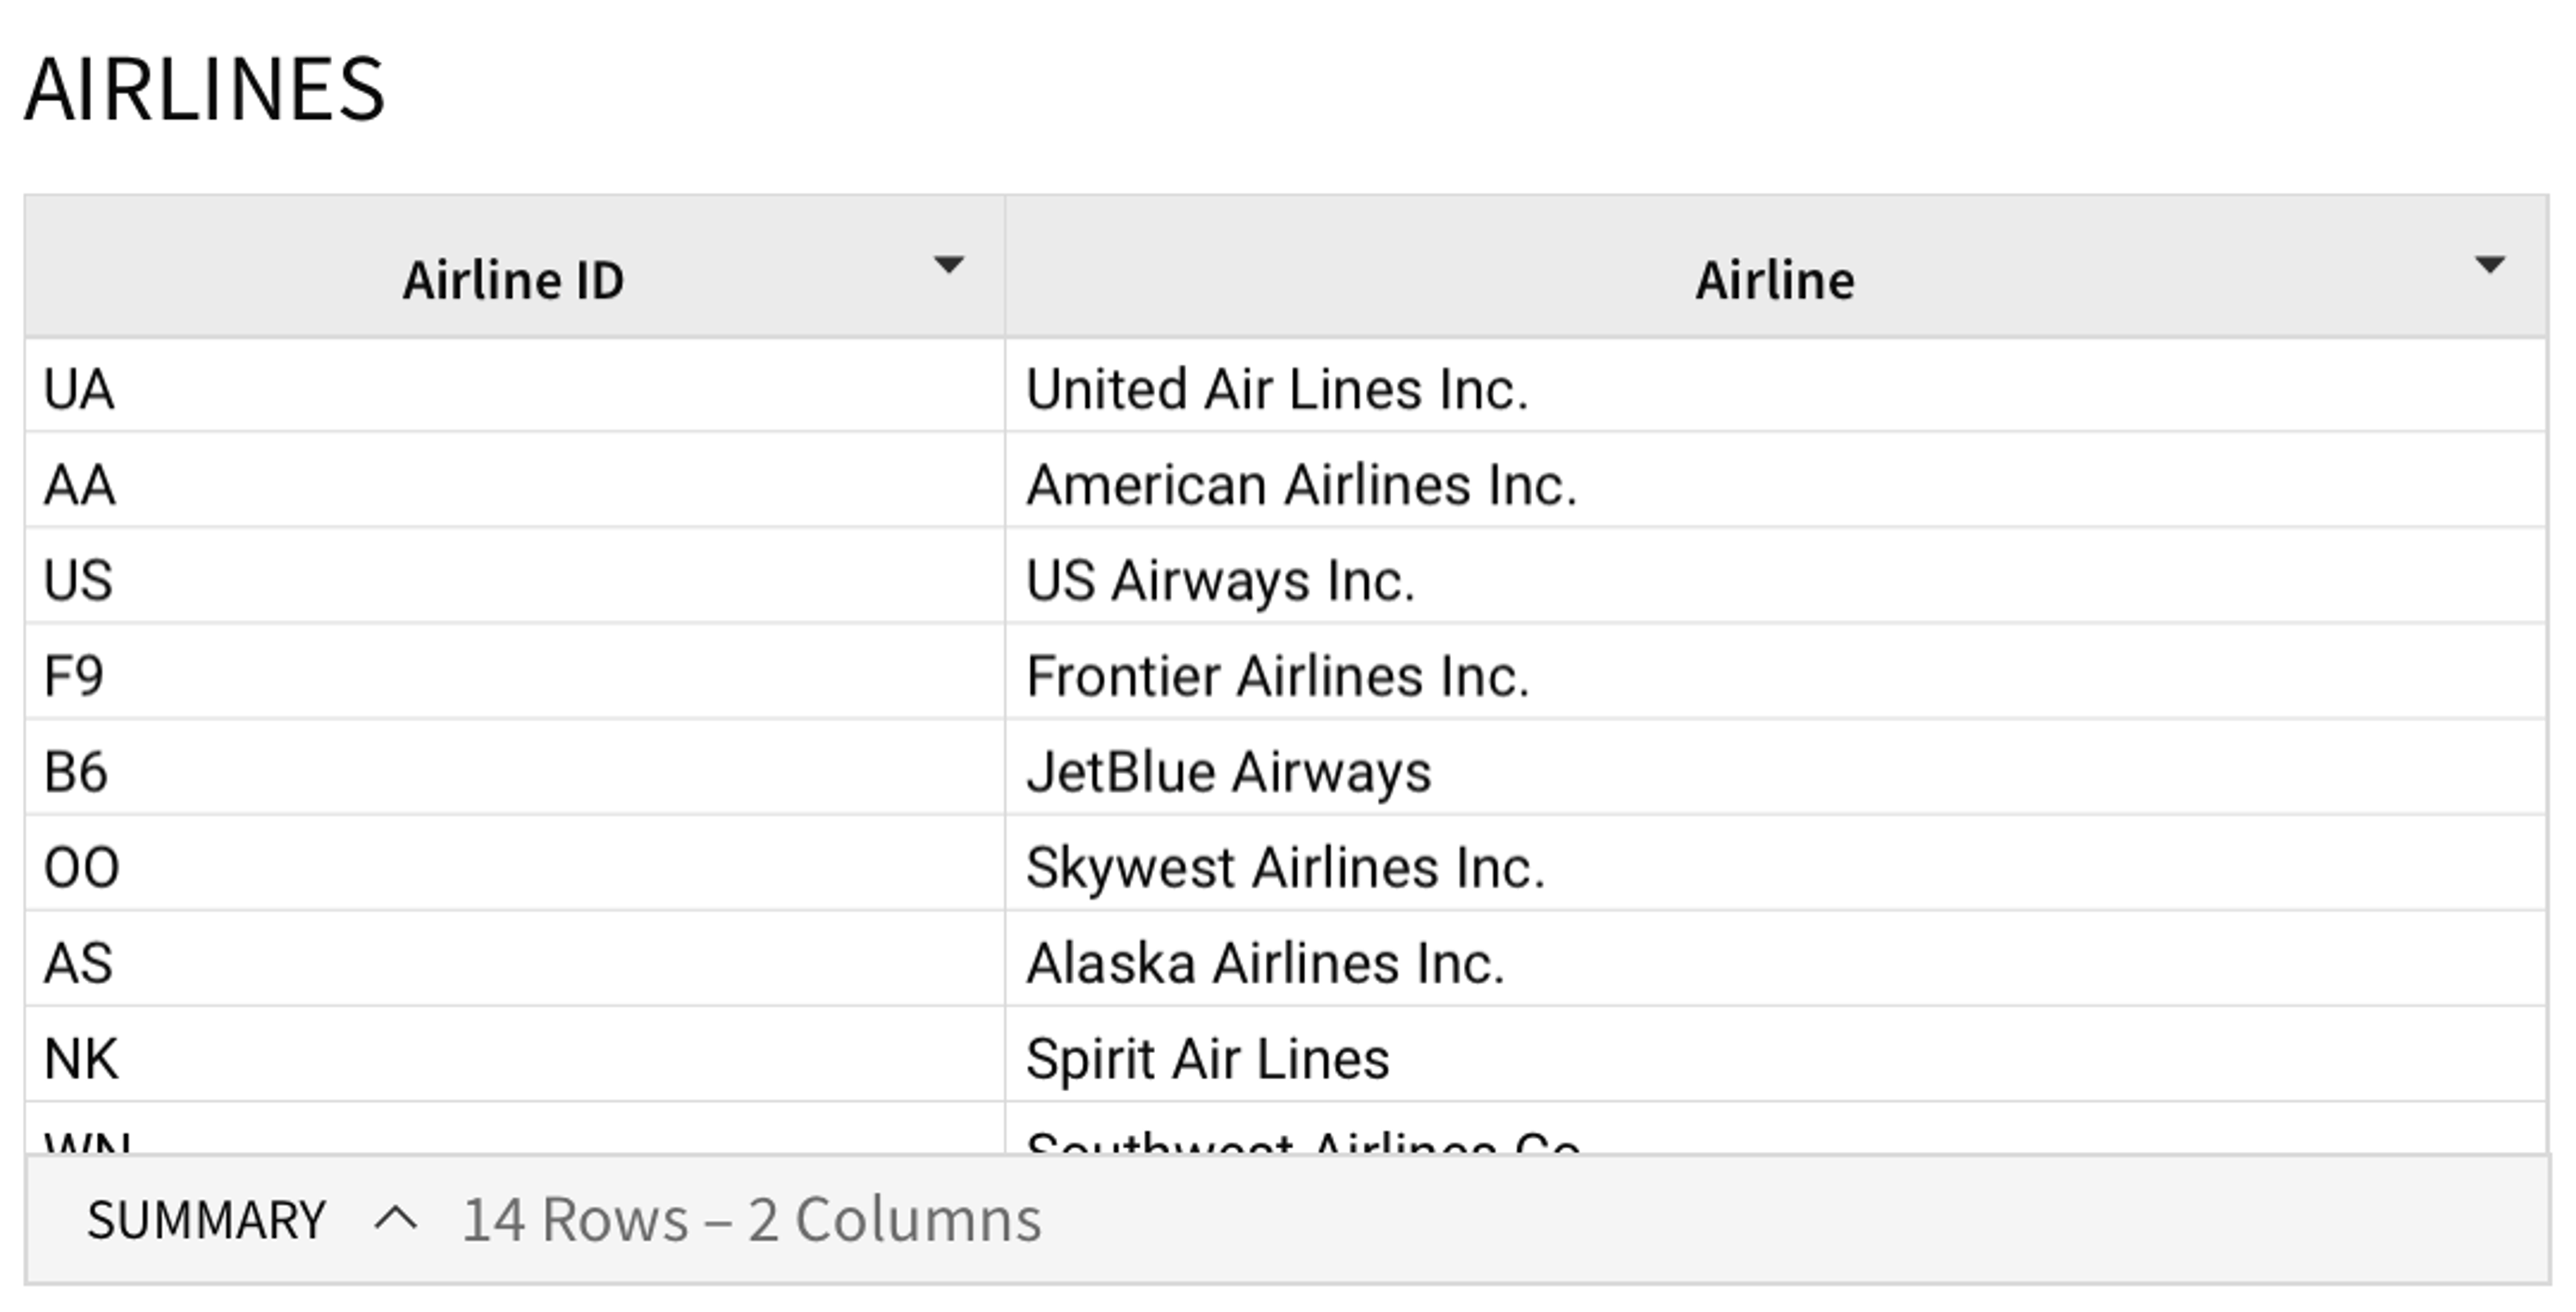
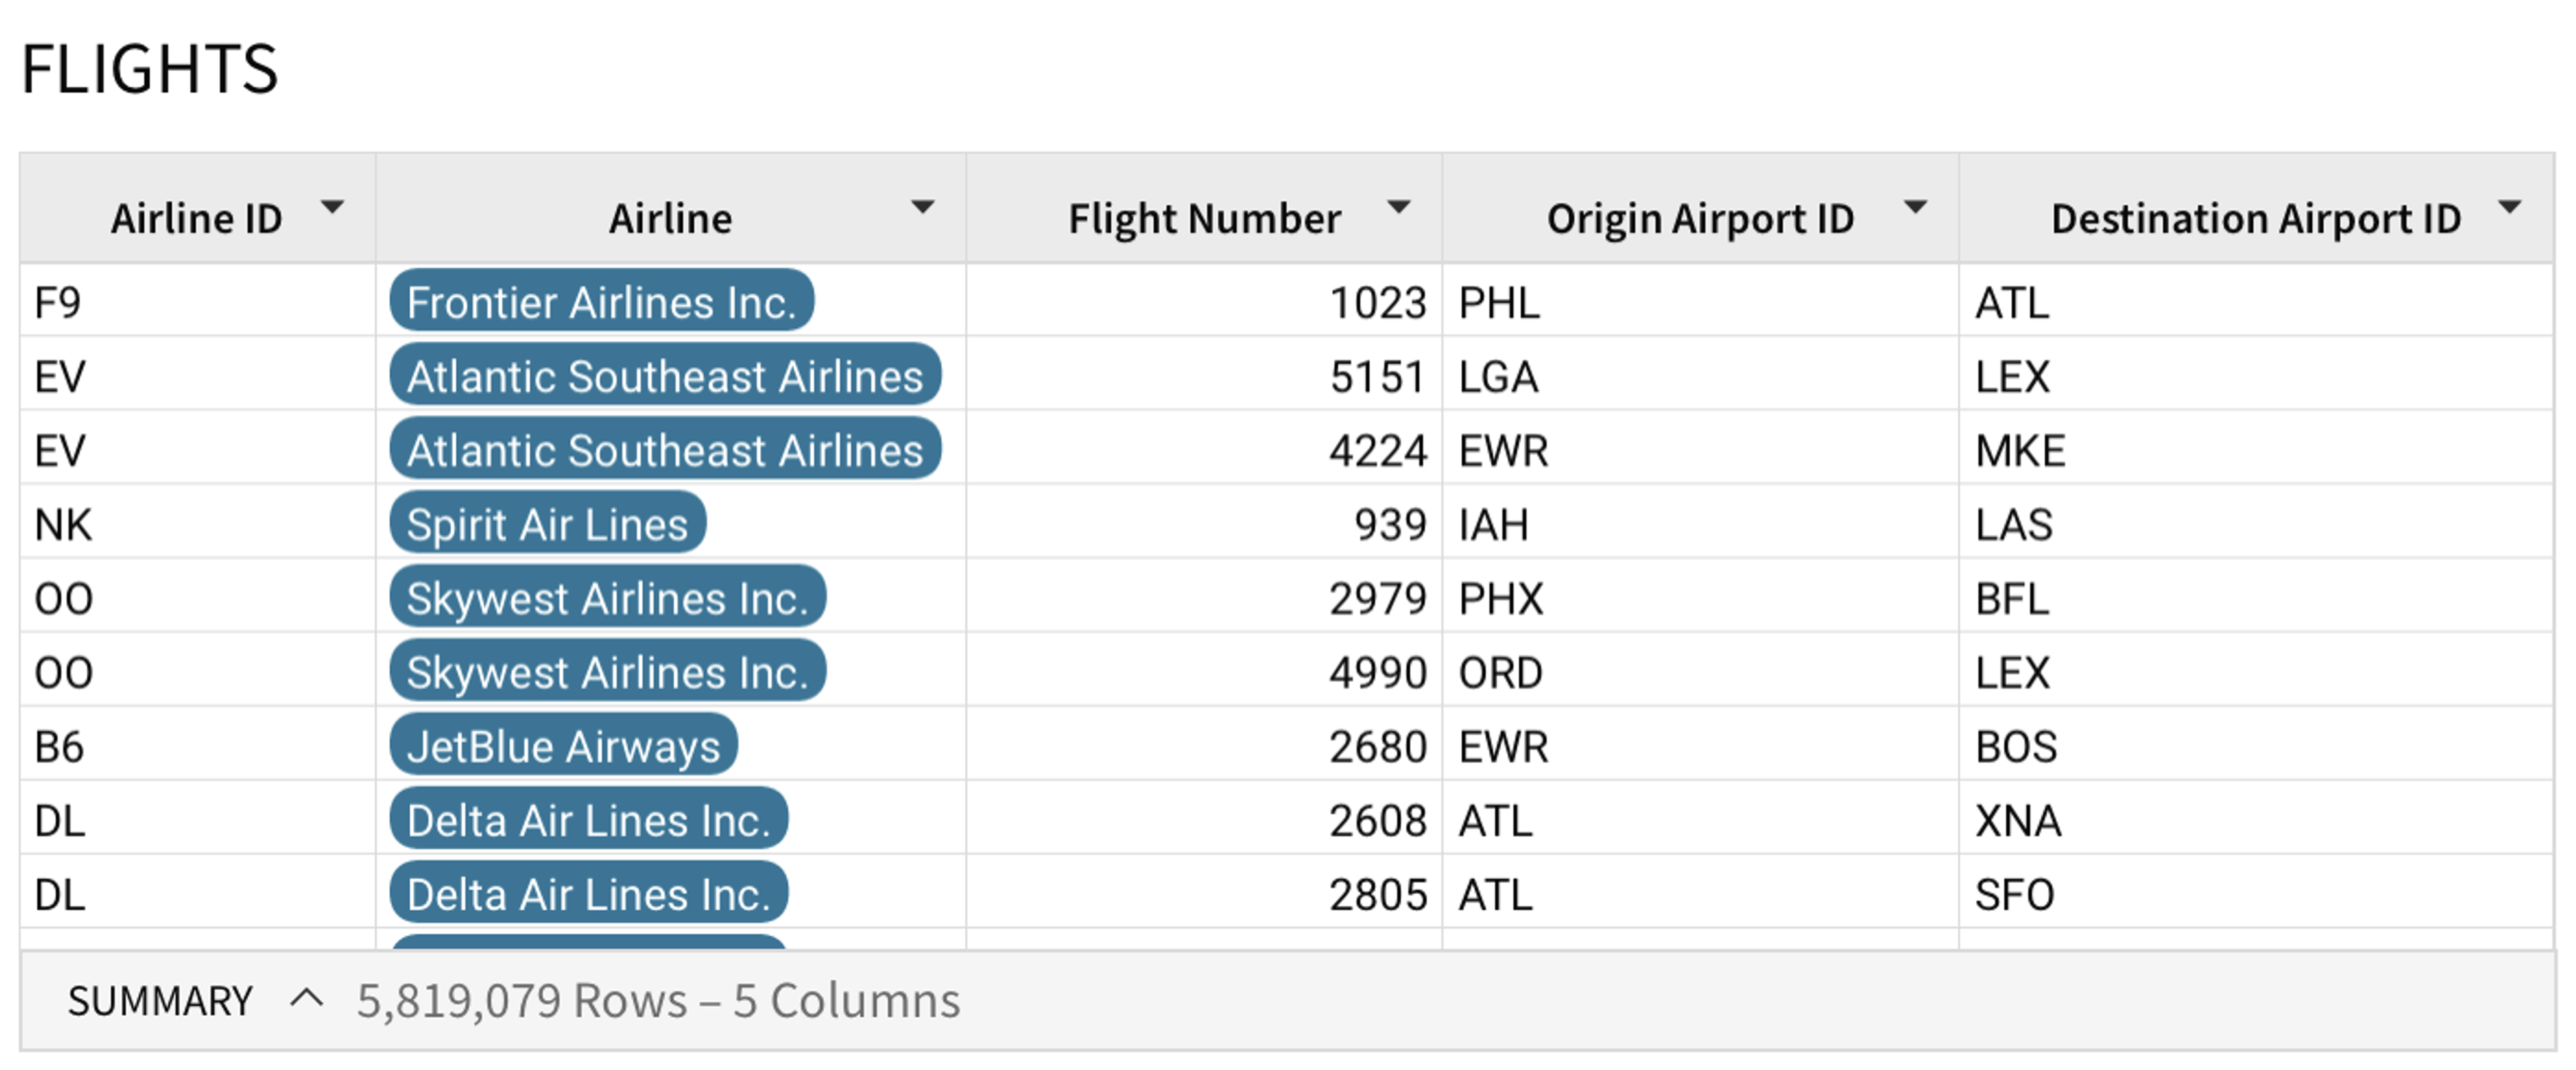
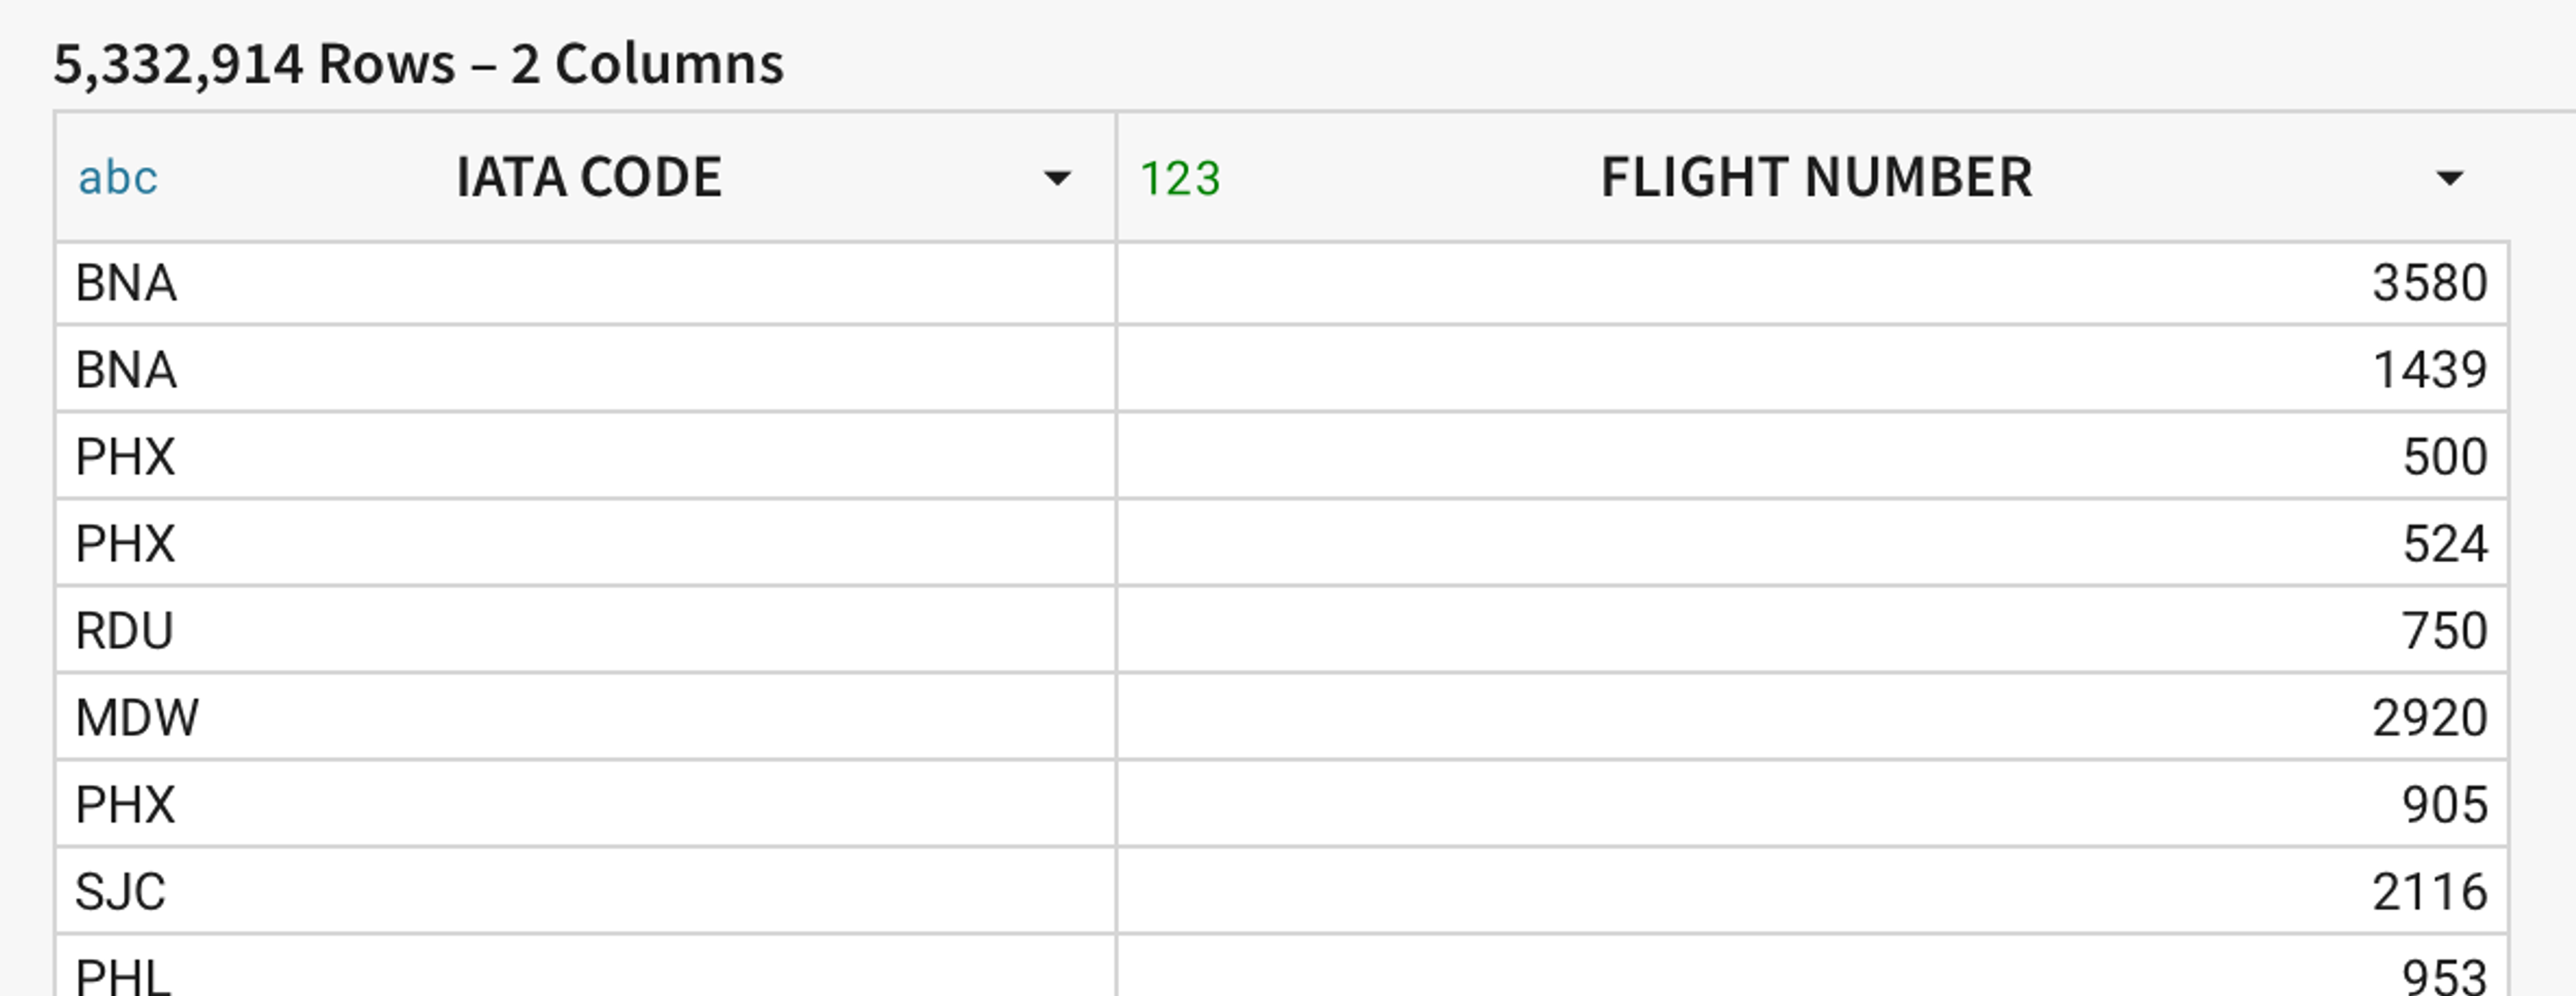
First off, a straightforward use case: you have data in a table that you want to enrich with data from another table. As a concrete example, let’s say you have a table of all commercial flights in the United States for 2020 that looks like this:
Lookup([AIRLINES/Airline], [Airline ID], [AIRLINES/Airline ID])
Which gives us:
The same syntax allows you to lookup single values of data, instead of operating on an entire table:
Lookup([AIRLINES/Airline], “UA”, [AIRLINES/Airline ID])

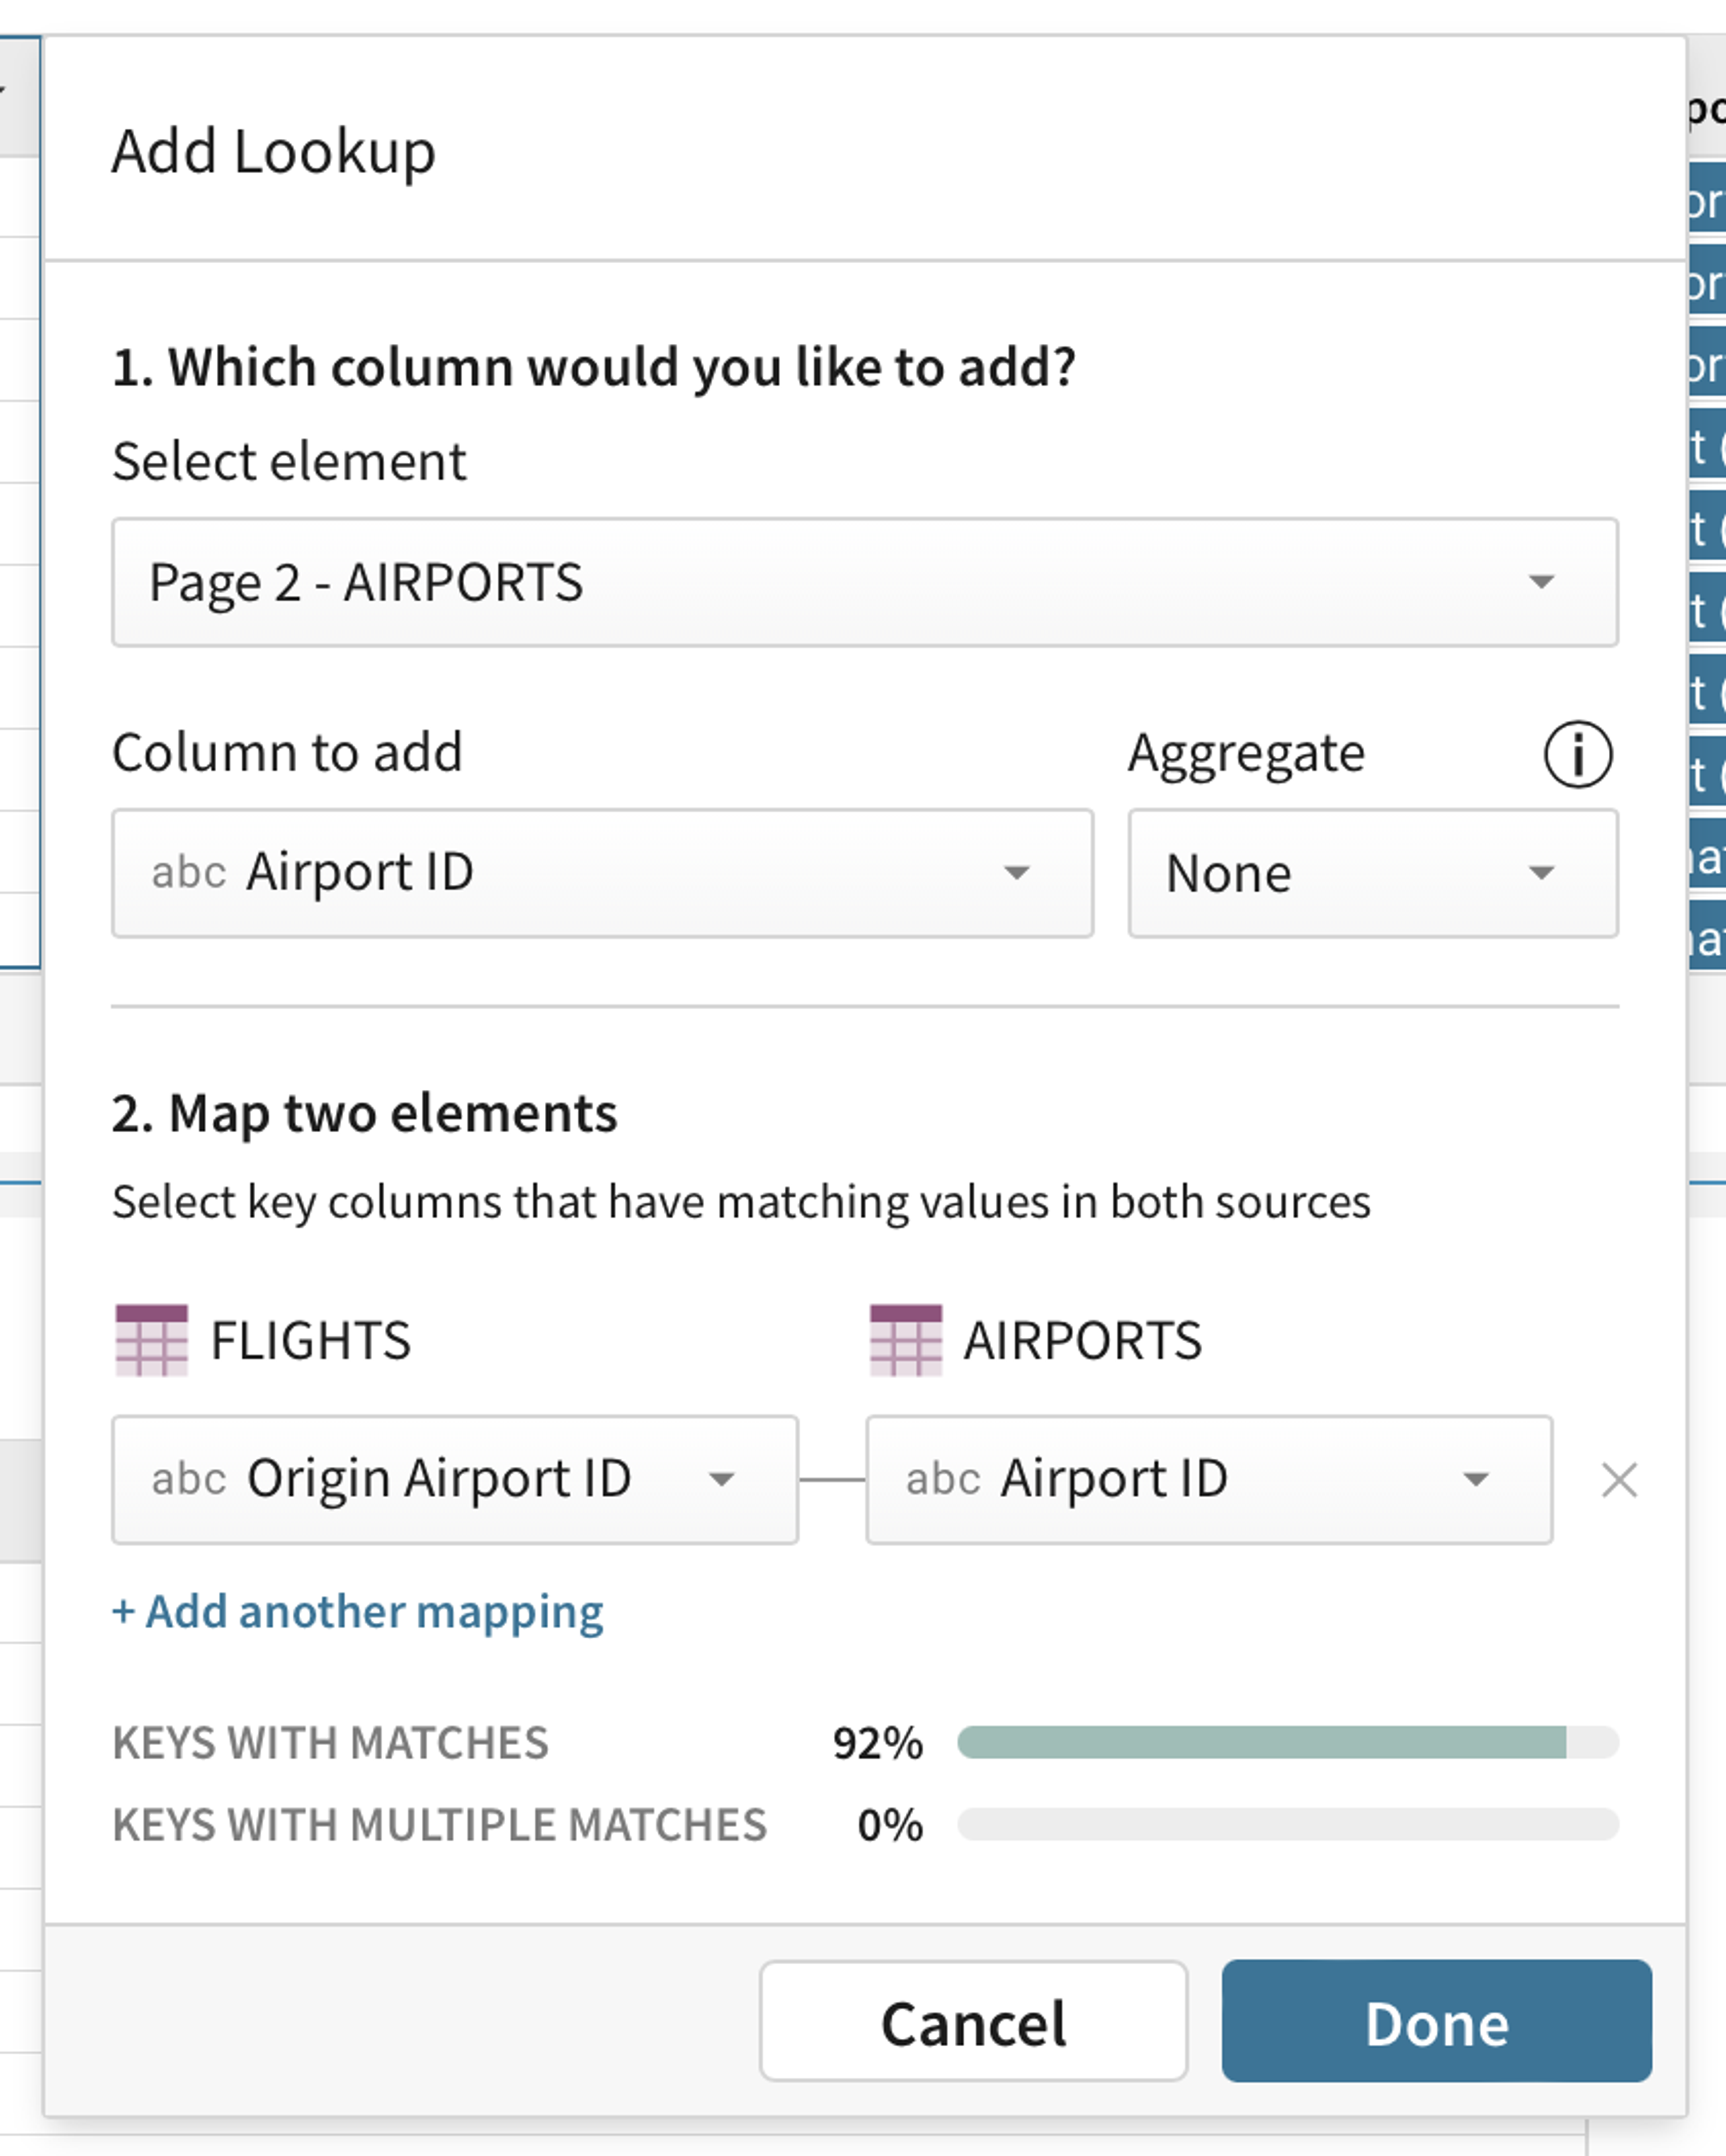
To make things even easier, in most situations, users don’t have to write a formula by hand at all. The friendly lookup modal can help construct lookups with just a few clicks. We put in a lot of effort into the modal to help users navigate the inherent complexity of modeling a join. For example, we automatically suggest keys for the lookup in the modal based on shared column names in the related tables. Moreover, to make sure you have got it right, we precompute the percentage of matching keys to give you a sense for how sparse or dense your lookup will be.
If you are familiar with VLOOKUPs in Excel, you will recognize that Sigma’s Lookup function solves similar problems, i.e. allowing you to do row by row, one-to-one lookups. In SQL terms, we are essentially performing a LEFT JOIN.
However, things get a little more complicated when there are multiple matches for a row in your related table. Excel’s VLOOKUP will return the first match it finds in the search range. In SQL, every extra match will end up getting returned, adding rows to the table and expanding the cardinality of the result set.
Both VLOOKUP and LEFT JOIN have their own tradeoffs when operating on related tables with multiple matches. VLOOKUP does something that works most of the time, but it doesn’t offer users flexibility to do aggregations on the multiple matches. In fact, Excel doesn’t even let users know that there are multiple matches. Excel’s solution is pivot tables, a completely different toolset and user experience.
JOINs are super powerful, and you can write arbitrarily complex queries to decide how you want to deal with multiple matches. The expressibility comes at a cost: it’s not straightforward to write a SQL query that aggregates data using the correct grouping and join keys. Frankly, the flexibility comes at the cost of complexity the most business users aren’t interested in grappling with. It’s certainly not conducive to the kind of ad-hoc analyses that are key to modern, exploratory workflows.
We have sought to solve both sets of drawbacks with Rollup, a flavor of Lookup that can perform aggregations on matching data using the same formula language. Let’s dive into some use cases that Rollups solve!
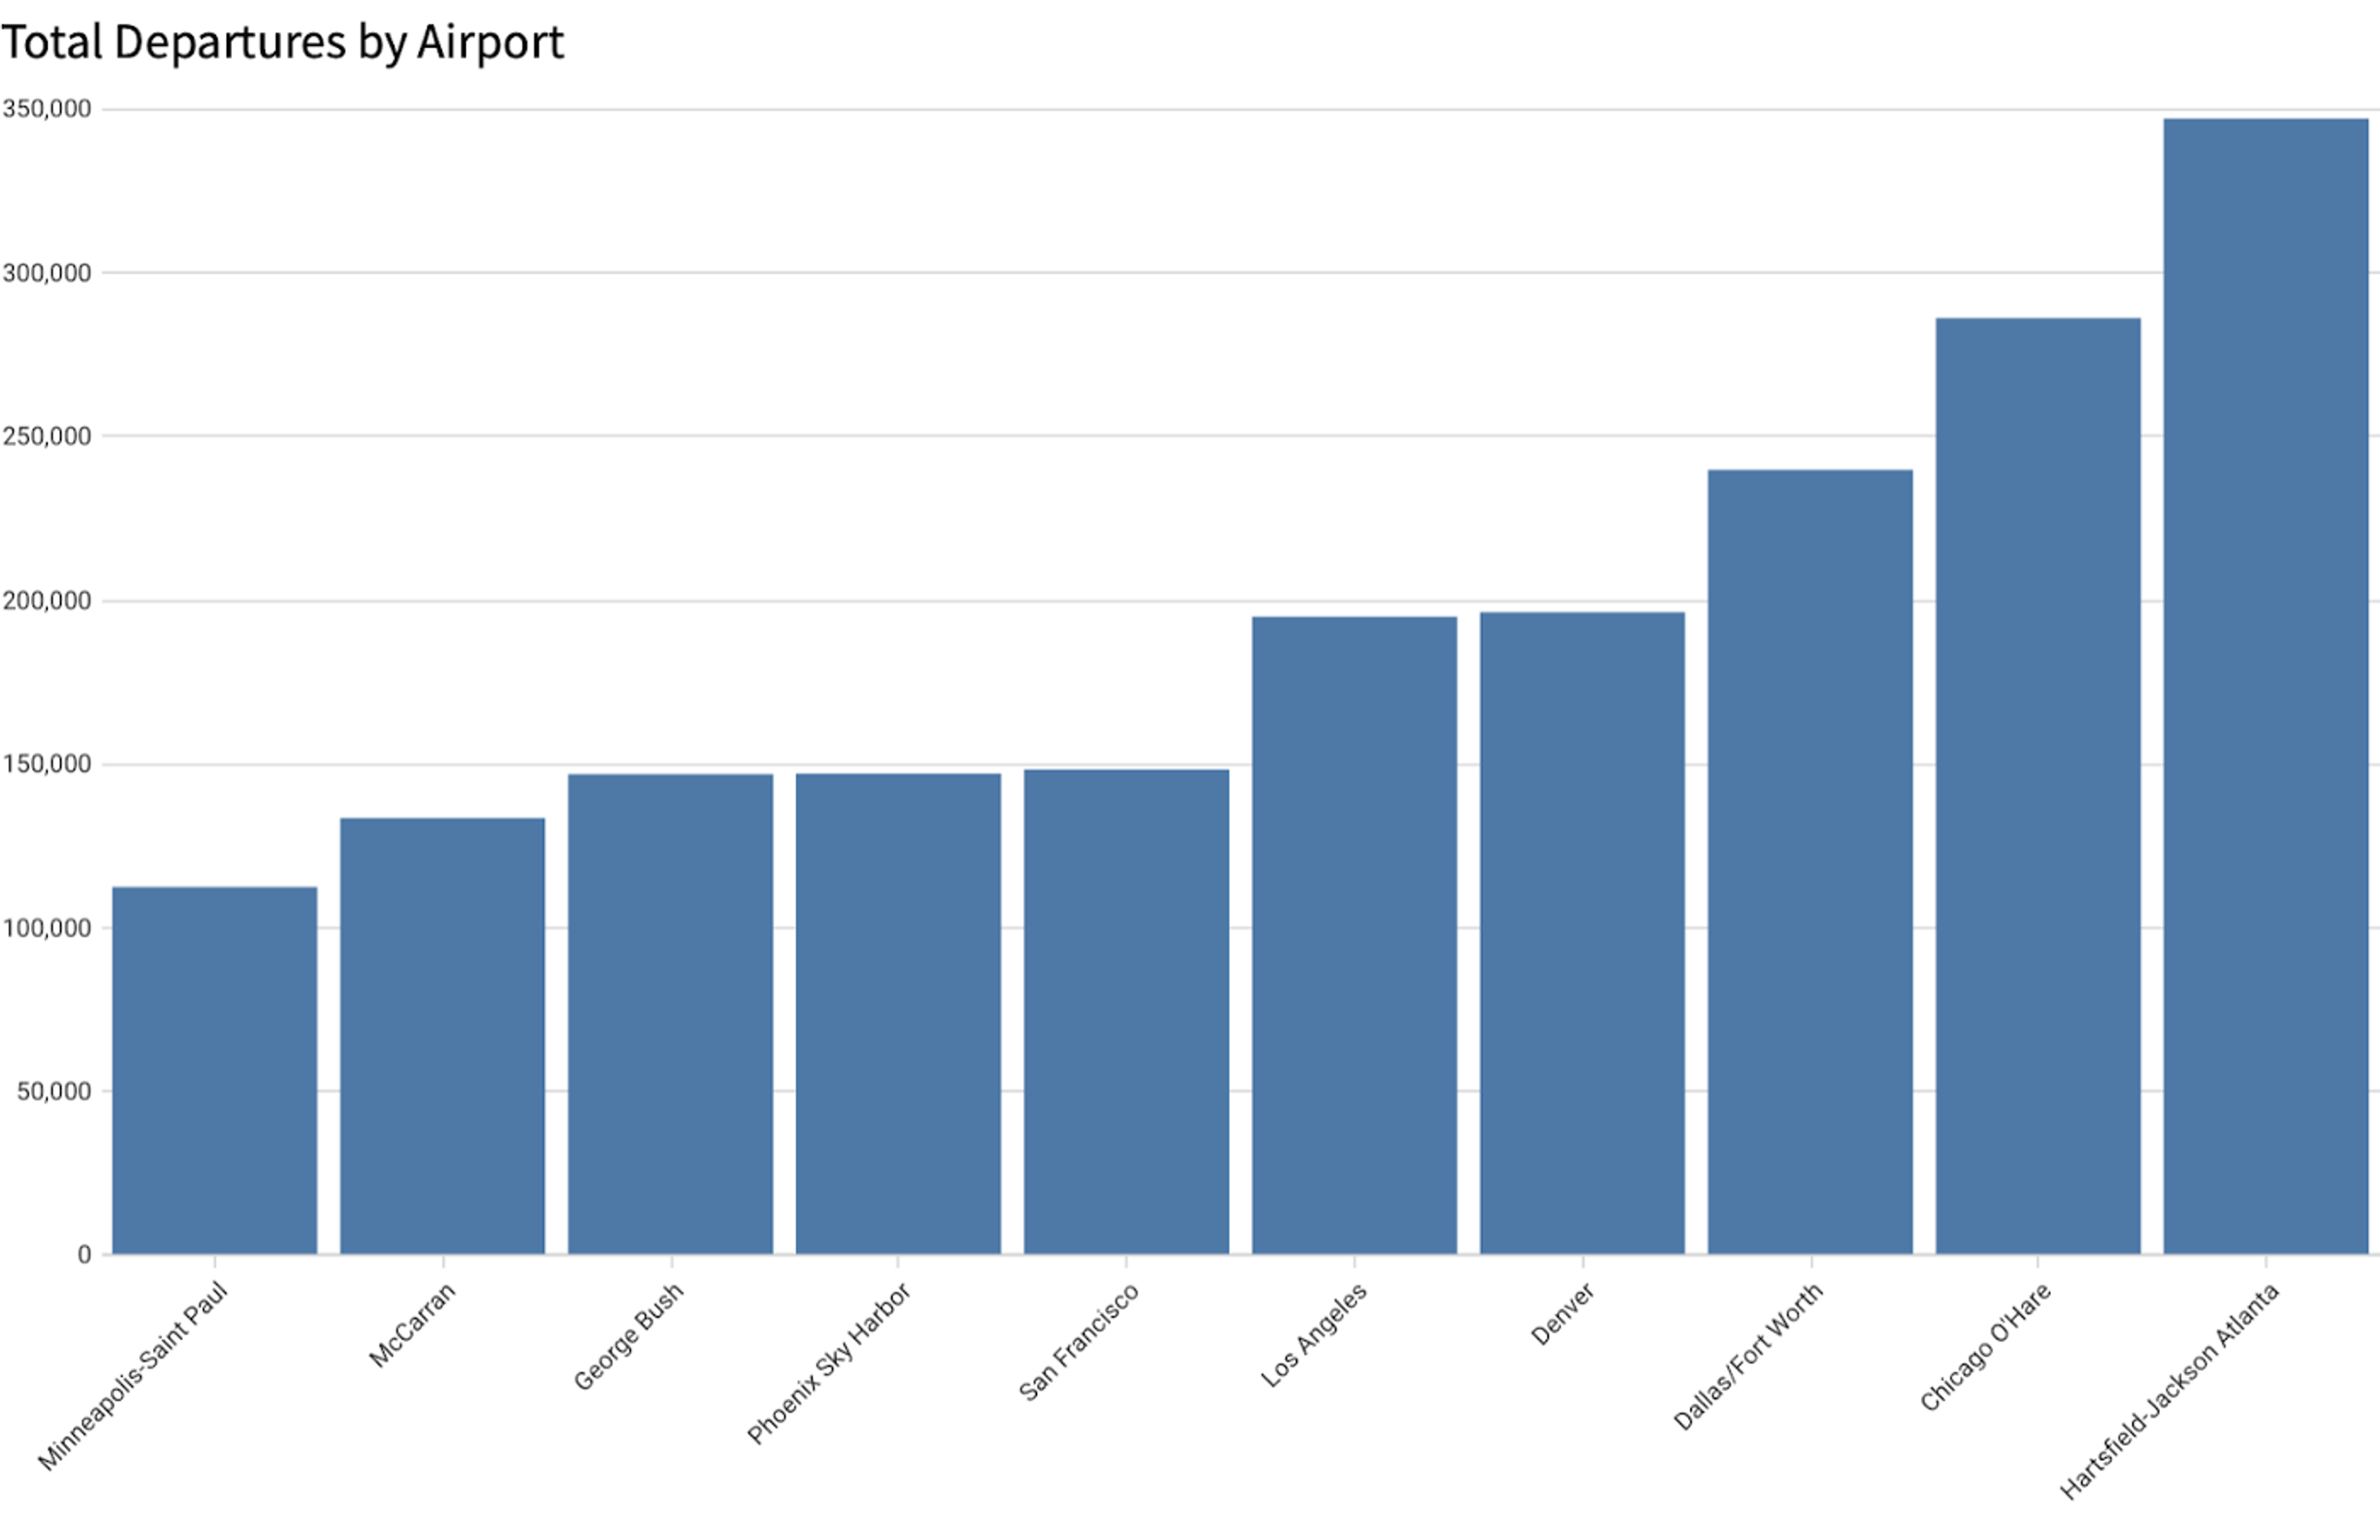
We will continue to work with our FLIGHTS and AIRPORTS table. Let’s say you wanted to look at a quick chart of the top 10 busiest airports. You could use a rollup formula as your y axis:
Rollup(Count([FLIGHTS/Flight Number]), [Iata Code], [FLIGHTS/Destination Airport ID])
This returns the number of flights per airport, performing a count on the matching rows.
with seq as ( select SEQ4() s, ROW_NUMBER() over (order by s) rn from table(GENERATOR(ROWCOUNT => 1000000)) v) selectDATE_TRUNC( minute,DATEADD(minute, -( rn - 1 ), current_timestamp) ) timestamp from seq
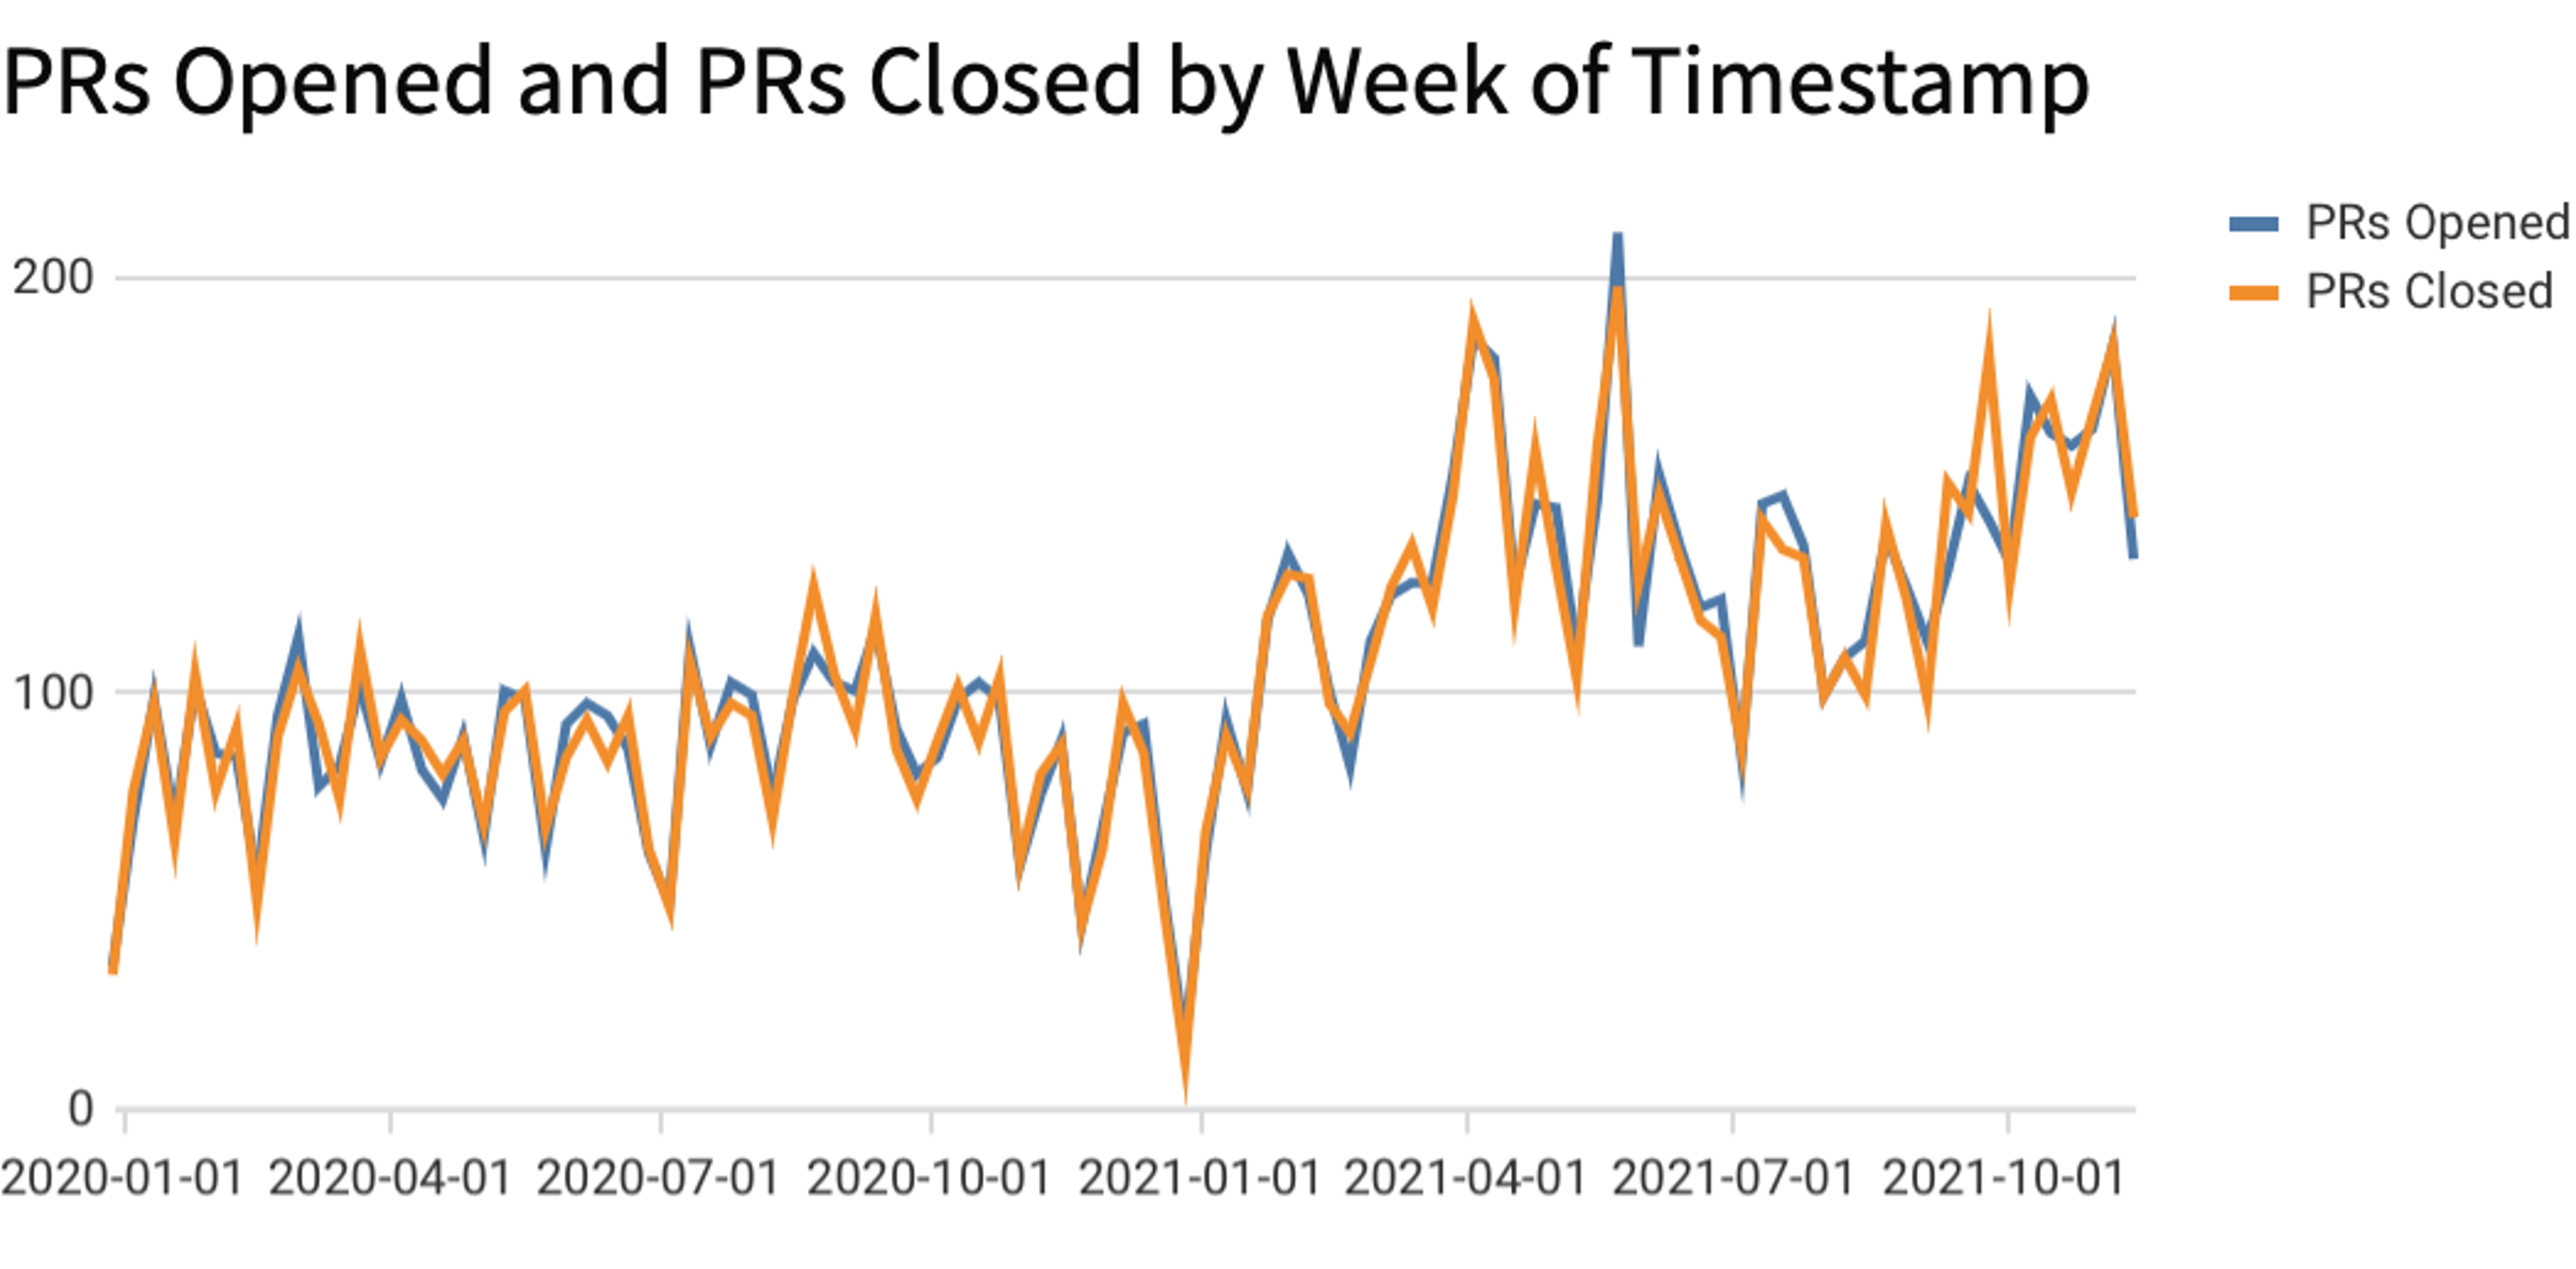
We group this element by DateTrunc(“week”, [Custom SQL/TIMESTAMP]).
Then, after bringing in our GitHub data to the workbook, the formula for the y axis of the chart is simply:
Rollup(Count([ISSUE/Number]), [Week of Timestamp], DateTrunc(“week”, [ISSUE/Day of Created At]))
Previously this chart would require two SQL joins (one for each aggregate) to the WEEK column of the timestamp table. In addition, the two joined tables need to be aggregated by week, one by Opened Date and the other by Closed Date. As such, this previously required two Datasets for the aggregations and a Worksheet to perform the SQL JOINs.
With Rollups and Workbooks, all of the above prep work is no longer necessary and the powerful analysis above can be encoded in a simple formula.
How we implemented lookup and rollup
We implemented lookup and rollup to allow end users to perform ad-hoc joins on their data in a live manner. The best vehicle for delivering an ad-hoc experience in Sigma is through our formula language. Moreover, it gives Excel users who are familiar with the VLOOKUP function a familiar entry point to the Sigma equivalent feature. While there is great power in modeled joins as are possible in Sigma Datasets, they require users to interrupt your ad-hoc workflow and potentially wait on a BI team to model the joins for them.
We wanted the Lookup/Rollup functions to be highly expressible and powerful without the added complexity of specifying full SQL joins. An inherent goal with choosing to implement these as functions in the Sigma language was to make sure these were fully composable and reusable with the rest of the Sigma formula language.
Most importantly, we wanted to have an obvious and easy semantics around the cardinality of the result set when using a lookup, especially for users who are not familiar with SQL joins. Let us dig into how we implemented this in the SQL!
Working with the example from earlier in the post, let us say a user performs the following lookup:
Lookup([AIRLINES/Airline], [Airline ID], [AIRLINES/Iata Code])
Roughly speaking, this is what the generated SQL could look like:
select FLIGHT_NUMBER, AIRLINE, NAMEfrom EXAMPLES.FAA.FLIGHTS FLIGHTS left join ( select AIRLINE as NAME, IATA_CODE from EXAMPLES.FAA.AIRLINES ) AIRLINES on FLIGHTS.AIRLINE = AIRLINES.IATA_CODE;
This SQL is obvious and correct. We get back data from the flights table with the airline codes mapped to the airline names. This SQL works because there is a one-to-one relationship between the airline’s IATA code and its name (things would be very confusing if it weren’t).
What happens if we are working with a one-to-many relationship? For example, let’s say a user wants to lookup all the flights departing from a given airport.
Lookup([FLIGHTS/Flight Number], [Iata Code], [FLIGHTS/Destination Airport ID])
The SQL for this could look like:
select FLIGHT_NUMBER, IATA_CODEfrom EXAMPLES.FAA.FLIGHTS AIRPORTS left join ( select FLIGHT_NUMBER, DESTINATION_AIRPORT_ID from EXAMPLES.FAA.FLIGHTS ) FLIGHTS on AIRPORTS.IATA_CODE = FLIGHTS.DESTINATION_AIRPORT_ID;
The data from the above query looks like this:
To eliminate this behavior, we could apply a GROUP BY DESTINATION_AIRPORT_ID clause to the join’s target. However, that means the select list of the subquery can no longer contain FLIGHT_NUMBER by itself; it needs to be aggregated. But we are working with a Lookup call that did not specify an aggregate… how do we decide what aggregate to use? Most lookups are done on numbers, perhaps we could use sum? However, the sum of a bunch of flight numbers doesn’t really make sense.
We decided to do something more helpful. If there are multiple distinct matches for the requested attribute in a given group, we show an asterisk. If all of the matches are the same value, we show that value. If there are no matches, since a lookup is always a left join, we show null.
Given all of the above, this is the SQL that Sigma generates for a lookup call:
select AIRLINE "Airline ID", IF_42 "Airline", FLIGHT_NUMBER "Flight Number", ORIGIN_AIRPORT "Origin Airport ID", DESTINATION_AIRPORT "Destination Airport ID", NULL_EQ_40from ( select Q1.AIRLINE AIRLINE, Q1.FLIGHT_NUMBER FLIGHT_NUMBER, Q1.ORIGIN_AIRPORT ORIGIN_AIRPORT, Q1.DESTINATION_AIRPORT DESTINATION_AIRPORT, Q3.NULL_EQ_40 NULL_EQ_40, case when Q3.NULL_EQ_40 then Q3.MAX_41 end IF_42 from ( select * from EXAMPLES.FAA.FLIGHTS FLIGHTS limit 10001 ) Q1 left join ( select IATA_CODE_38, ( min(AIRLINE_39) is not distinct from max(AIRLINE_39) ) NULL_EQ_40, max(AIRLINE_39) MAX_41 from ( select IATA_CODE IATA_CODE_38, AIRLINE AIRLINE_39 from EXAMPLES.FAA.AIRLINES AIRLINES ) Q2 group by IATA_CODE_38 ) Q3 on (Q1.AIRLINE = Q3.IATA_CODE_38) limit 10001 ) Q6
I hope you enjoyed reading our deep dive into lookup/rollup and the SQL that makes it work. I’d like to thank the entire Sigma team for helping invent, design and develop lookups. It takes a village to take a product from ideation to delivery, and I am so proud of our team for making it happen day after day.
If these sorts of product, design and technical challenges interest you, we would love to have you on board. Check out our open positions or visit our careers page for more information!
Let’s Sigma together! Schedule a demo today.