From Spreadsheets to Sigma: 5 Things to Know

So, you're a spreadsheet lover contemplating Sigma for your data analytics needs? You've come to the right place! Sigma provides users in marketing, finance, and sales with a variety of benefits other BI tools and traditional spreadsheets (e.g. Excel and Google Sheets) simply can’t. Yes, Sigma offers a spreadsheet-like interface and the results of analysis can be turned into a wide range of visualizations.
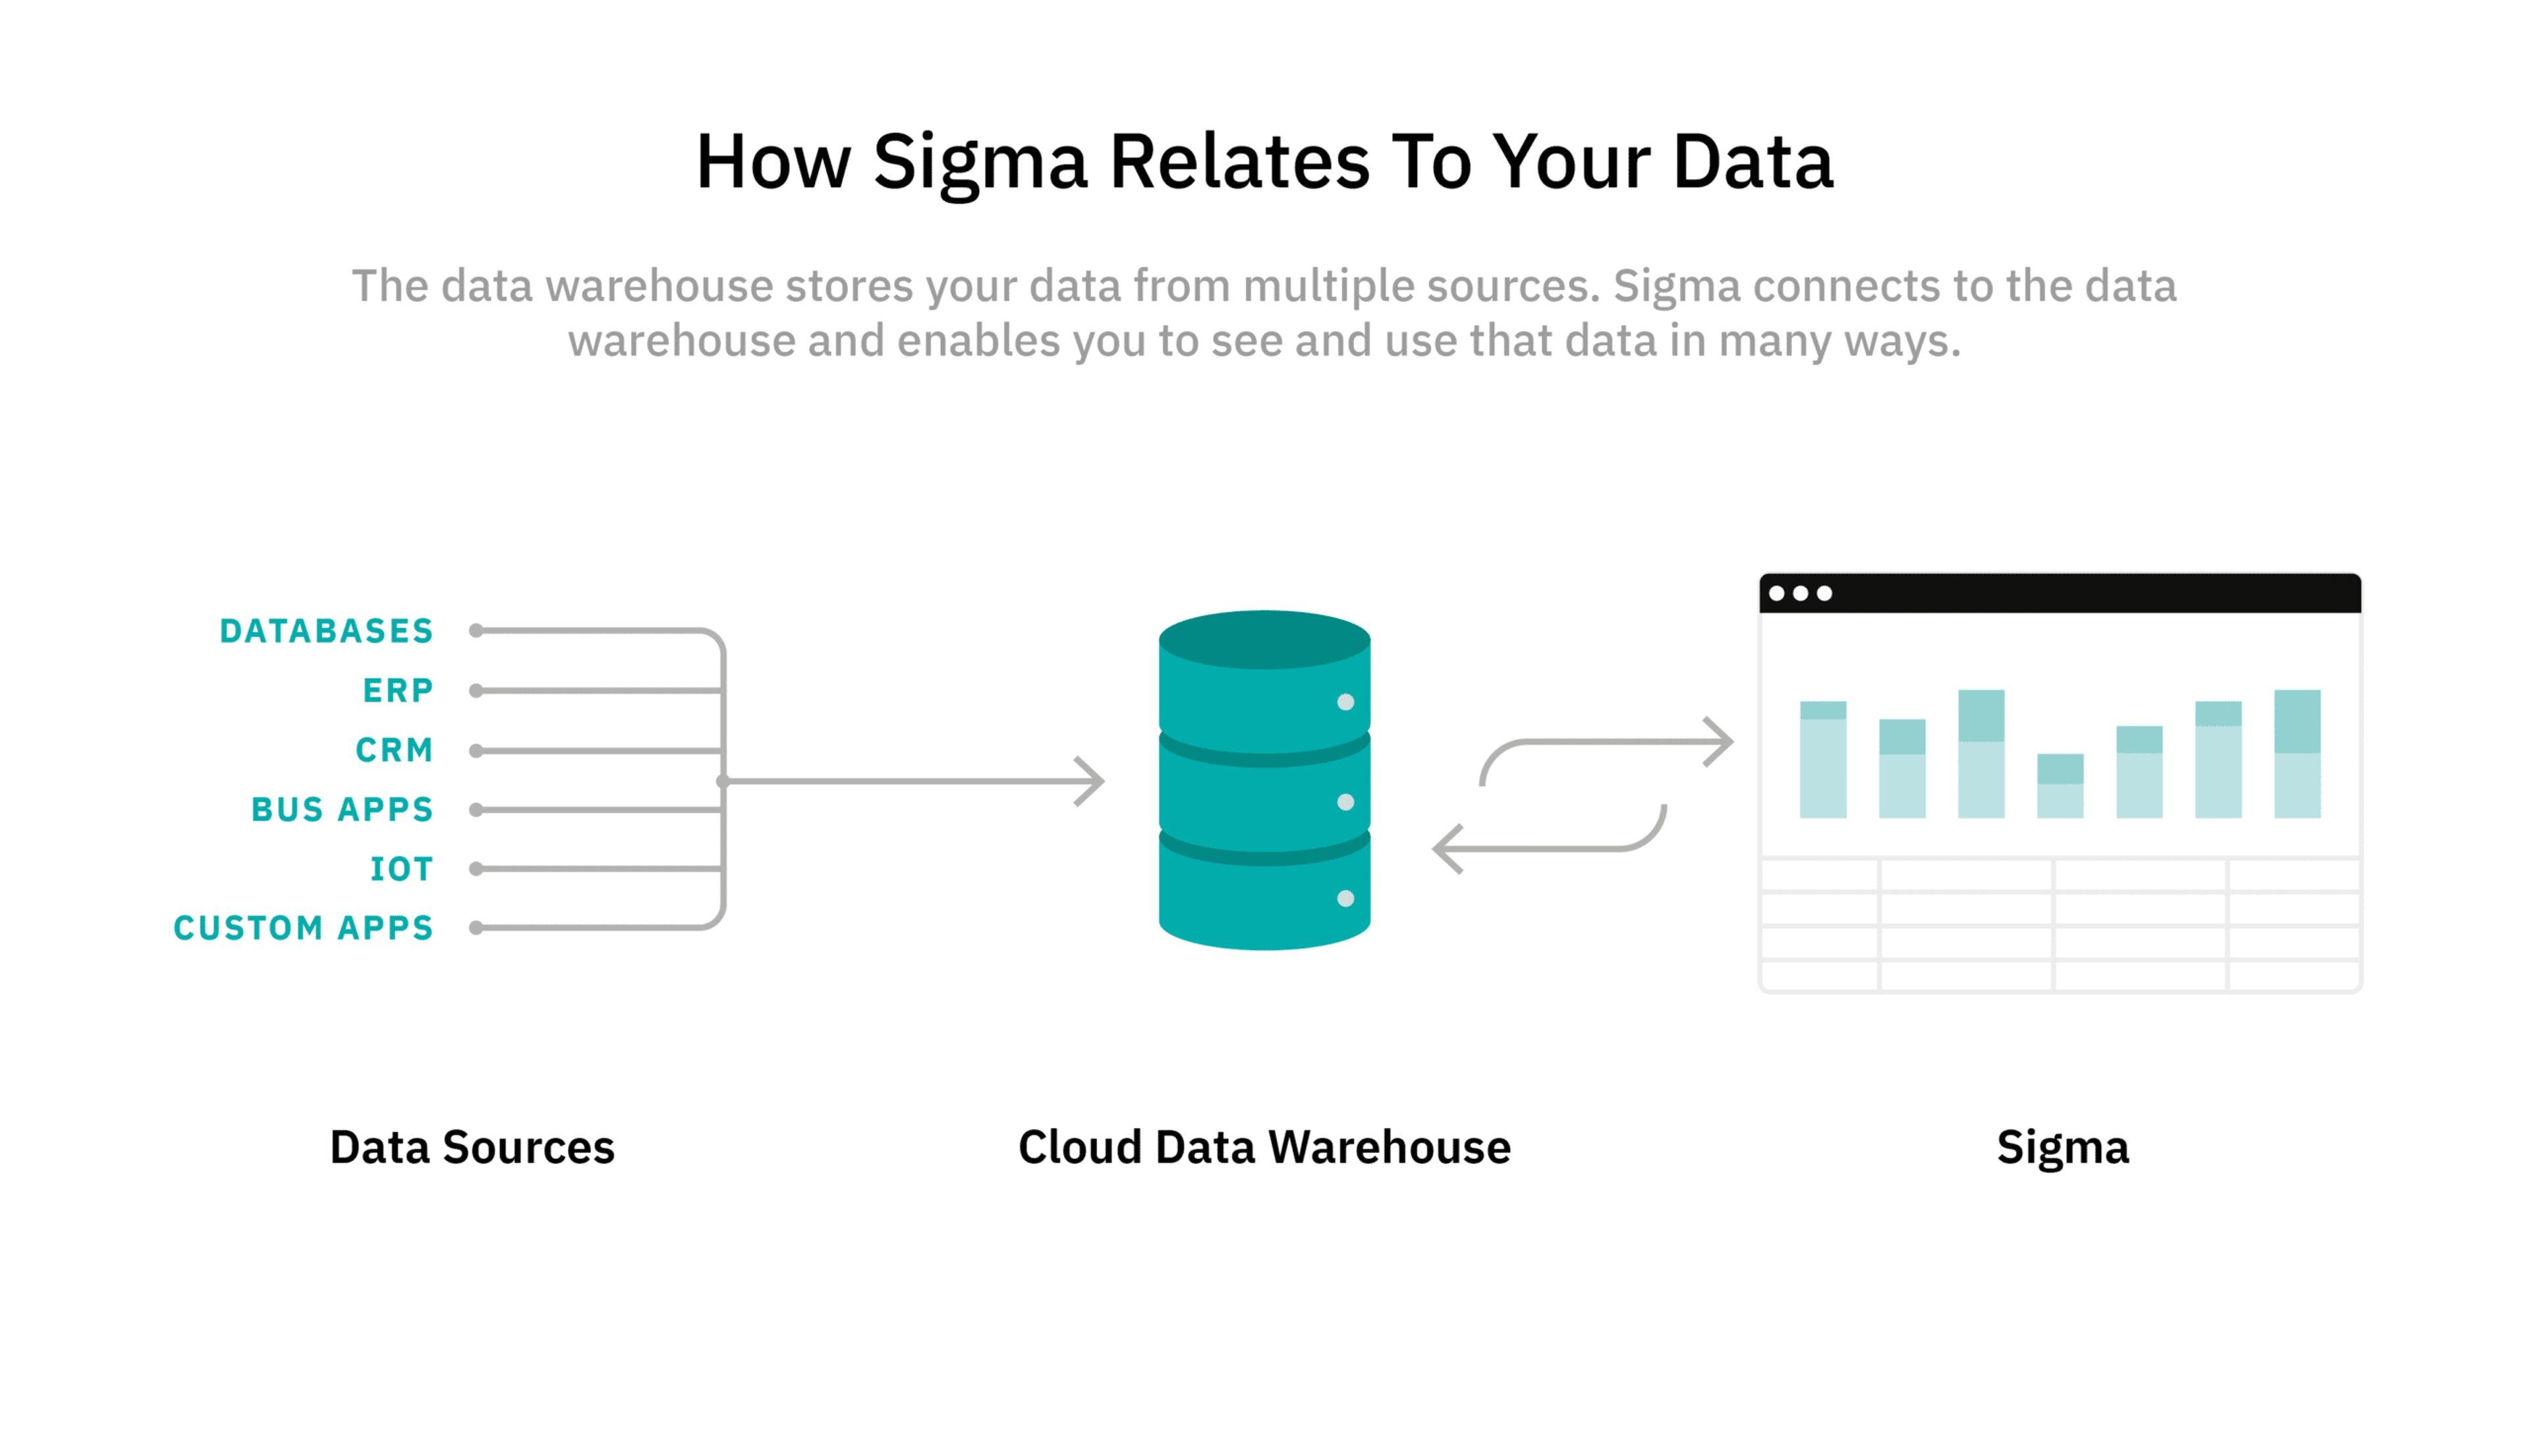
But unlike traditional spreadsheets, Sigma directly connects to all your business data in your organization’s cloud data warehouse and pushes user actions (calculations, filters, sorts, etc.) to the data warehouse for execution. This lets you:
- Have self-service access to all relevant data: You can join, explore and analyze data from all data sources in your organization. No need to go to the data team or owners of specific data sources to get access to data. This is unlike spreadsheets where you might have to manually export data from many data sources and then join them in a single spreadsheet.
- Achieve fast insights across massive data sets: Because Sigma pushes all calculations and queries to the cloud data warehouse for execution, we leverage its near-unlimited scale to quickly return results even against hundreds of billions (yes, billions) of rows of data across many data sources. This is unlike traditional spreadsheets. For example, Microsoft Excel has a hard limit of approximately 1 million rows which may force you to do constrained analytics against summarized or reduced data.
- Reuse, repurpose, and collaborate on live analysis and visualizations: Build data tables, reports, or dashboards once in Sigma, and the data automatically updates against data in the cloud data warehouse. You can also easily share, duplicate, and repurpose analyses without worrying about disturbing others’ work.
Sounds amazing, right? If you’re wondering how to get started, you’re not alone. We’ve worked with leading companies like E.W. Scripps, Volta Charging, and Clover Networks to help them take advantage of Sigma’s intuitive spreadsheet-like interface.
To help you make the transition, here are 5 key differences between Sigma and the traditional spreadsheet, why they matter, and how they work. Let’s dig in!
1. Your Data Is Always Live and Up-to-date
One of the many problems with exporting data to a traditional spreadsheet is that it’s out-of-date the second you create it, causing two problems:
- Teams are left working with different, siloed data sets — some more recent than others.
- Teams must manually recreate or update any recurring or frequently requested reports, or risk making critical decisions based on stale and likely inaccurate insights.
In contrast, Sigma directly queries live data in your company’s cloud data warehouse, which serves as the single source of truth for your business. Data from dozens of sources is automatically updated and reflected in Sigma in real-time, so you can rest assured that you’re always making decisions based on accurate, up-to-the-minute insights – no data exports required!
2. Columns Keep Your Calculations Accurate
Sigma’s spreadsheet-like interface is called a table. It resembles the classic spreadsheet you've been using for most of your life –– but looks can be deceiving.
In traditional spreadsheets, you work in cells, but in a Sigma table, you work in columns. All commands are applied to an entire column using other columns as inputs. This ensures that calculations made in each column are applied to every row –– even when new data is added or updated –– which helps prevent common errors that result from working with large data sets.
Selection errors: A cautionary tale
The advantages of working in columns instead of cells may not be obvious, but trust us, it’s critical! Anyone can make a mistake when working with millions of cells.
In 2010, Harvard released a paper on the effect of debt on market growth. The only problem? The data was incorrect due to a selection error – one of the most common spreadsheet errors. Instead of including all of the data in their calculations, the authors only had a fraction, leading to incorrect conclusions from their analysis.
This example is why Sigma calculations are performed on columns of data instead of individual cells, so you can work with large data sets worry-free!
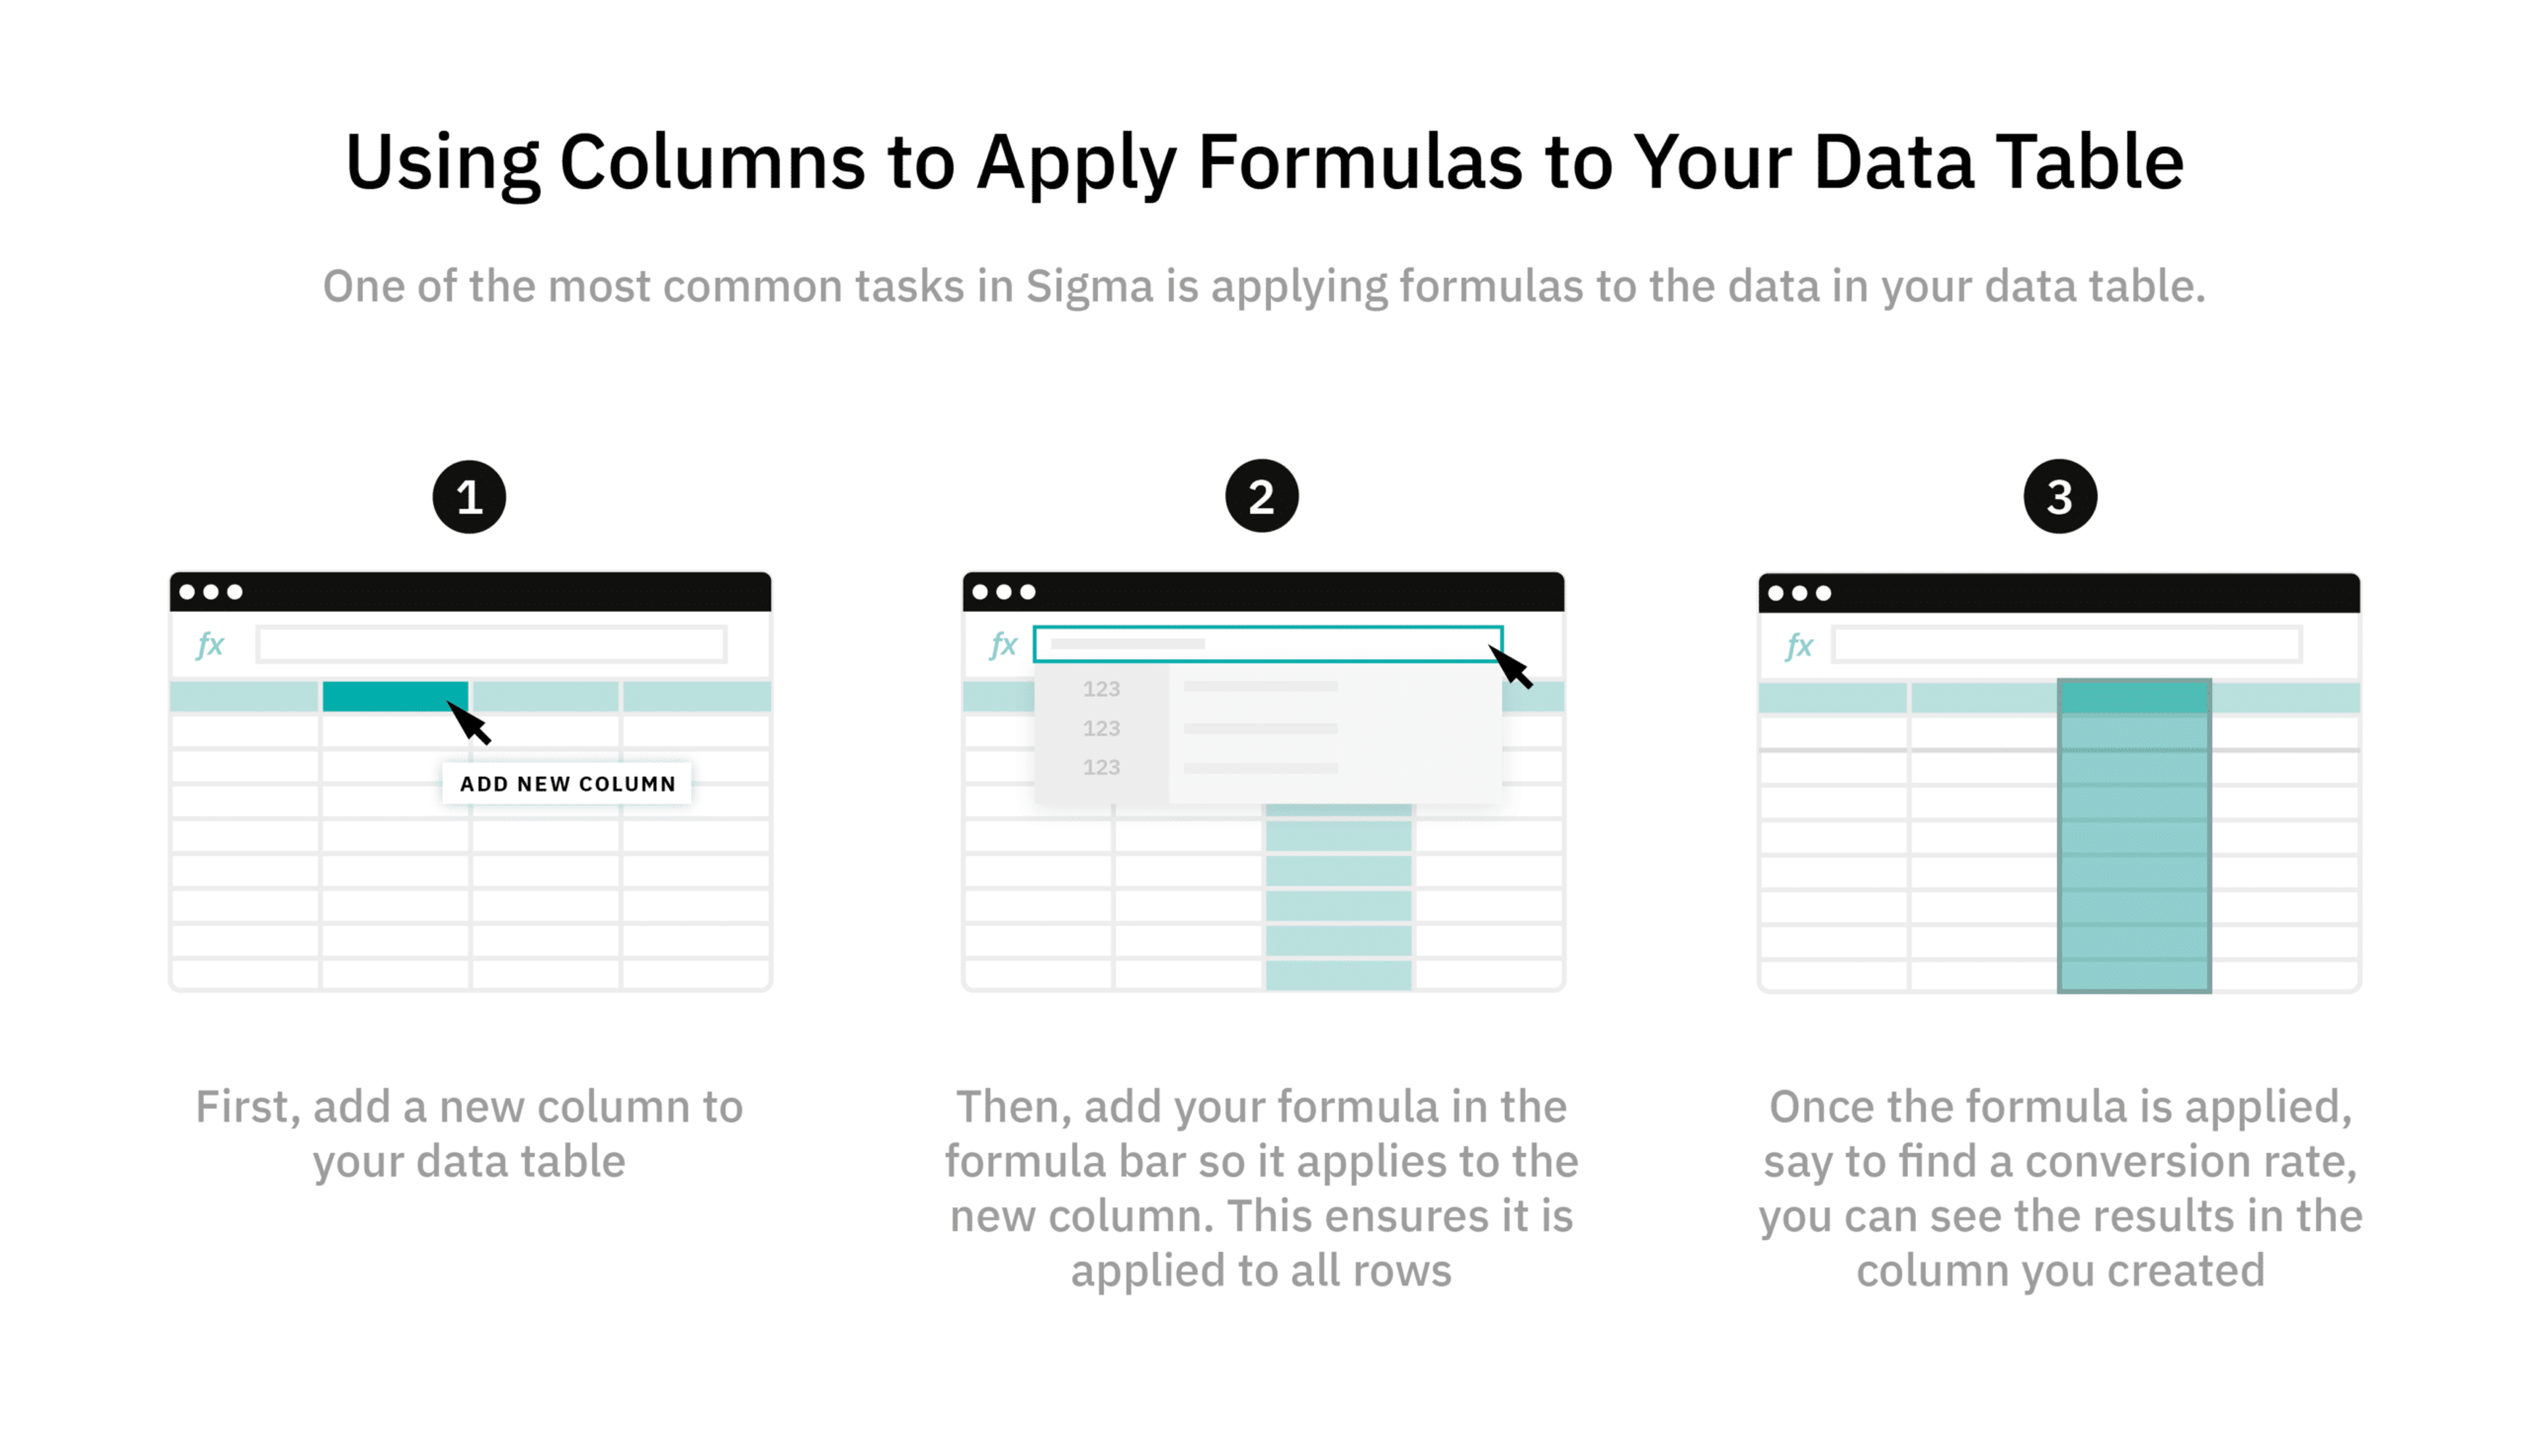
Note: In Sigma, every cell in a column is defined by the same formula. To create a worksheet calculation, simply create a new column and enter the formula into the formula bar. That is why when you click on a cell, you see a formula and not a value.
3. Groups and Groupings Add a New Way to Look at Your Data
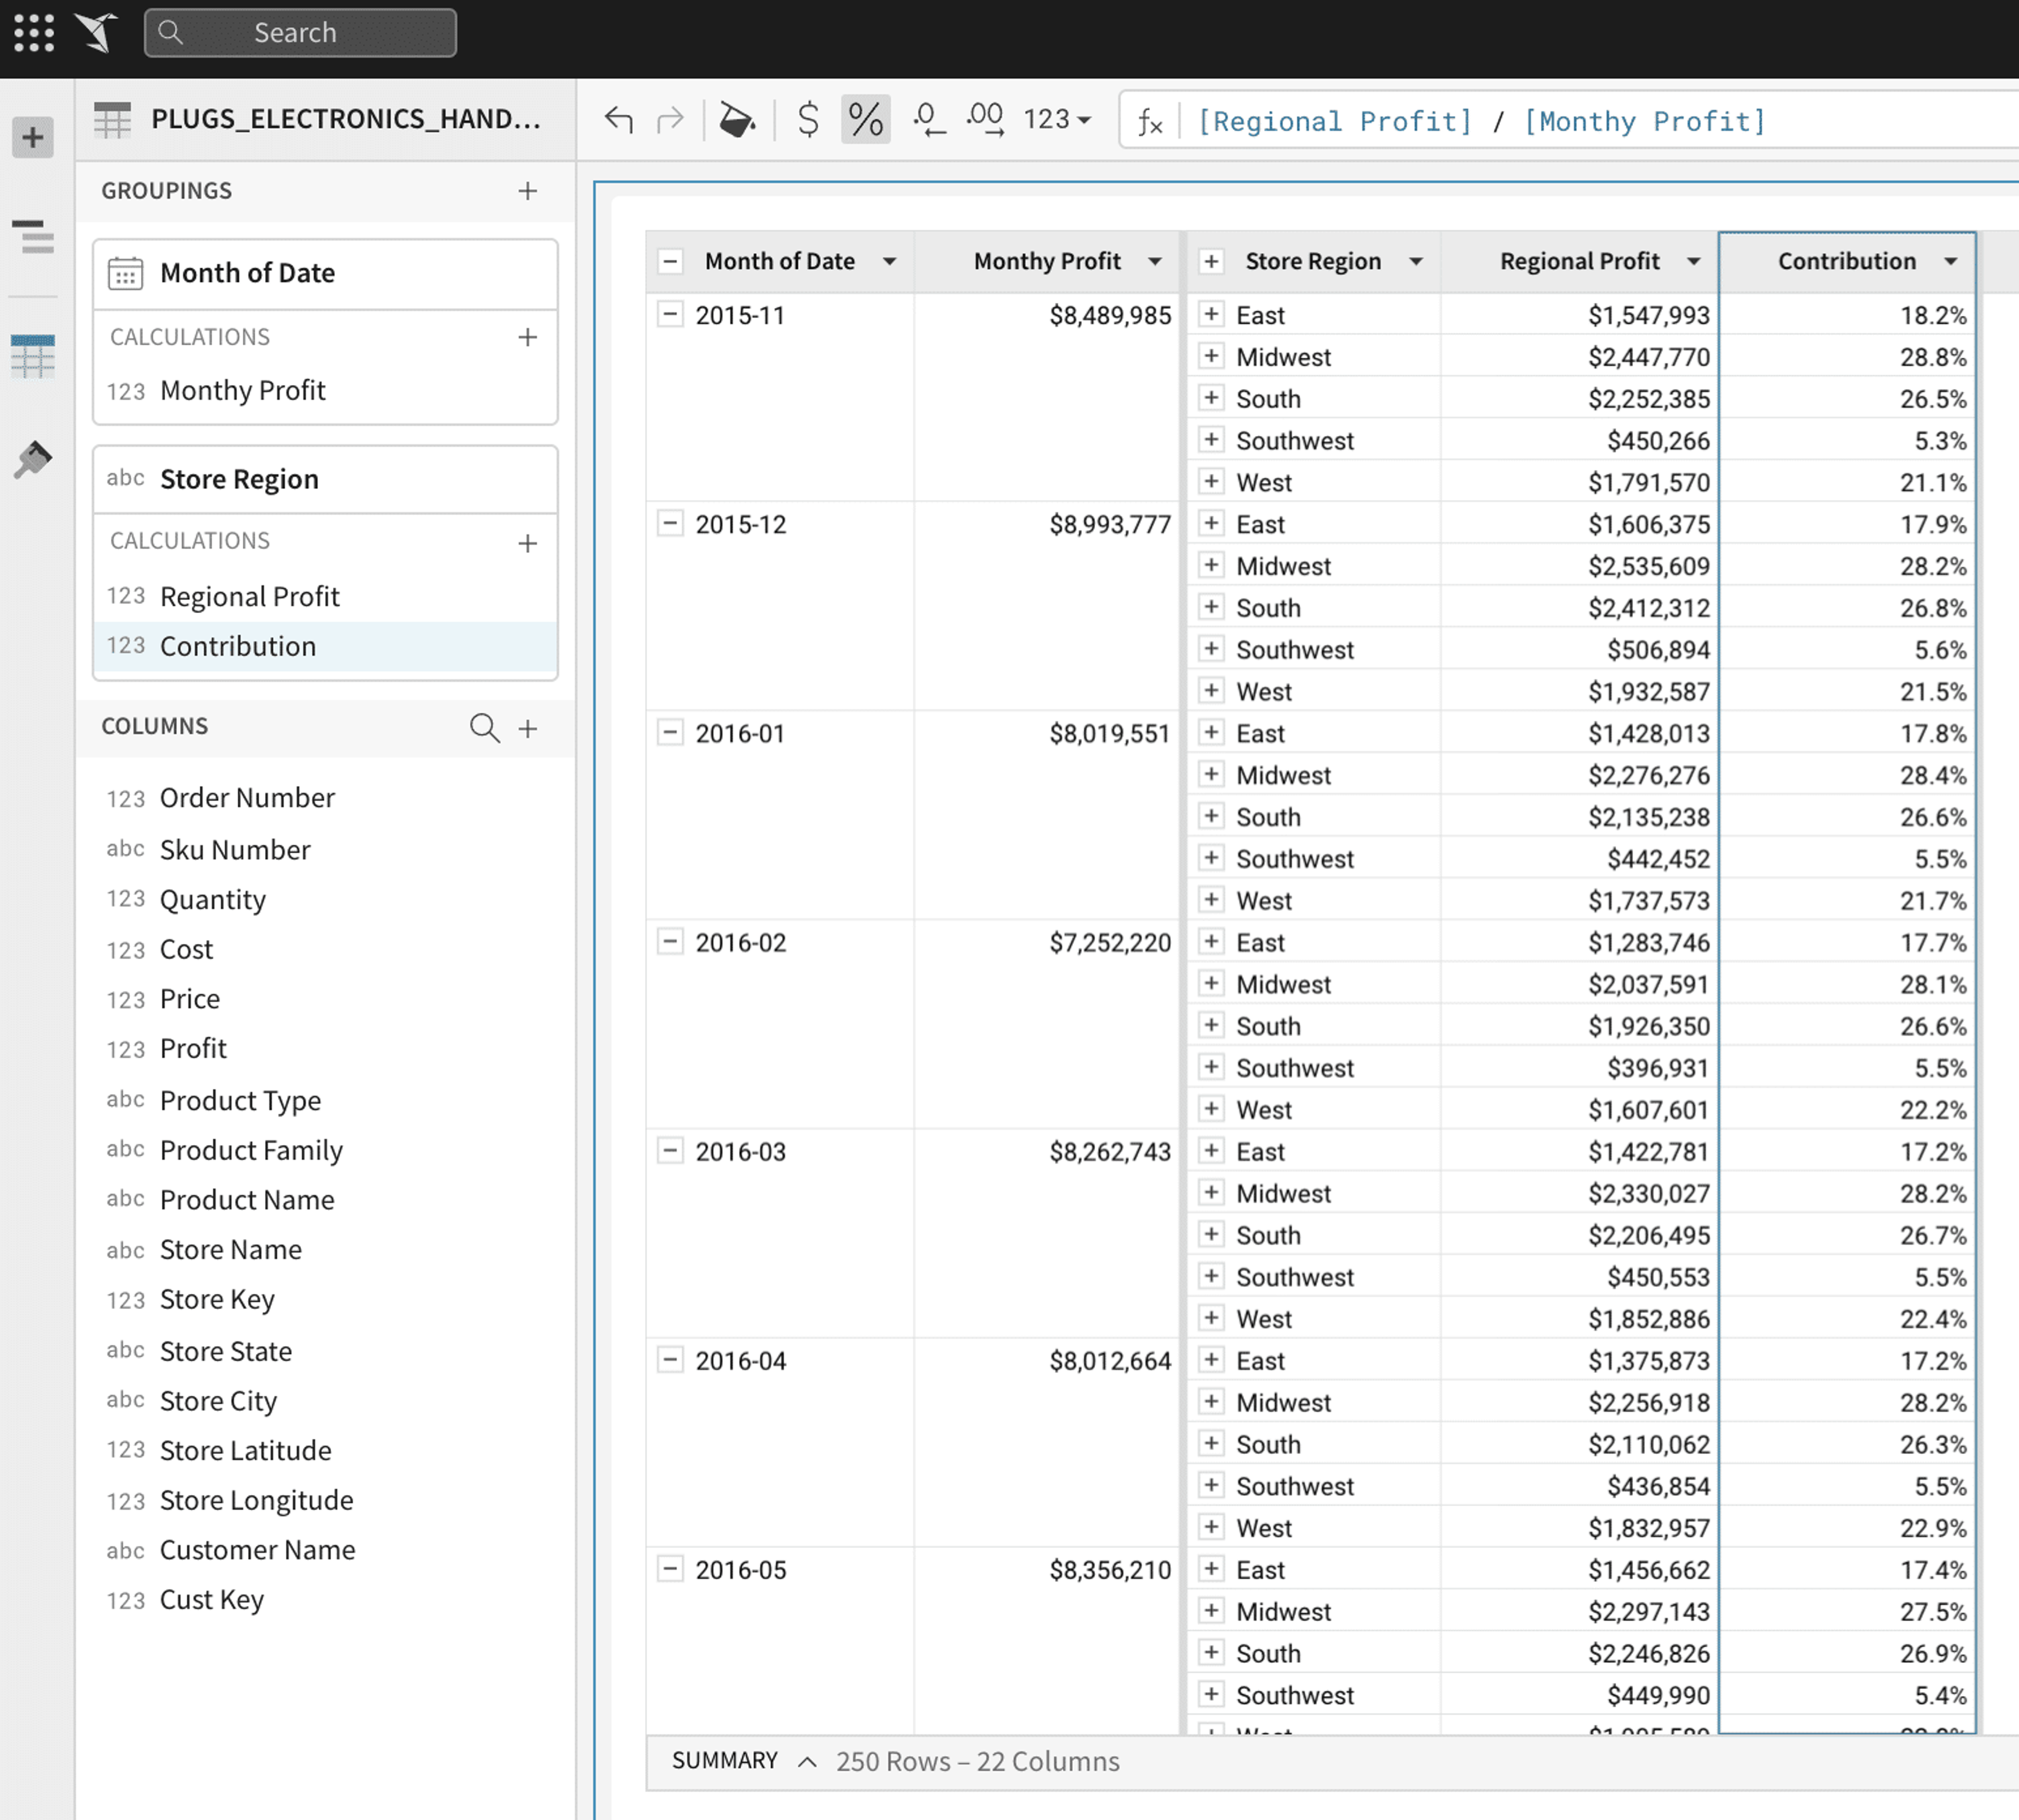
Groups, which are unique to tables, are an excellent tool for comparative analytics. They allow you to analyze rows of data based on shared values within a single column.
Any column in a table can be used to define a grouping. When used to define a grouping, the column becomes what we call a grouping column, and its individual rows merge into single cells based on their distinct values. Subsequently, the rows of data to the right of the group column in the table are bundled into groups based on each unique value in the key column. Group aggregates can then be calculated based on the cell values within each row in the group.
Organizing data in this manner makes comparative analysis a breeze! For example, if you’re measuring profitability of a retail chain, you can group profit together by month and then within that, group again by store region. With two groups, you can see the profitability of each store by month.
Traditional spreadsheets, on the other hand, are flat. While sorting data in flat systems is easy, the only way to create calculations based on that data's subsets is to create a pivot table. Sigma gives you more power for in-depth analyses because it enables you to create more groups than pivot tables. This allows you to quickly calculate aggregates and learn more about your data with little to no effort. But no worries, you can still create pivot tables with Sigma if you wish!
Aggregate functions are special functions that summarize all the rows that make up a group. For example, they can be used to sum all of the values of a column, or Count all of the values for each grouping of a column. As such, aggregates always refer to columns that make up a grouping, meaning that the same aggregate will provide different results based on what grouping it is associated with.
Aggregate functions can also be used on the summary bar: single cells that reflect the value of all of the data from the columns used in the formula. Summaries are helpful any time you want to calculate a value based on all of the data in a table.
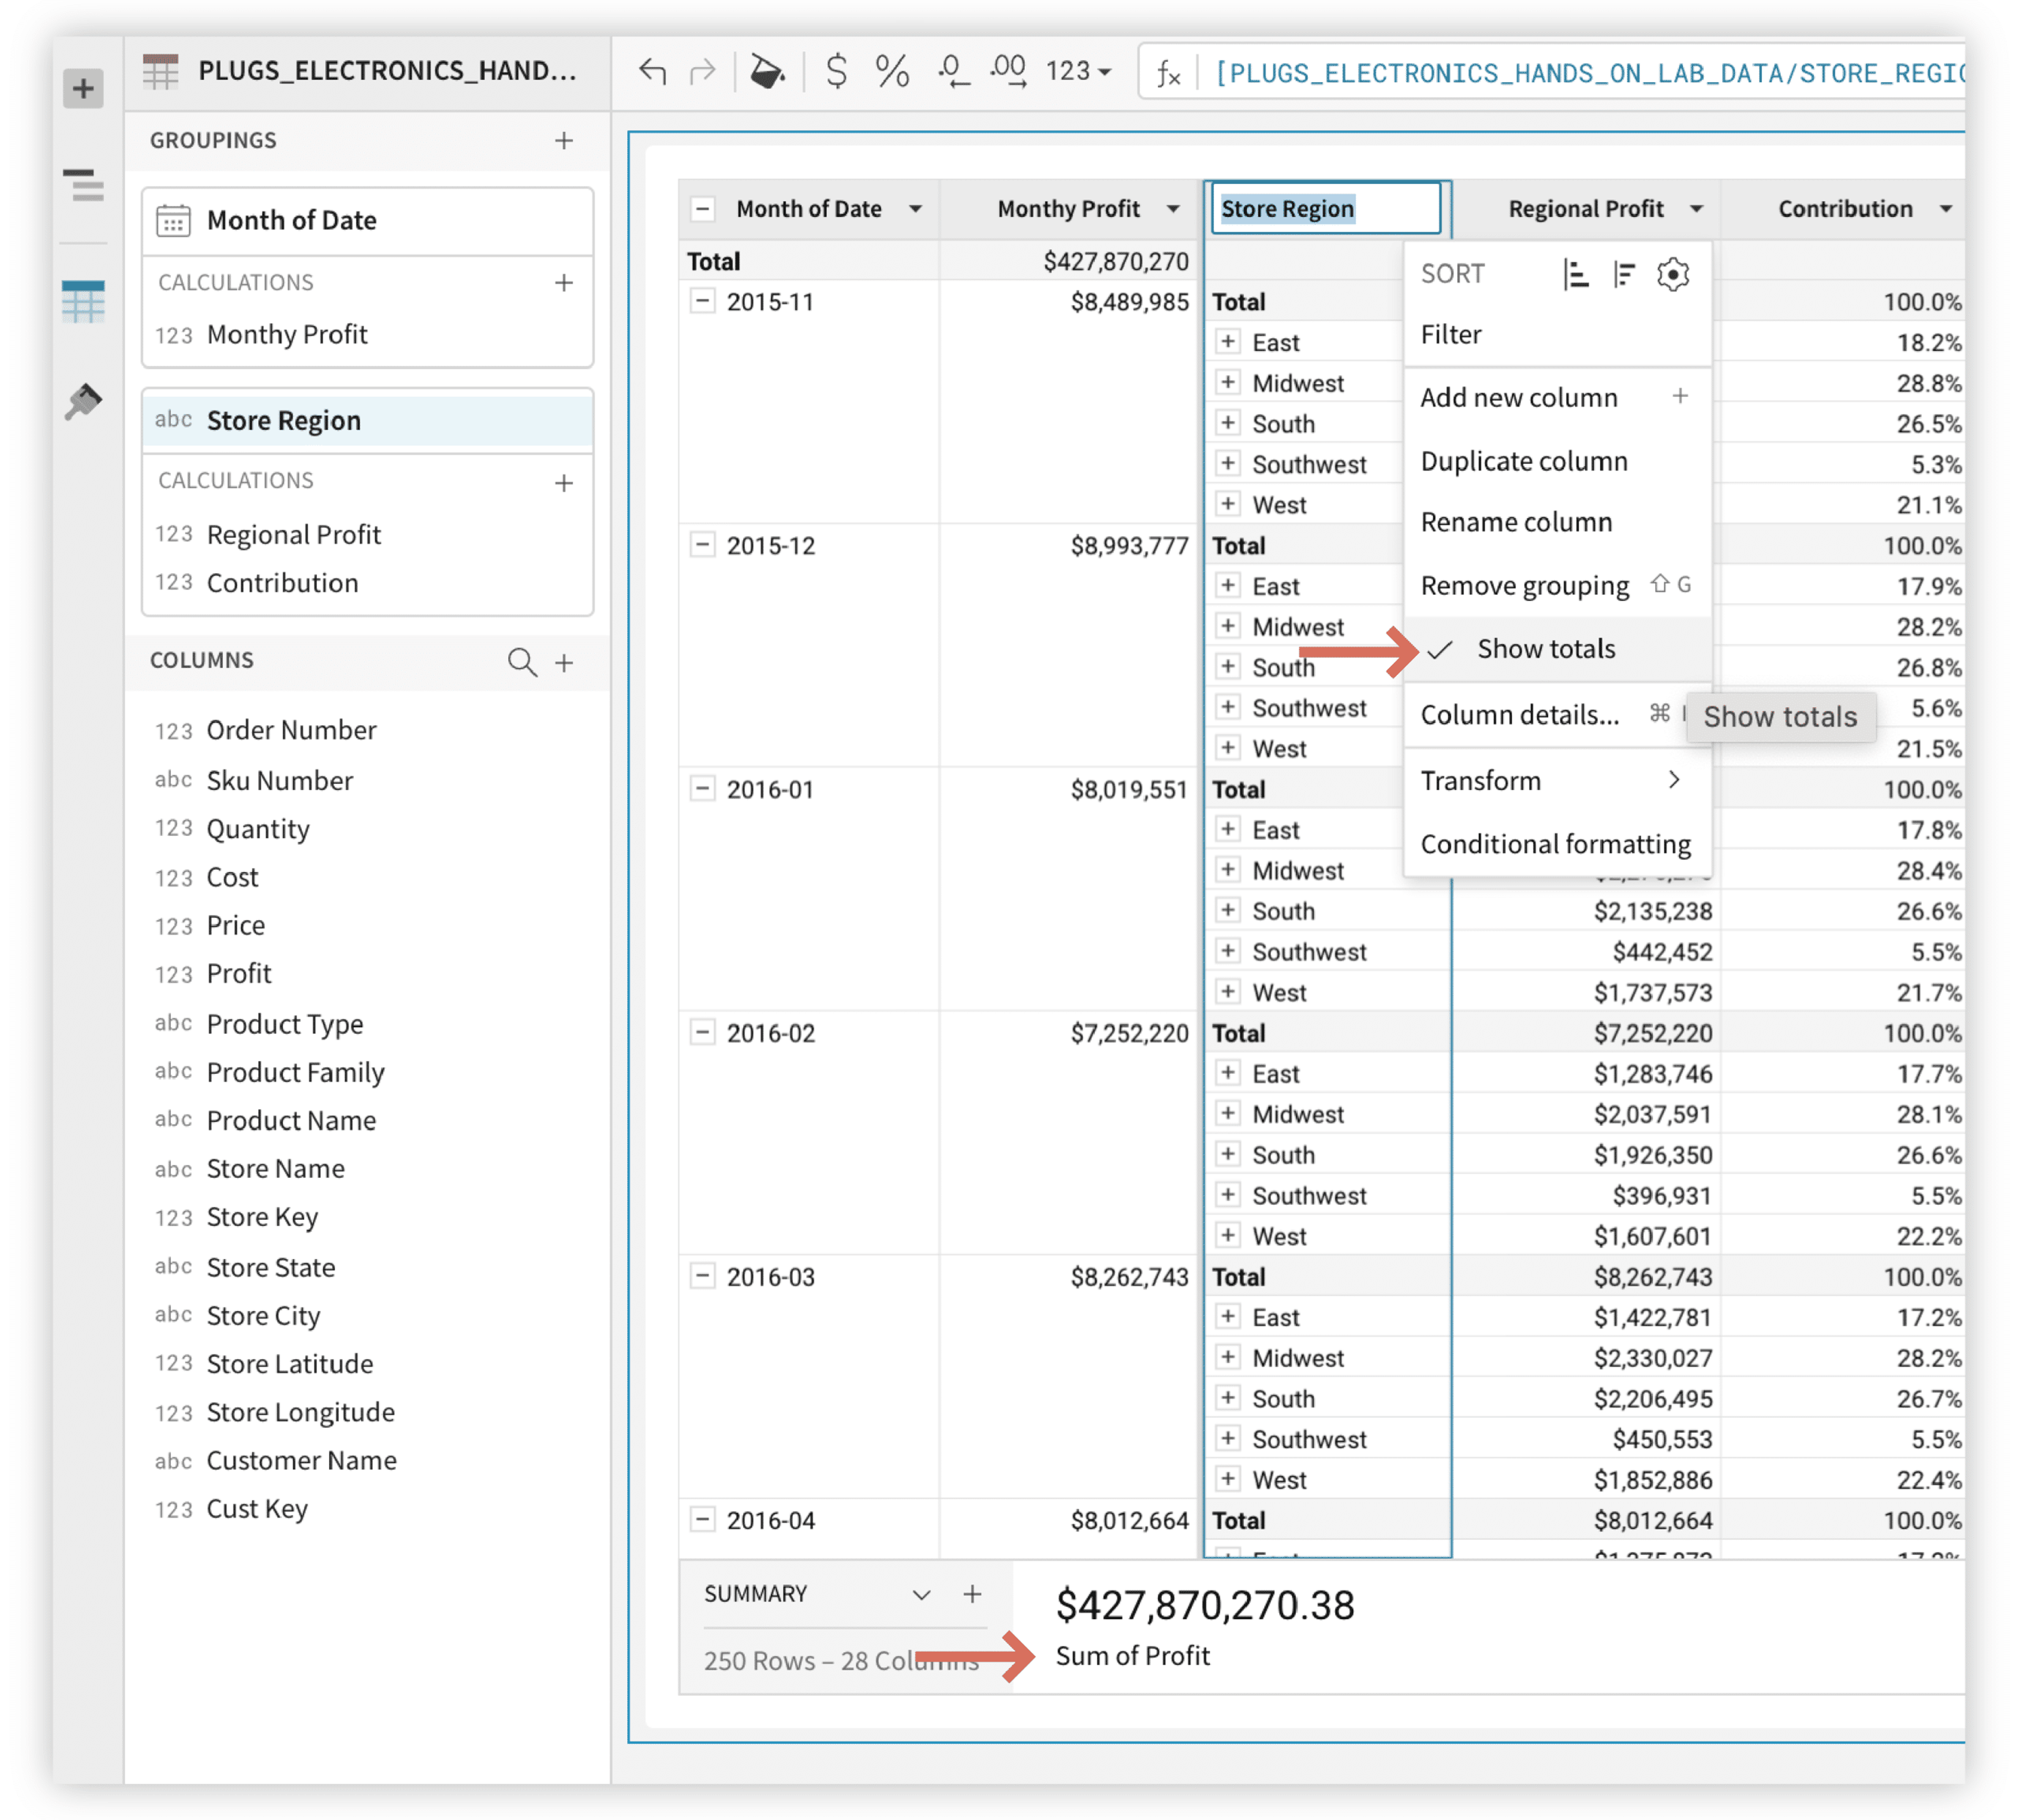
You can also show group totals for your table. Choosing to show totals will show total value at the top of the column based on the column’s formula. Both table totals and summaries can be referenced in formulas.
In practice, totals and summaries can be used in cohort analyses like in the retail store example above.
More than 60% of business experts use Excel to analyze data, so Sigma is easy to learn for anyone familiar with spreadsheets. It even offers many of the same formulas and functions!
To create a calculation in Sigma, create a column and enter the formula into the formula bar, just like a traditional spreadsheet. The formula is then applied to every row of data in that column and can be edited at any time.
Sigma: The Familiarity of a Spreadsheet, Powered by the Cloud
Getting started with Sigma is easy because it empowers employees to freely interact with data and quickly generate insights by using an interface they know and love: the spreadsheet! At the same time, employees avoid the limitations of traditional spreadsheets such as scale limitations, working off stale or summarized data, and not having access to all the data. Sigma – spreadsheets reimagined!
Let’s Sigma together! Schedule a demo today.


