Why Your Date Filters Might Be Lying To You

Picture this: It's Monday morning, and your retail operations manager in New York pulls up the weekend sales dashboard, excited to see how the new product launch performed. The numbers look disappointing: Saturday's sales seem unusually low. Meanwhile, your Los Angeles manager is scratching their head at the same dashboard, wondering why Sunday's numbers are inexplicably high. Plot twist: they're both looking at the same data, but time zones are playing tricks on them. That "Saturday night" sale in New York actually happened at 2 AM Sunday in your UTC database, causing it to appear on the wrong day entirely. Your managers are making business decisions based on what appears to be accurate data, but time zone confusion has quietly sabotaged their reports.
This scenario plays out in businesses every day. When you're storing timestamps in UTC (the smart move for global operations) but displaying them to users across multiple time zones, you're essentially asking your team to do mental gymnastics with every report. Sales get attributed to the wrong days, customer activity patterns become meaningless, and hourly analysis turns into guesswork.
In this blog post, we'll explore why proper date and time management in business intelligence (BI) isn't just a technical nicety but essential for accurate decision-making. We'll cover the fundamental principles behind time zone handling, why your current approach might be creating invisible errors, and how to implement a bulletproof solution that ensures every user sees data in their local context without compromising the integrity of your underlying data.
What happens when your data loses track of time?
Date and time data form the backbone of virtually every business analysis you'll encounter. Without accurate timestamps, your trend analysis becomes guesswork, seasonal patterns disappear, and performance tracking loses all meaning.
The cost of "close enough" thinking is measured in real dollars and missed opportunities. Financial services must timestamp every transaction with legal precision for regulatory compliance. Retail businesses need accurate hour-by-hour data to optimize staffing levels. Logistics companies depend on precise delivery timestamps to calculate performance metrics. In these sectors, a single day's worth of misaligned data can cascade into weeks of incorrect strategic decisions, wasted marketing spend, and paralyzed decision-making as stakeholders lose confidence in their numbers.
The gravity of the situation is clear, so let's turn our attention to the tactics that solve it.
Building your foundation: Formats and time zones
The most dangerous assumption in data analytics is that everyone interprets dates the same way. A timestamp reading "02/04/23" could represent February 4th, 2023, to an American analyst, but April 2nd, 2023, to a European colleague reviewing the same report. Projects often get derailed by this simple misunderstanding.
Your solution lies in adopting the ISO 8601 international standard (YYYY-MM-DD), which eliminates ambiguity through its hierarchical year-first structure. Beyond clarity, this format sorts chronologically when stored as text and remains consistent across all database systems. Converting inconsistent date formats requires both technical precision and organizational discipline. In Sigma, you can use DateParse([Date_Text_Column], "MM/DD/YYYY") to convert text strings into properly formatted date values, explicitly telling the system how to interpret your incoming data.
Time zone handling represents an even more complex challenge. A timestamp without time zone context is fundamentally incomplete information. The difference between 10:00 AM in Tokyo and 10:00 AM in New York represents a 13-hour gap that can shift your data into entirely different business days. The industry best practice involves storing all timestamps in Coordinated Universal Time (UTC) within your databases, then converting for user display using functions like Sigma's ConvertTimezone([UTC_Timestamp], "America/New_York").
Here’s the key takeaway: ISO 8601 for formatting, UTC for storage. These two principles will prevent a world of data reconciliation headaches.
Taming time with effective date filtering
Effective date filtering forms the foundation of meaningful time-based analysis, yet many organizations struggle with inconsistent approaches that lead to skewed results. Predefined ranges like "Last 7 Days" or "Month to Date" provide consistency for standard reporting, while custom ranges enable specific historical analysis. The real power emerges through relative date filtering, which automatically adjusts as time progresses. Instead of manually updating reports to show "January 1 to March 31, 2024," relative filters like "This Quarter" maintain relevance without constant maintenance.
Dynamic filtering transforms static reports into interactive analytical tools. In Sigma's interface, you can convert filters into page controls that enable users to modify date ranges in real-time, fostering data exploration and self-service analytics. A sales manager can instantly switch from quarterly to monthly views or zoom into specific time periods when investigating performance anomalies.
Critical implementation details can make or break filtering accuracy. Always apply date filters to base date columns rather than truncated versions to avoid unexpected results. For instance, filtering on a full timestamp column ensures precise daily boundaries, while filtering on a month-truncated version might inadvertently include entire months when only specific days were intended.
Period comparisons: Context through time
Standalone metrics lack the context necessary for meaningful business interpretation. Reporting "$1M in sales" raises immediate questions: Is this performance good or concerning? Period-over-period analysis provides this essential context by comparing current performance against relevant historical benchmarks.
Month-over-month analysis
Month-over-month comparisons excel at revealing short-term momentum and measuring the immediate impact of recent initiatives. This analysis proves invaluable for tracking the effects of marketing campaigns or operational changes.
Year-over-year comparisons
Year-over-year analysis provides a more stable foundation for understanding actual business growth by comparing equivalent periods across different years. This approach automatically accounts for seasonality; Comparing December 2024 sales to December 2023 eliminates the holiday shopping effect while revealing underlying growth trends.
Custom fiscal periods
Many organizations operate on fiscal years that better align with their business cycles than calendar years. A retailer might end their fiscal year on January 31st to capture the complete holiday season within a single reporting period, while educational institutions often align with academic calendars.
With your foundation solid and comparison frameworks in place, let's explore how to smooth out the inevitable noise in your daily data.
Rolling calculations: Smoothing the noise
Daily business data often contains significant volatility that can obscure underlying trends and lead to overreactions to short-term fluctuations. A single slow sales day doesn't indicate a systemic problem, just as one exceptional day doesn't guarantee sustained success. Too many teams make knee-jerk strategy changes based on daily spikes that are actually just noise.
Moving averages represent the most powerful tool for cutting through this volatility. They operate on a sliding window of data that moves forward through time, showing you the average performance over a specified period rather than individual day fluctuations. A 7-day moving average of website traffic, for example, shows you the average daily visitors over the most recent week for any given day. As each new day's data becomes available, the oldest day drops out of the calculation, causing the average to "move" forward and providing a smoothed trend line.
Your choice of window size significantly impacts what you discover. Short-term windows like 7-day or 30-day moving averages remain responsive to recent changes, making them perfect for operational monitoring and catching emerging trends early. Longer windows, such as 90-day or 180-day averages, provide greater stability and help you see strategic, long-term patterns without getting distracted by monthly fluctuations.
Here’s a practical example that showcases how Sigma's functions can solve this challenge. Suppose you're tracking daily e-commerce sales and notice wild swings that make it hard to see your actual performance trajectory. Looking at the data above, you can see how individual transaction amounts vary dramatically, making it challenging to spot underlying trends.
To smooth out this volatility, add a 30-day moving average column using the formula MovingAvg(Sum([SaleAmount]), 29, 0). The "MovingAvg of Sales Sum" column shows how this creates a clear trend line that cuts through the daily noise, instantly revealing whether your sales are genuinely growing, declining, or staying flat without getting distracted by individual transaction fluctuations.
Deeper insights with advanced date functions
Beyond basic filtering and comparison, you need the ability to deconstruct dates and calculate durations between events to unlock insights that aren't immediately apparent in raw timestamp data. Date component extraction allows you to group and analyze data by specific temporal dimensions. Understanding weekly patterns requires isolating the day of week from full timestamps, while seasonal analysis needs month extraction. Sigma's DatePart() function enables this decomposition with specifications like "month," "weekday," or "hour."
Duration calculations measure the time elapsed between events, which proves essential for process analysis and performance tracking. Customer support teams calculate ticket resolution times, e-commerce operations measure fulfillment speed, and subscription businesses track customer lifetime duration using DateDiff() functions that specify time units and start/end timestamps. These metrics can then be averaged, trended, and benchmarked against industry standards.
Custom business periods often require combining multiple date functions into sophisticated formulas that reflect your unique organizational calendars. A fiscal year beginning in July might require conditional logic that assigns dates to the appropriate fiscal year based on their month. Similarly, 4-4-5 retail calendars or project-specific phases need custom calculations that standard calendar functions can't provide directly. You might create a fiscal year column using If(Month([Date]) >= 7, Year([Date]) + 1, Year([Date])) to properly categorize your financial periods.
But remember, all these sophisticated functions and calculations are only as valuable as the trust your stakeholders place in them. Technical precision means nothing if data skepticism has eroded your team's confidence in their reports.
Building data trust: Your path to reliable analytics
Even organizations with strong analytical capabilities can fall victim to subtle date and time errors that undermine data credibility. Let's revisit the key principles we've discussed and show you how they work together to build stakeholder confidence.
We've already covered the foundational challenges: preventing regional format confusion, correcting for time zone shifts, and avoiding the inflated numbers that come from filtering on a truncated date column. But there's another equally damaging issue on the flip side of this granularity problem: it can mask key details. When data is aggregated too broadly, significant patterns disappear entirely. A single day's sales spike that should trigger immediate action gets completely averaged out and lost within a monthly summary, burying insights that could affect important business decisions.
Fortunately, Sigma provides sophisticated solutions to these challenges. Beyond standard date parsing and conversion functions, Sigma can automatically convert timestamps to each user's specific timezone based on their profile settings, eliminating the manual intervention that often introduces errors.
Five essential practices for fostering data trust
Data trust isn't built on functions alone, but on a foundation of clear, consistent standards. You need to establish and maintain rigorous standards across your entire organization:
- Standardize on ISO 8601 formatting across all data sources using explicit DateParse functions rather than relying on automatic interpretation.
- Store timestamps in UTC and convert appropriately for user display using Sigma's ConvertTimezone functions.
- Apply filters to full timestamp columns rather than truncated date parts to ensure precise boundary handling.
- Document your date logic and assumptions directly in your workbooks so other users understand your approach.
- Test your date logic with edge cases like leap years, daylight saving transitions, and month-end boundaries to catch errors before stakeholders do.
When you master these fundamentals, something remarkable happens. Your temporal data graduates from a source of confusion into a competitive advantage. Stakeholders stop questioning their numbers and start acting on insights. Teams make faster decisions because they trust their reports align with business reality.
Time-based analysis doesn't have to be your organization's Achilles' heel. With consistent standards, proper tooling, and the principles outlined here, temporal data becomes your secret weapon for uncovering insights others miss. Now it's time to make time work for you.
Untangling your timeline: Date Filtering FAQs
What is the difference between a fiscal year and a calendar year in analytics?
A calendar year spans from January 1 to December 31, while a fiscal year is any 12-month period that an organization defines for its financial reporting. Many companies choose fiscal years that align with their business cycles, like retailers ending on January 31st to capture the full holiday season. Using the correct fiscal definition ensures accurate year-over-year comparisons.
How do I handle daylight saving time in reports?
Store all timestamps in UTC within your database, then convert to local time zones for user display using functions like Sigma's ConvertTimezone(). This approach automatically handles "fall back" and "spring forward" transitions, preventing duplicated or missing hour data that distorts reporting.
Can I use multiple date fields in one analysis?
Yes, this is common with datasets containing order dates, shipment dates, etc. When working with multiple date fields through data blending, create relationships between your data and a central calendar table, establishing one active relationship to your primary date field and inactive relationships to others. Activate alternative relationships within specific calculations as needed.
What's the easiest way to compare performance year-over-year in Sigma?
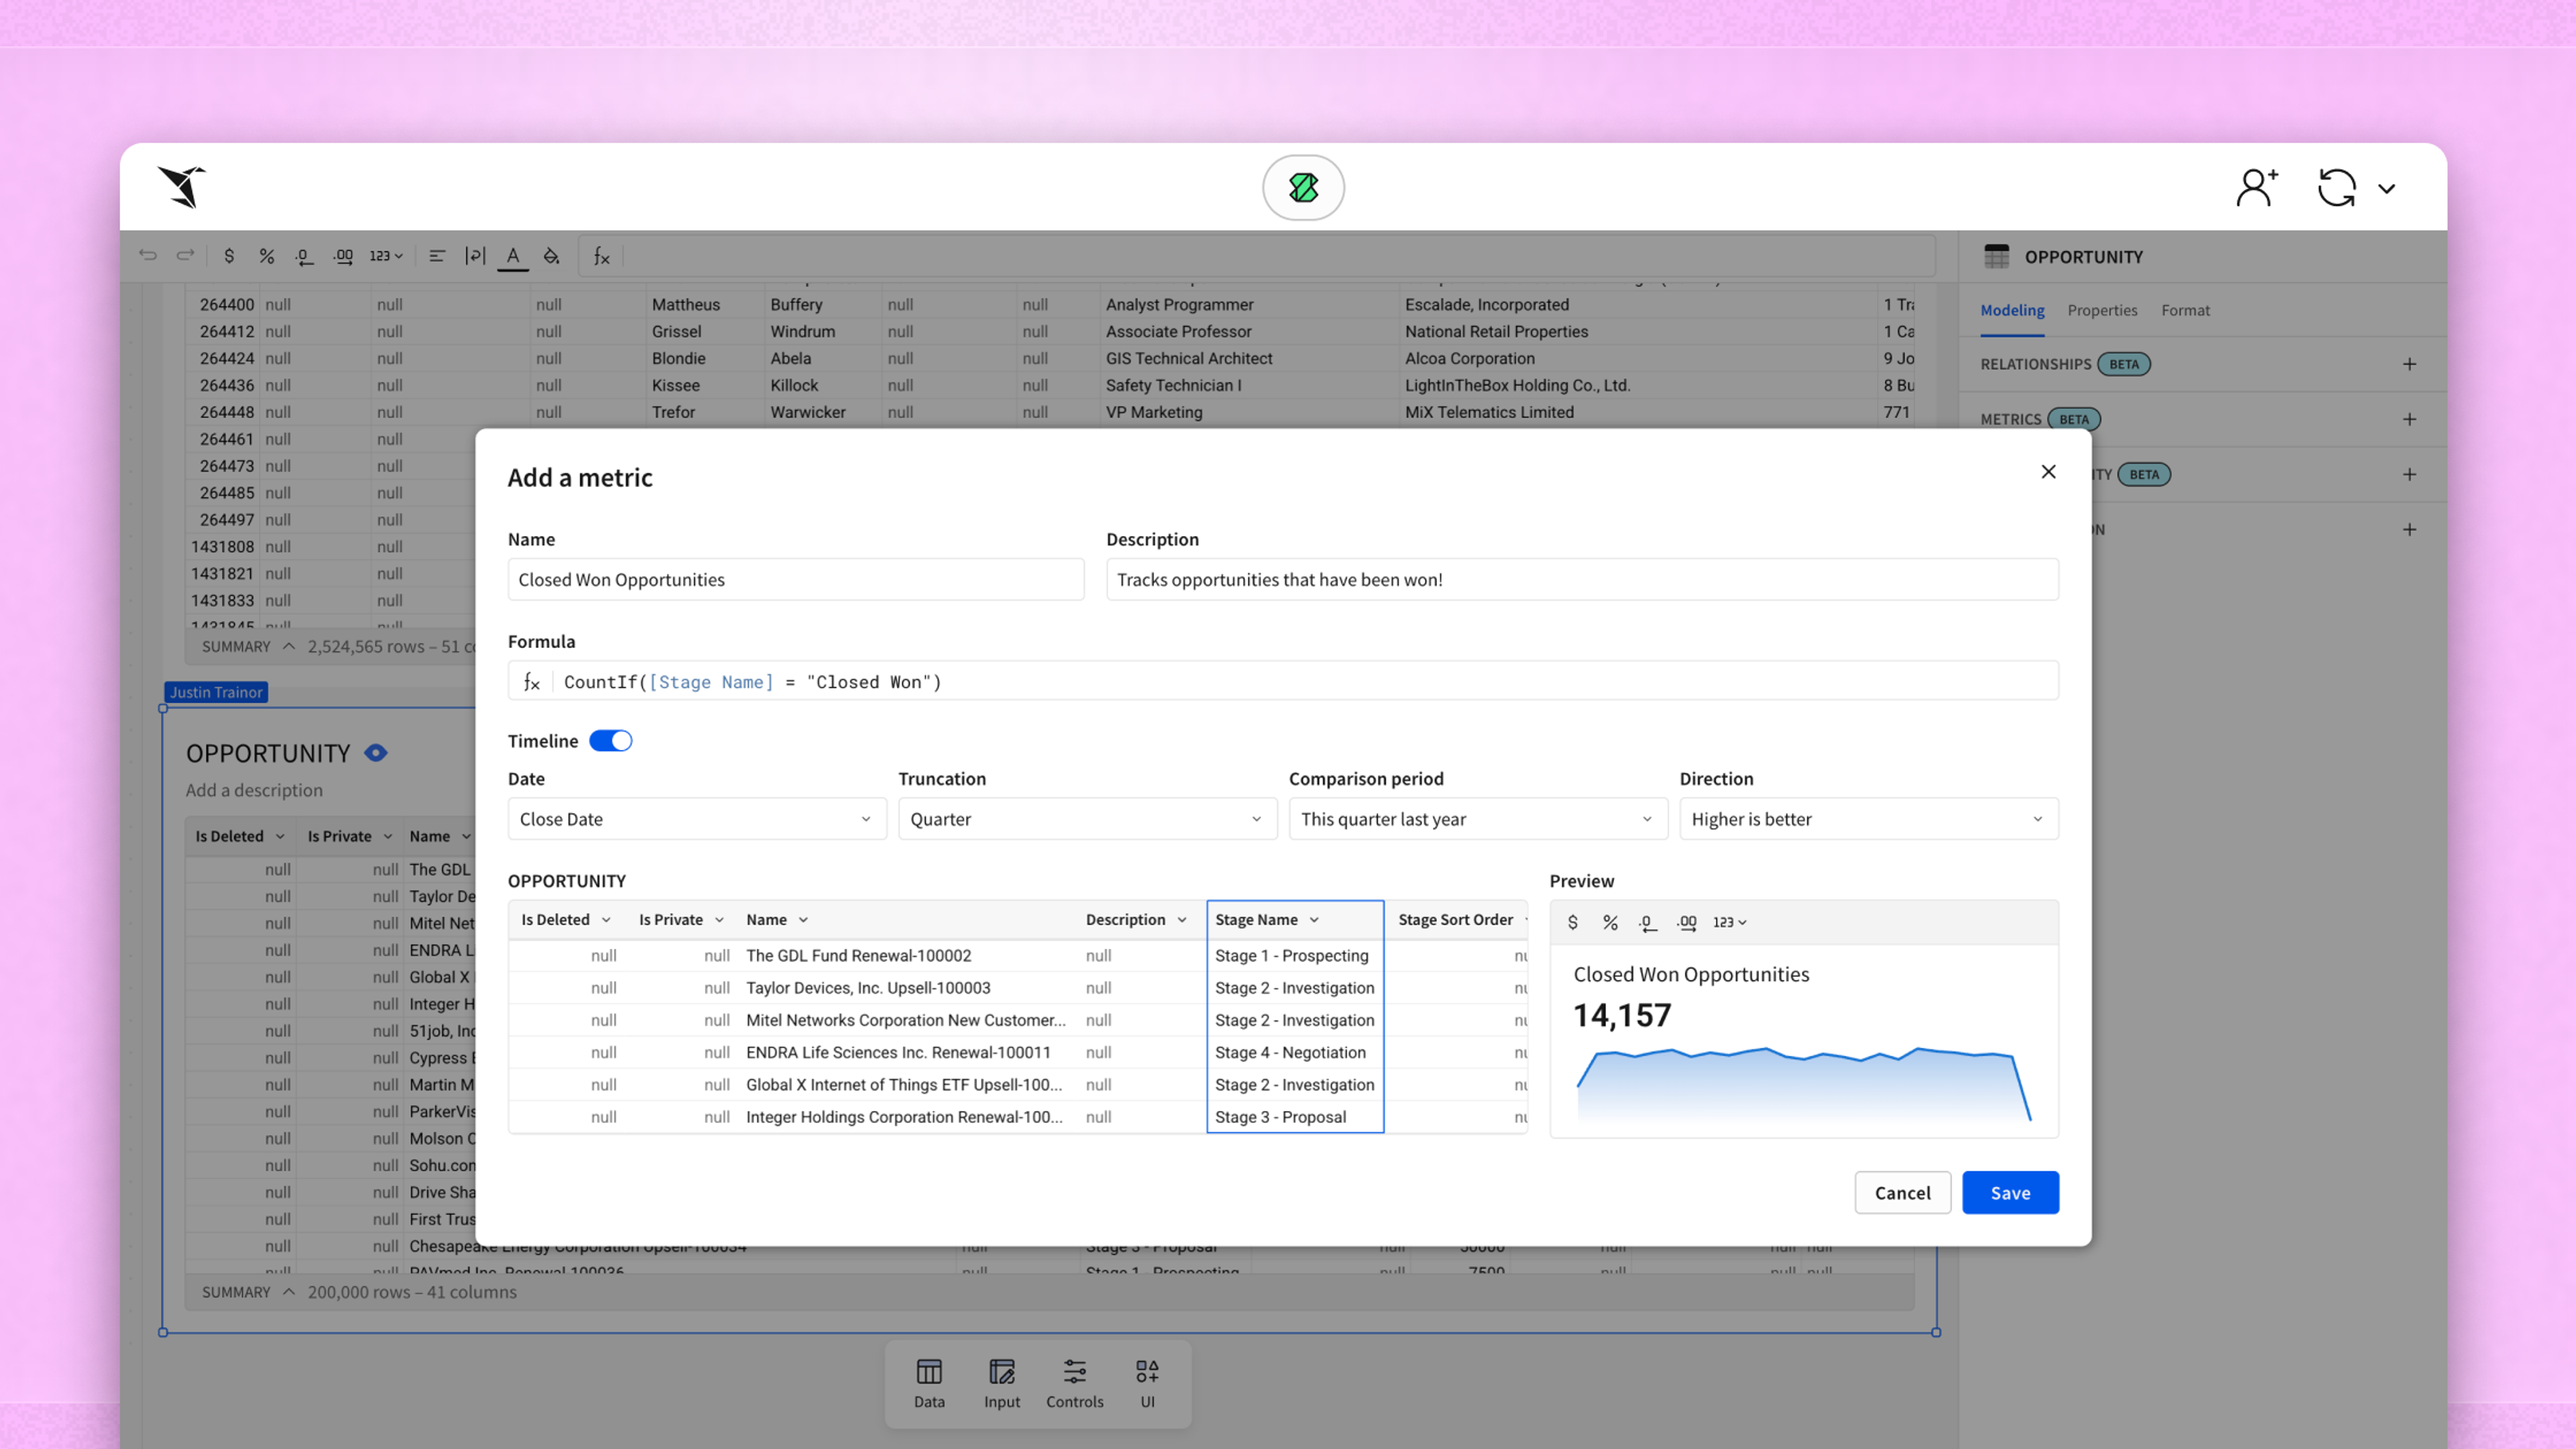
Use Sigma's Period-over-Period analysis feature. From a table view, open your metric's column menu, select "Add column via" then "Period over period comparison." Choose "Previous Year" as the timeframe, and Sigma automatically generates the necessary calculations and percentage changes.
How can I automate date-based filters in dashboards?
Use relative date filters like "This Quarter" or "Last 90 Days" instead of fixed ranges. Convert these to page controls in Sigma so the date range automatically adjusts based on the current date, providing up-to-date insights without manual updates.