Data Exploration: The Missing Ingredient to Improve Recruiting

Welcome to my blog series on Data Exploration! In this monthly column, I explore the common challenges and pitfalls that functions within an organization often run into and how they can solve for it with Sigma. We are a company of innovators who believe in pushing the boundaries of what’s possible with data, and we also pride ourselves in being the model Sigma customer. Read on.
Enter the fascinating world of hiring where you’re dealing with real people, with many rounds of interviews, with make-or-break decisions… and with loads and loads of data! Does your BI or recruiting tool allow you, as a recruiter, to explore data yourself? Do the reports provide you insights beyond surface level stats? Do you have the ability to pull out and analyze your data without being at the mercy of a data admin? If you answered “no” to any of these questions, this one's for you!
Most business products, today, provide some form of charting and reports section where they try to show you data they think you might find useful. In most cases this is very high level, and doesn’t answer anything beyond surface level questions. What’s missing in most of these products is a way for you to explore the data yourself or to export the data to your own exploration tool that doesn’t require a SQL expert to work with you hand in hand.
In this blog, we’ll explore how we leveraged Sigma to answer questions about our hiring process, as well as operationalized it to make sure we didn’t drop candidates in-process. Sigma lets us process large and complex volumes of data in an easy-to-use spreadsheet-like interface.
The Challenge
We use Greenhouse as our recruiting tool. It’s a fairly popular applicant tracking system (ATS), though what I’m going to talk about is how it applies to Lever and most other ATS'. The reports they provide are very high level, built from the point of view of “how does a recruiter prove that they’re working” and not to help you identify and fix issues with your funnel or improve it.
As an example, you can find a report that shows how many people are in a specific funnel (or a set of funnels) but you can’t find reports to diagnose the problems in the funnel.
For example, despite the system having all of this information, you can’t easily answer any of these questions:
- Which of your candidates haven’t been handled by a recruiter recently?
- Which of your interviewers are over-subscribed this week?
- Which of your interviewers is overly harsh or too lax in their assessments?
And so on… Now, let’s solve for these with Sigma.
Laying the Groundwork
We did some prep work to move the data into Sigma. We used Fivetran to sync the data from our ATS to our Snowflake warehouse. Next, we created some datasets and used Sigma’s Lookup functionality (similar to Excel’s VLookup) to create handy connections between these tables without any complex SQL or Joins.
The fundamental unit of data is an ‘Application’ which refers to an applicant applying for a job. We created an “Augmented Applications” data set with one row per application that has the state of the application, details about the candidate, recruiter, stage, and link to the ATS. Almost all of our explorations are based on this data set.
How to Not Lose a Candidate in 10 Days
Candidate experience and candidate engagement are cornerstones of hiring and employer brand building.The question that stumped us was: As your company and team grows, how do you make sure you keep your candidates warm and engaged? Surprisingly, there isn’t a report for this in any of the existing ATS’.
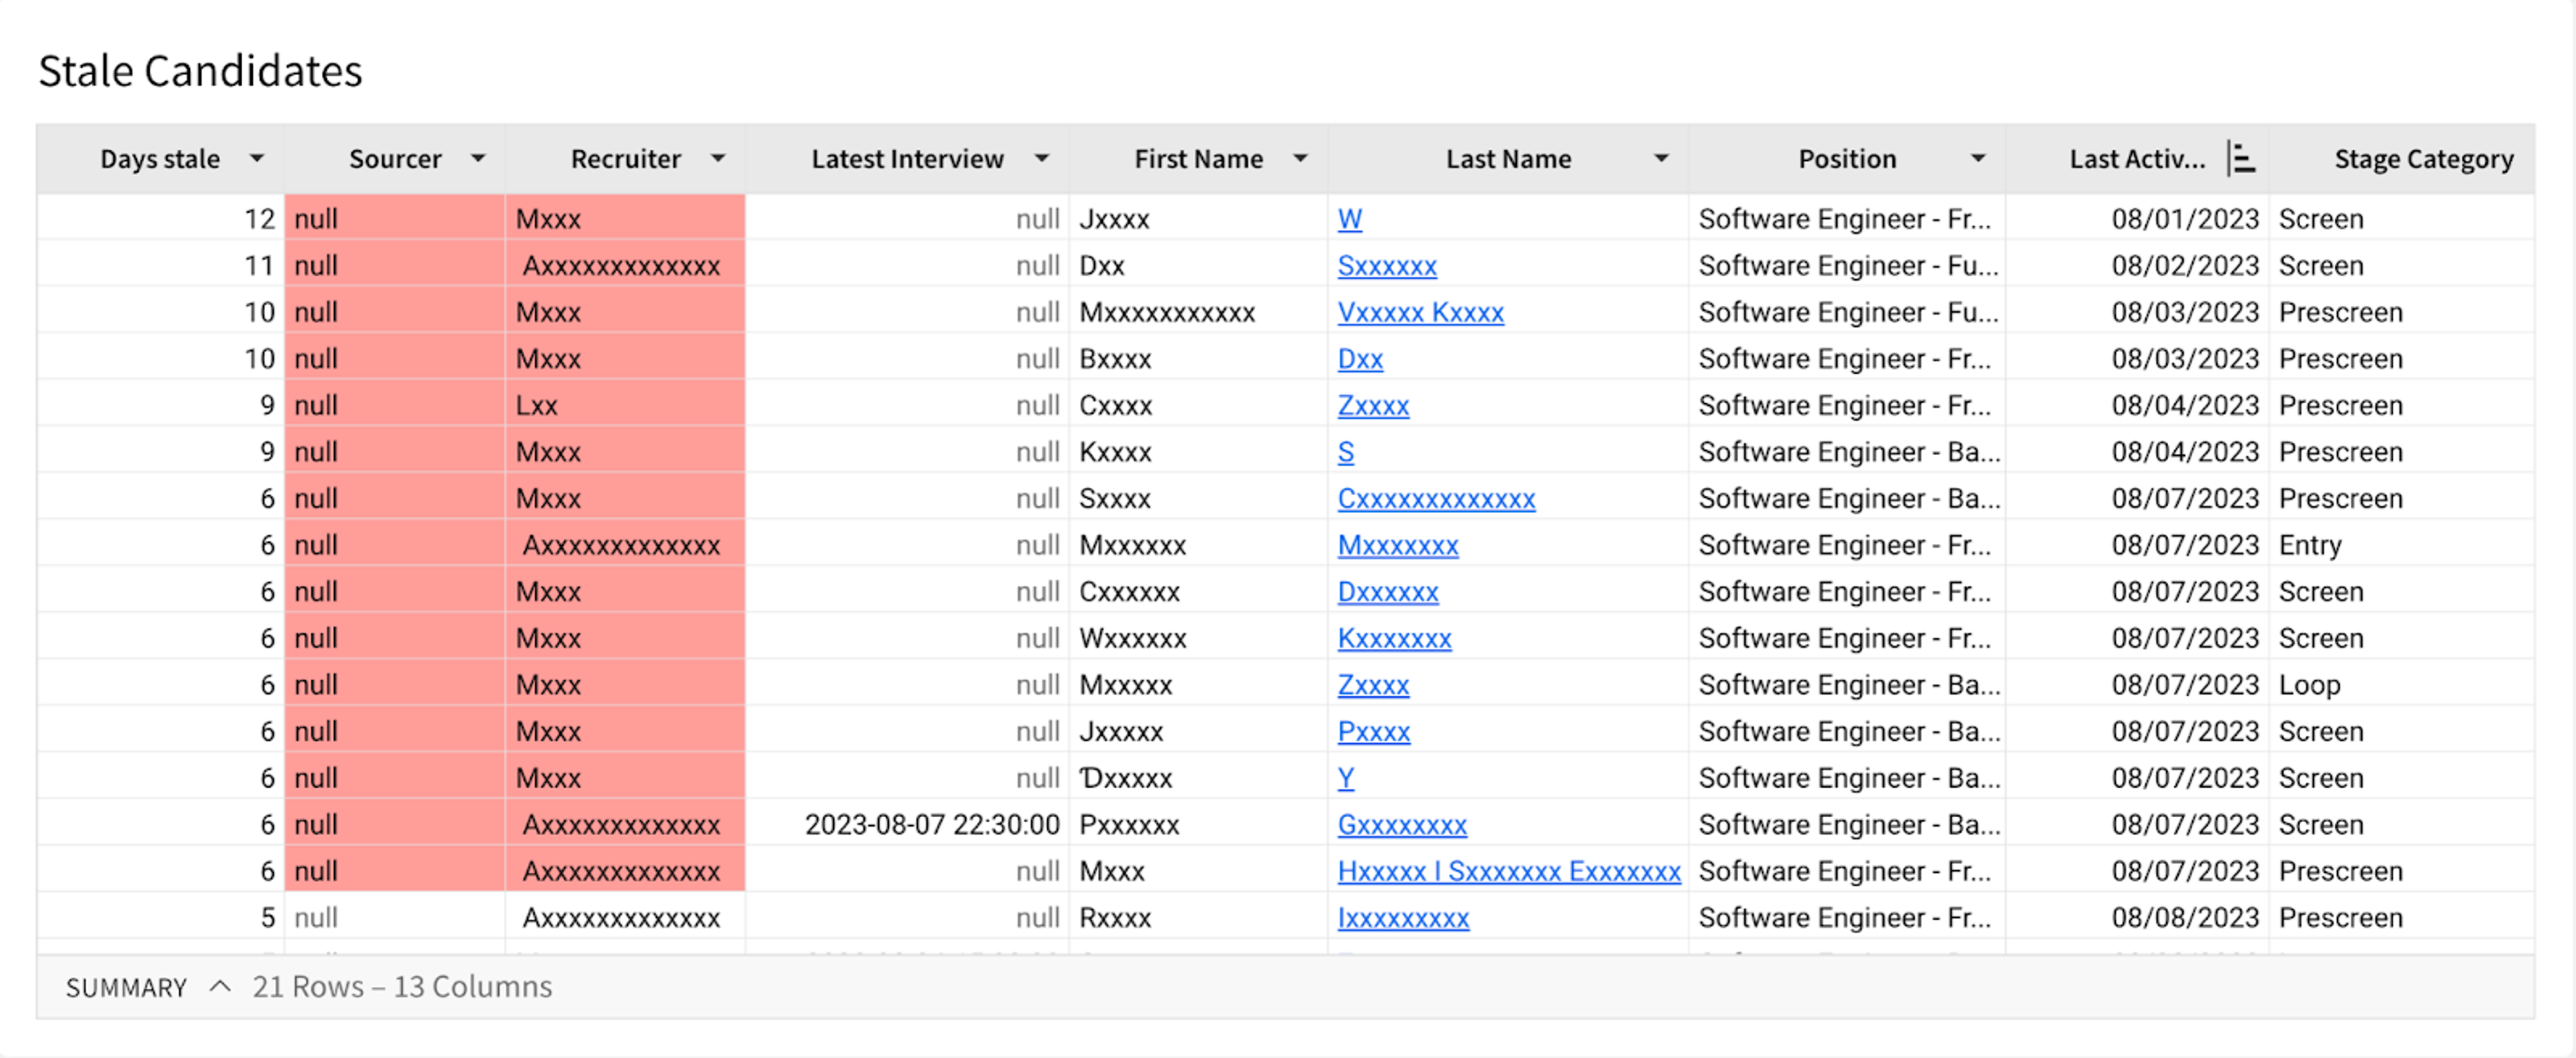
Any candidate that is still in process,
- that doesn’t have a future interview scheduled.
- that hasn’t been updated in the ATS for at least 5 days.
These show up in a table. We further customized this as follows:
- If they haven’t been touched in more than 6 days, they show up with a red background.
- To stay top of mind, if this table has data, it gets sent via Email or Slack to me and our recruiting team.
This means full visibility for any candidate that was accidentally missed and that needs attention or further scheduling. At the minimum, someone needs to go into the ATS and add a note to update the record.
Interview Load Balancing: Help Your Recruiters without Burning out Your Interviewers
Recruiting: “We need more interviewers!”
Engineering: “Engineers are already doing too many interviews!”
ATS: ((crickets))
Enter a product opportunity for some company (e.g. GoodTime), but in reality what we needed was some visibility into what the actual load was, and who was and wasn’t already scheduled to interview by week. All the data is already in your ATS, since every interview is in the system. This is simple enough:
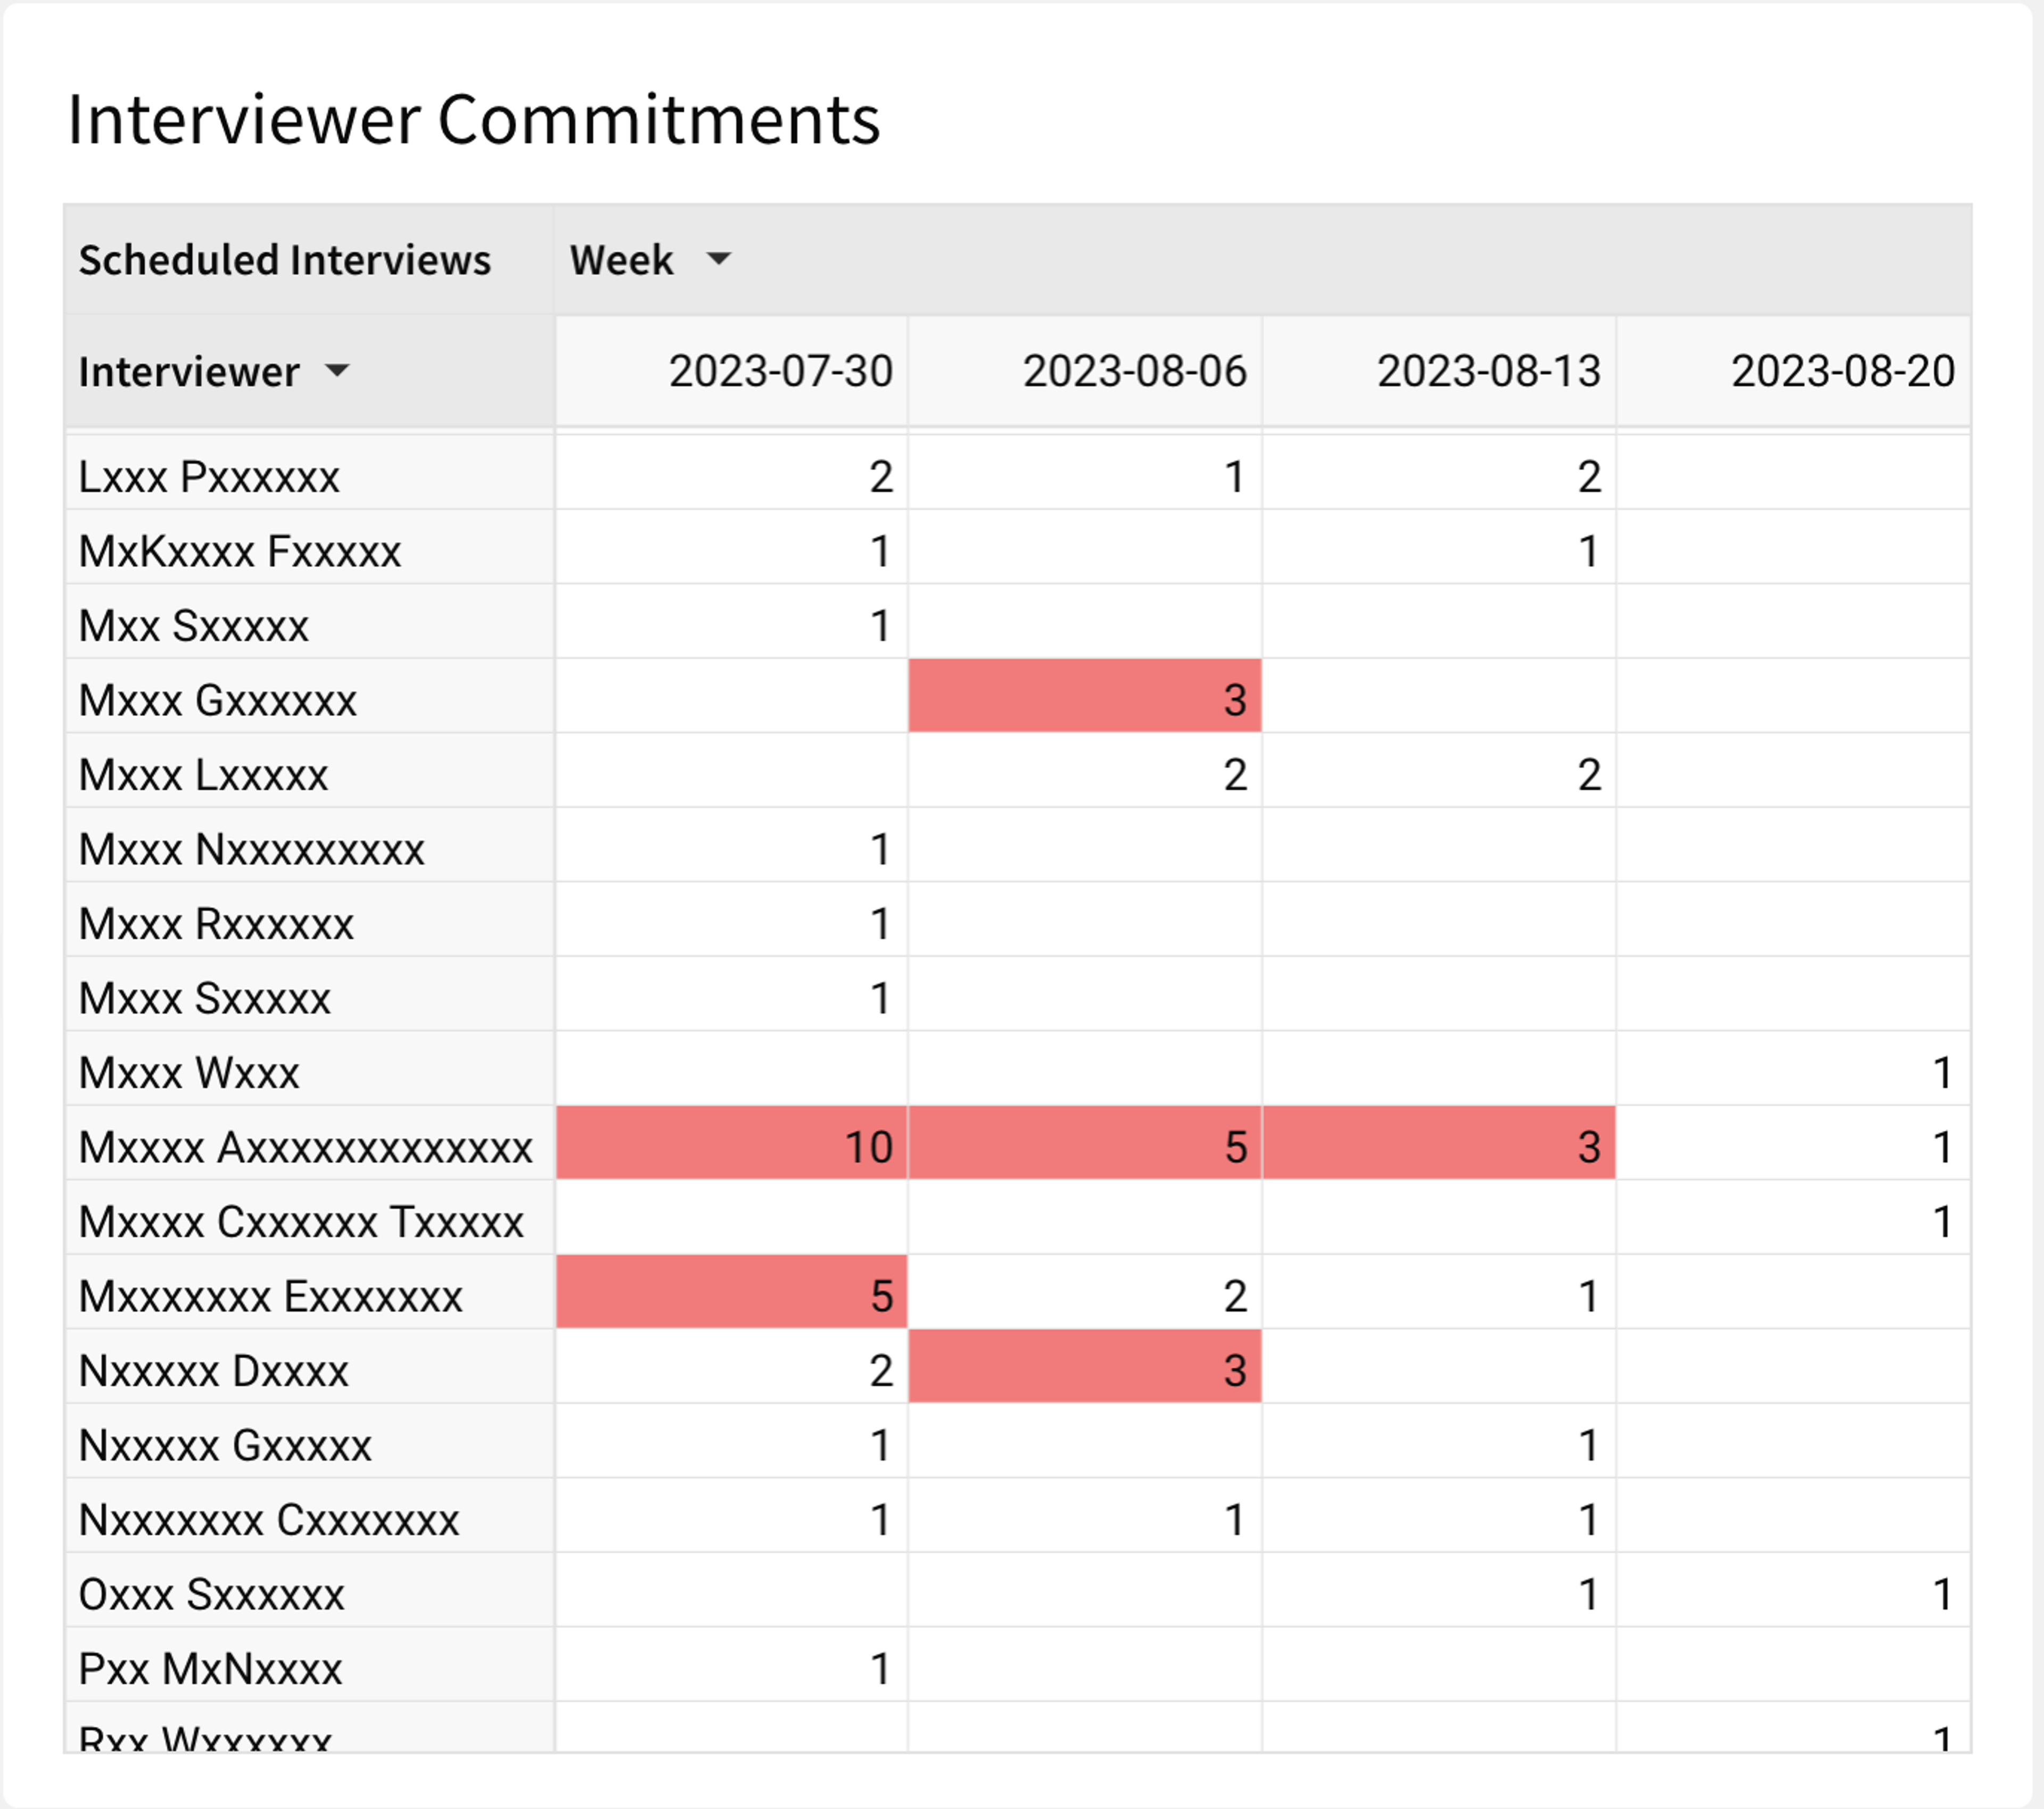
- Start with all the positions for a set of interviewers (e.g. engineering).
- Take all the interviews scheduled in the moving window of last week to next three weeks.
- Show for all interviewers how many interviews they have per week.
Voila! Our recruiting coordinators now have a tool to see who from the list of trained interviewers hasn’t reached their limit of interviews/week and can be scheduled for more interviews. We uncovered an interesting insight: There was definitely capacity.
Every hiring manager and recruiter has their own set of stages that candidates go through. ‘Hiring Manager Screen, ‘Phone Screen,' ‘Hiring Manager Phone Screen,' and 'Initial Manager Screen' are all basically different setups for the same type of interview. Beyond that you might have a 'Technical Phone Screen' that is a different interview type, but is still part of the screening process before you bring a person 'on-site' or 'face-to-face' or whatever you do post-pandemic. The point is, applicant tracking systems are very configurable and everyone wants to express themselves.
At the end of the day you want to track a few basic interview milestones:
- Pre-screens: Applications and recruiter screens
- Screens: Manager / Technical
- Loop: On-Site / Full Loop Interview
- Offer: Final Negotiation / Sell Stage
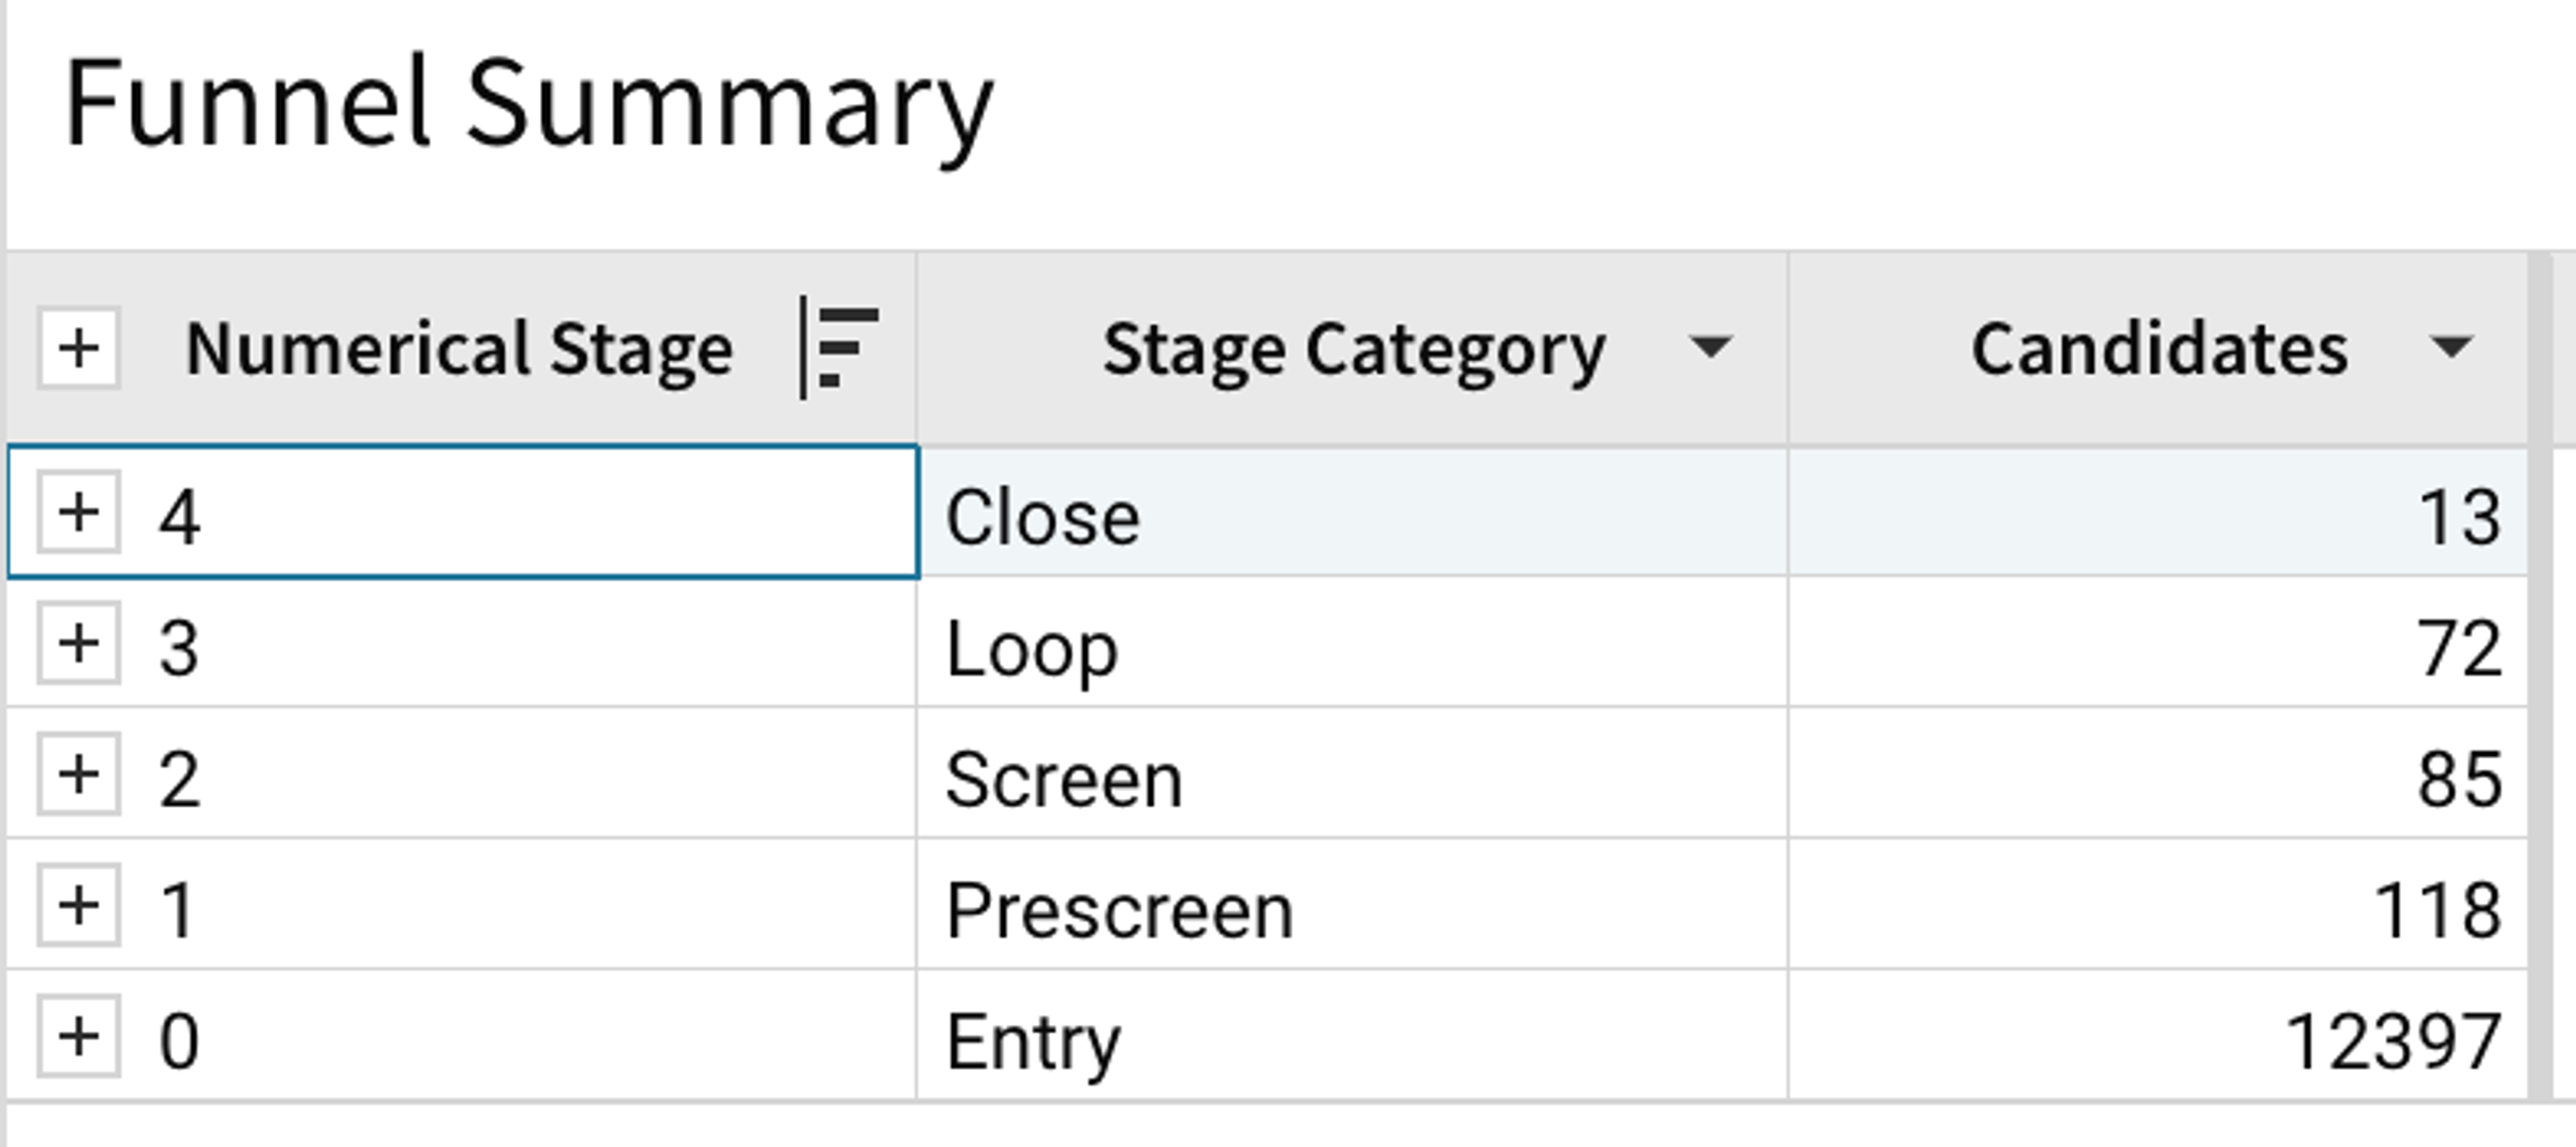
We used a new Sigma feature called Input Tables to create a new table in our warehouse. It allowed us to map any random applicant stage created in the ATS to a normalized stage in Sigma:
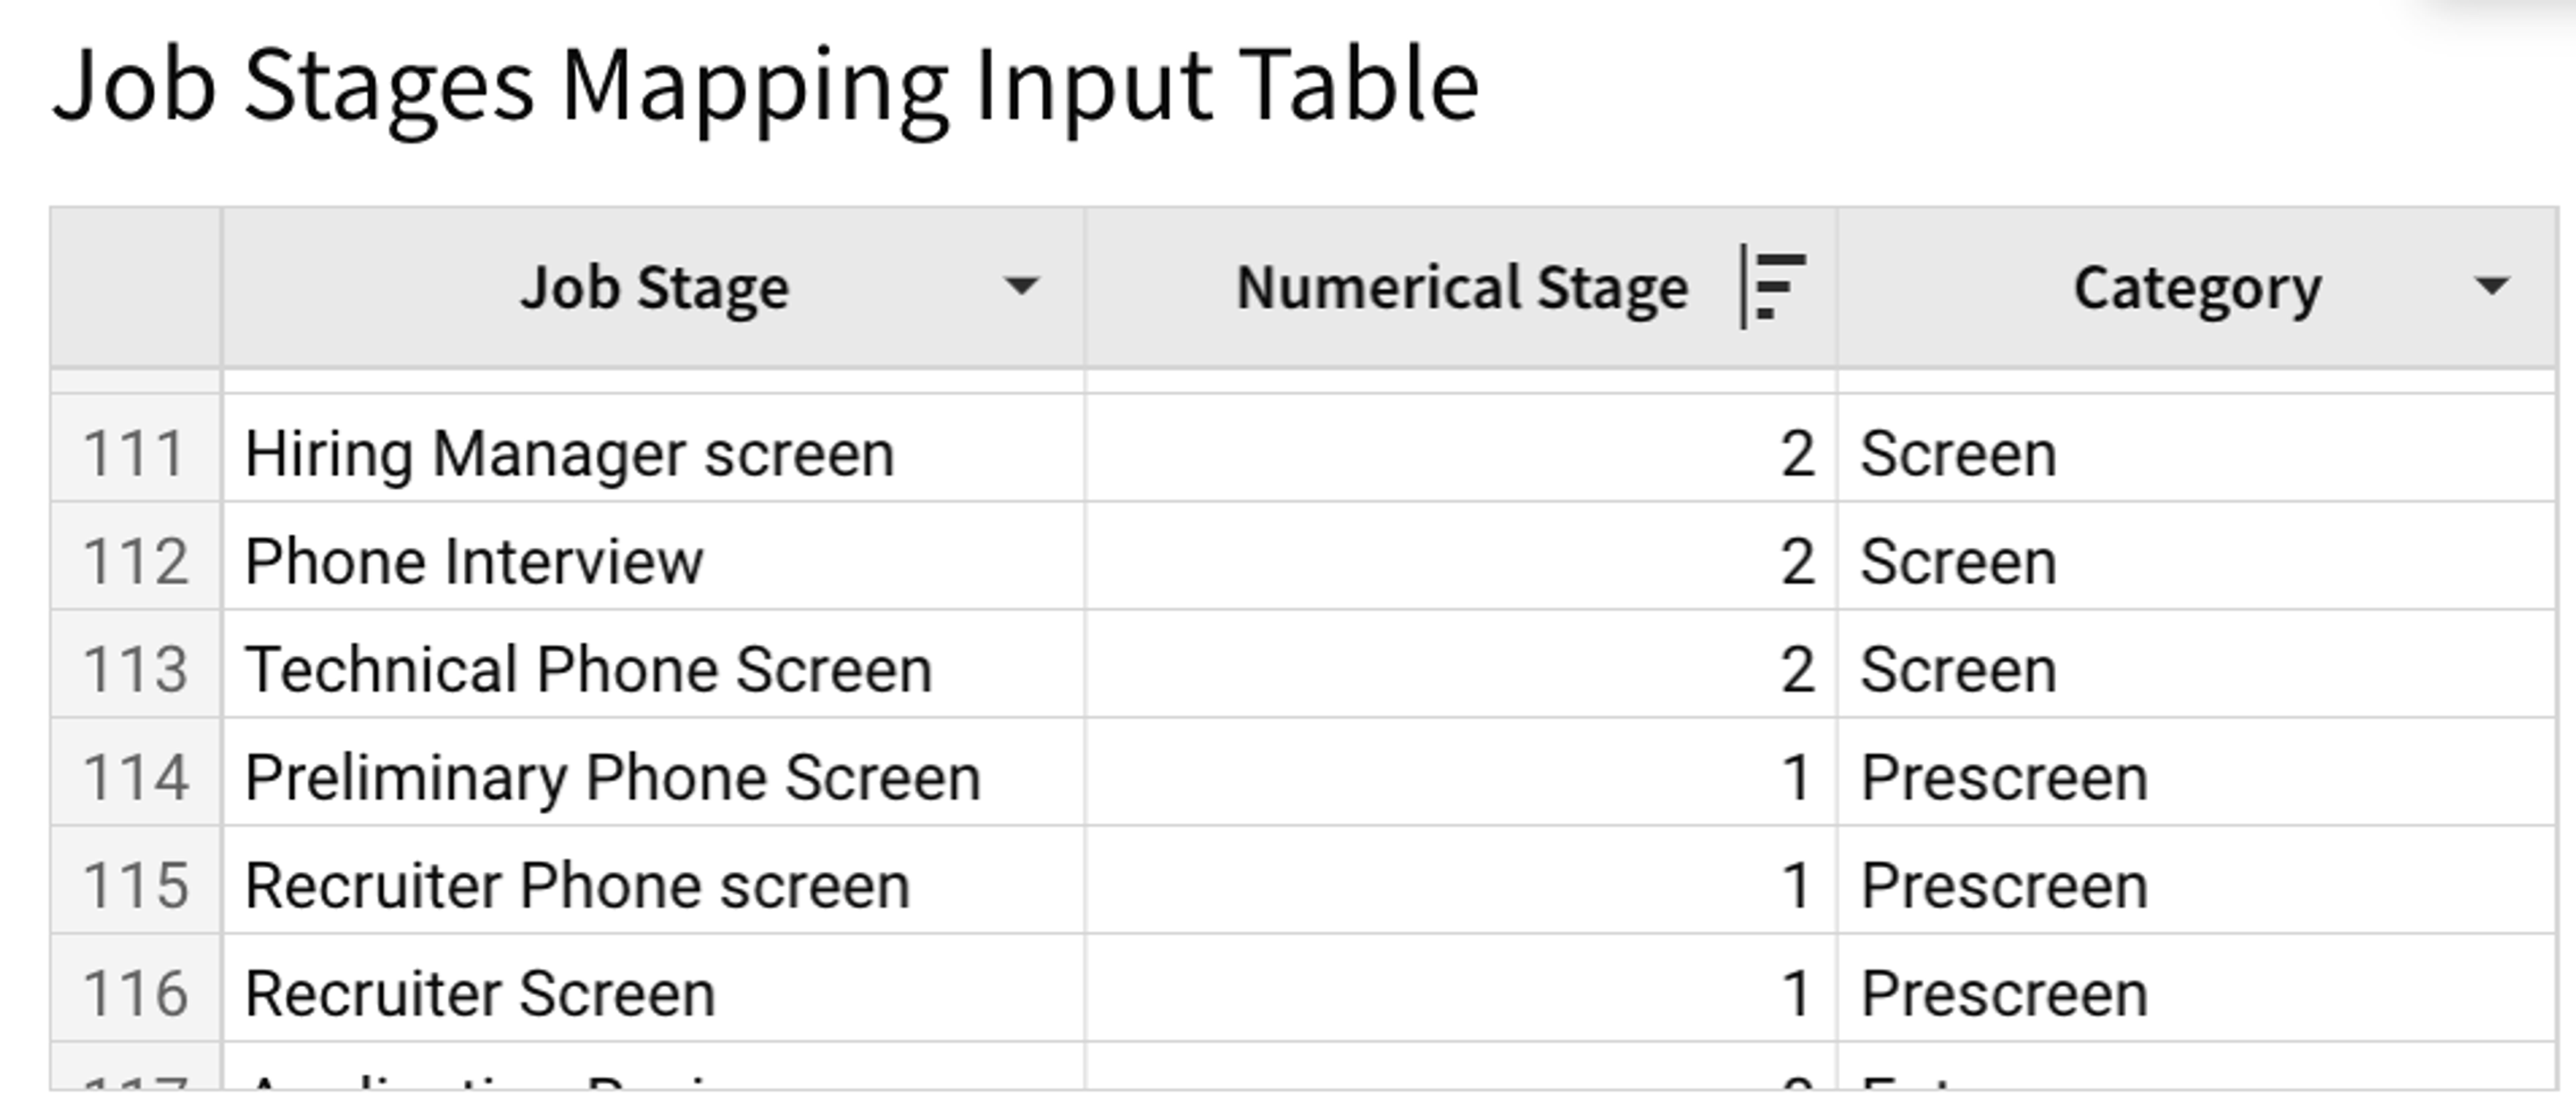
Using the above table, we can generate the table below to show how many candidates are in each stage:
Have you had the feeling that an interviewer is more often than not coming up with a 'Hire' or a 'No Hire' recommendation? Has recruiting complained that that’s the case? Have you felt that a specific interview module is overly negative and might be causing issues?
The data is all there. Here’s what we built:
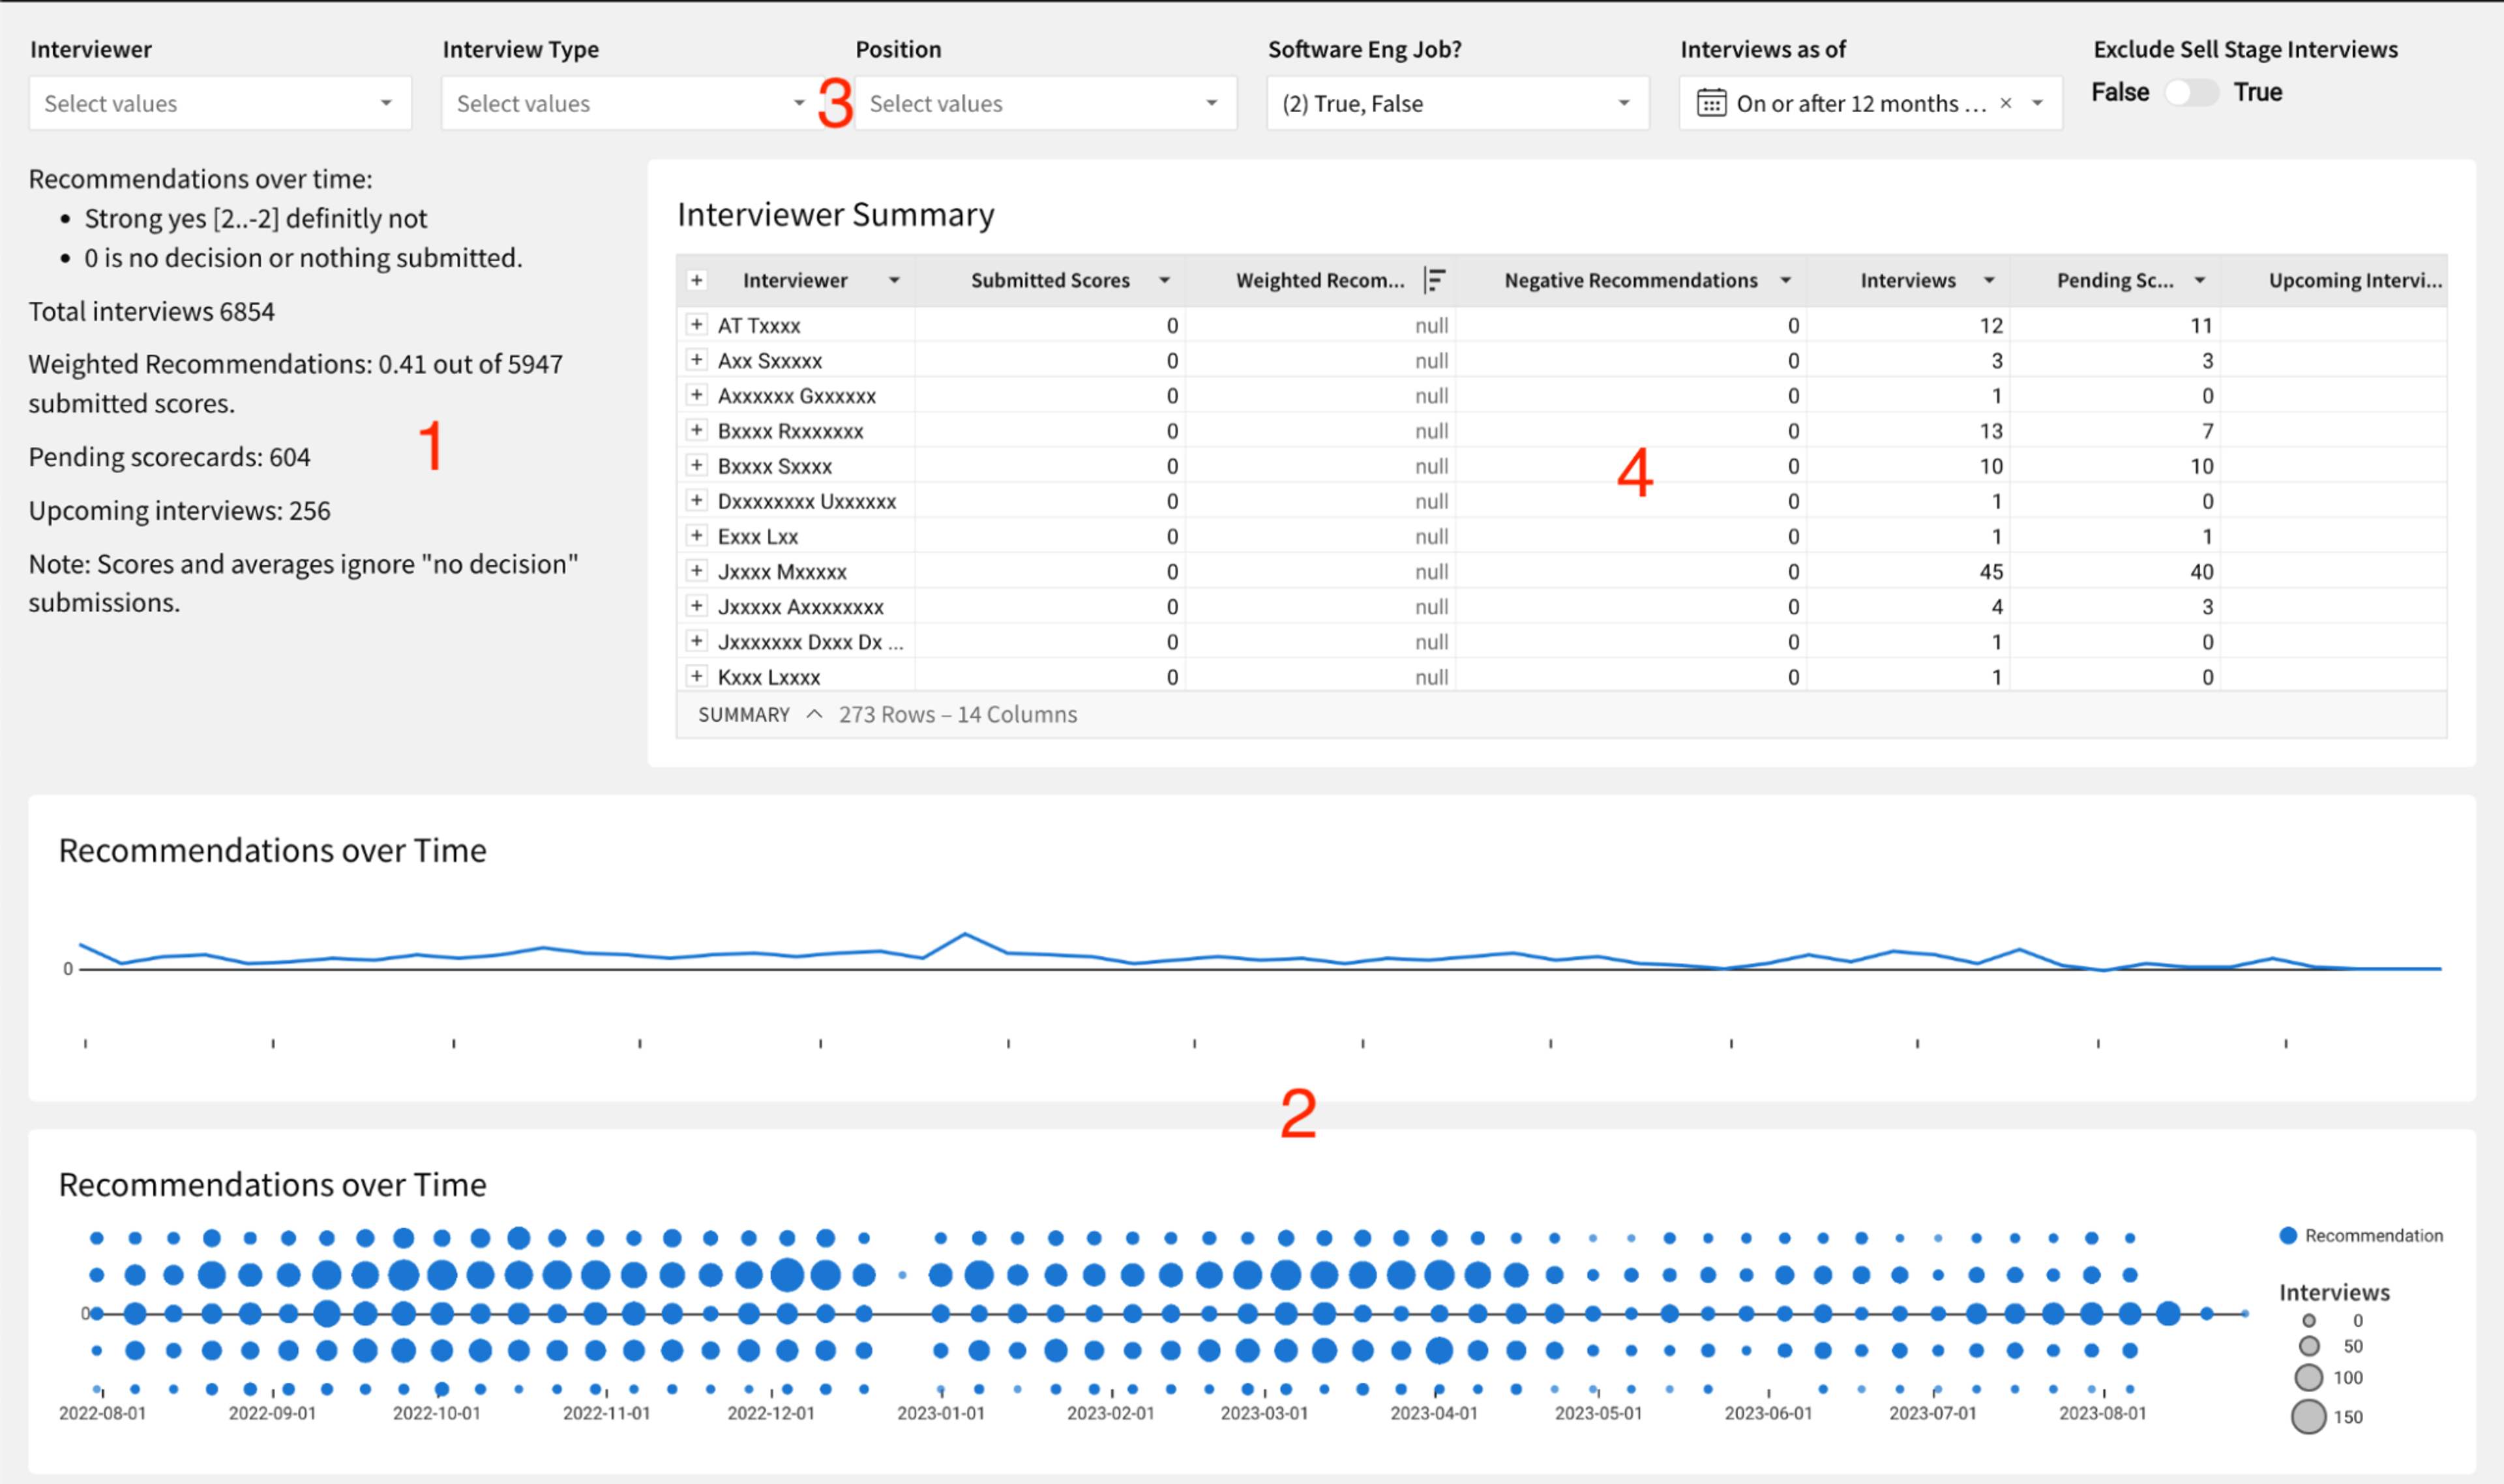
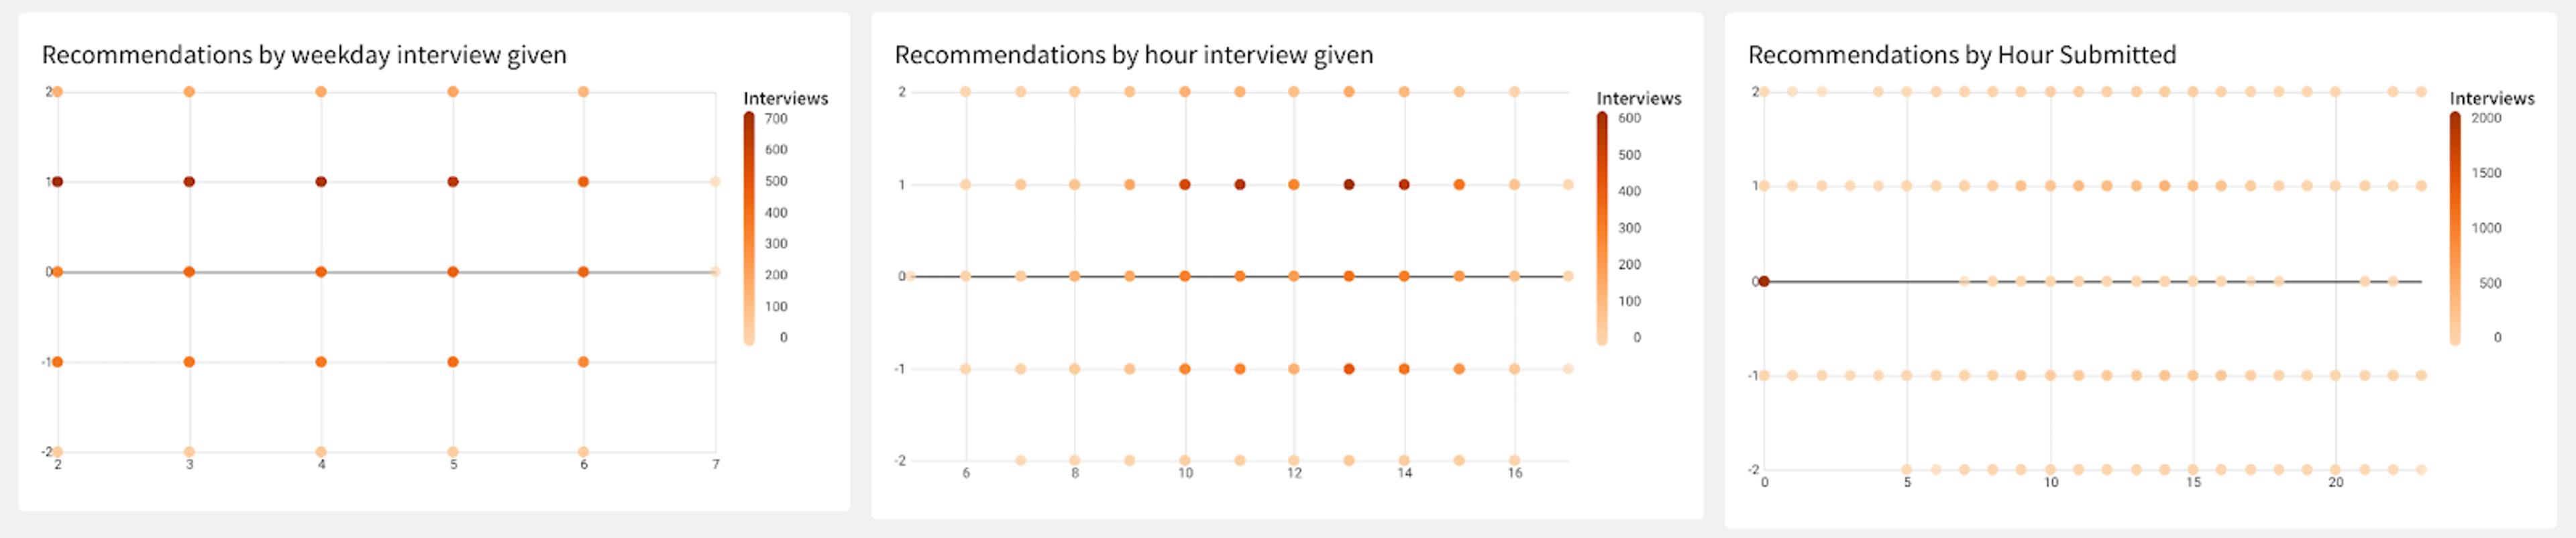
- On the left, you see a summary including the number of interviews and a weighted recommendation (1). The range is from -2 (strong no hire) to +2 (strong hire).
- At the bottom, you can see a visual representation of the recommendations over time. If there’s a change up or down, you can see it visually (2).
- At the top, you can cut responses by interviewer, position, interview, date range, or all of them. You can also add other filters (3).
- In the middle, you can dive into any specific interviewer in the table (4).
- This isn’t a “report” where you have to select parameters, then hit “apply" and wait for a report to be generated, or possibly get emailed the answers. Here you can select options and see immediate answers.
Now when someone says “Joe always votes No Hire” it’s very easy to check. We’ve also added analysis to see if the interview day or hour, or even the time the feedback is submitted, were causing a bias in the feedback. The data is there—you can now find answers to your most pressing questions.
Data Makes the World Go Round
We’ve done a lot more with this setup. Questions and needs keep coming up and since we’ve got the data at our fingertips, with Sigma, we are able to answer them. We have a report for all late feedback submissions. Sure ATS' send email to the person, but we have a condensed report, and have it sent to Slack and ping managers on it to get people to submit the missing feedback.
We’ve done analysis for candidates that received multiple 'No Hire' votes in the loop to see if we can identify issues with our screening. It is easy to identify all of them in Sigma—the data is there: all candidates with more than 4 'No Hire' votes in the loop. We ended up improving the training for our Technical Phone Screeners, and solidifying our criteria for that interview. We also have a weekly summary report including current funnel snapshot for all engineering and sales roles, all current quarter hires, and all late feedback submissions, sent to us weekly.
So to conclude, even though SaaS applications may not be able to anticipate the analysis needs of their users, they can easily embed an exploration tool like Sigma in their workflow. With Sigma, it’s easy to explore, ask questions, and discover what’s going on! How have you used data to improve your recruiting?
Want to learn more? Schedule a demo today!
Read about the missing ingredient to reduce development bottlenecks.