Data Exploration: The Missing Ingredient to Improve Customer Support

Welcome to my blog series on Data Exploration! In this monthly column, I explore the common challenges and pitfalls that functions within an organization often run into and how they can solve for it with Sigma. We are a company of innovators who believe in pushing the boundaries of what’s possible with data, and we also pride ourselves in being the model Sigma customer. Read on.
Let’s admit it: The current customer support tools designed to address customer requests in a timely manner are somewhat limited in scope and functionality. The fact that most solutions on the market don't have access to the rest of the company's data and telemetry, makes it incredibly hard to connect and aggregate data. As a result, complex questions like "How does a new customer ramp up?" go unanswered, leaving users frustrated and dissatisfied.
At Sigma, we love our customers and they love us back. We are obsessed with providing the best-in-class customer support. We integrate customer support with the rest of Sigma’s data, gaining a holistic view of customer interactions and behavior, empowering the Customer Support team to understand customer onboarding, identify pain points, and optimize the support experience. We believe that great support is part of the product, and while we hope customers never need to use it, we realize the product is not perfect. If you ever used our product or went through the free trial, you’d know that we usually answer our live chat in under a minute during business hours.
Now, that didn’t just happen. It wasn’t easy to do. We went through a period of rising support response times, where it was clear that we had more and more customers using the product, asking questions, but not enough support team members ready to answer questions.
We used Sigma to help us answer a few key questions and help us model our growth.
- We identified how many incoming conversations each new customer (company) was going to bring in, and what staffing we’d need based on sales projections. We also identified the different ticket volumes we get from new users compared to existing users and baked that into our calculation.
- We created a live dashboard that sits next to the support team and shows real time data on support ticket volume, response, and resolution times, current CSAT (Customer Satisfaction) rating for the day and how it compares to the last 24 hrs, week, and month.
- For executives, we also set up an email report that summarizes the day’s responsiveness to conversations, as well as the day’s CSAT scores.
- We collected metadata from support tickets such as the user sentiment, root cause of the issue, and how the issue was resolved. We then used a tagging system to identify product friction and inform our roadmapping process. This surfaced things that typically wouldn’t even be flagged as bugs, but in aggregate were areas where we could make the product more intuitive.
- We implemented a practice of including Support Engineers in engineering planning meetings to provide valuable insights and trends from customer tickets using the Sigma product. This allowed the relevant teams to stay informed and make informed decisions that directly impact Sigma's roadmapping efforts. Additionally, we closely monitor product feature releases to identify any documentation gaps or the need for additional materials. All of this ticket volume data, along with new bug tickets and requested features from customers, is tracked using Sigma's product. By proactively identifying these issues early on, we empower our customer Support team to be well-prepared and address them promptly, preventing them from escalating into bigger problems.
Laying the Groundwork
Sigma allows us to do some incredible data analysis without writing any SQL. Our customers think of it as a “spreadsheet on steroids.” You can use the data in your warehouse to get incredible insights, but first the data needs to be in the warehouse.
For the analysis, we have used two main datasets here:
- Our own product’s analytics. We log these, and send them to our own Snowflake instance.
- We use Intercom for in-app live chat support. We sync the data from Intercom into our Snowflake warehouse using Fivetran.
Once these two datasets are in place, we can start doing some interesting things with them.
[Note: In this post, I use “Customer” to denote a company, and “User” to denote an individual.]
How Many Technical Support Engineers do we Need this Year?
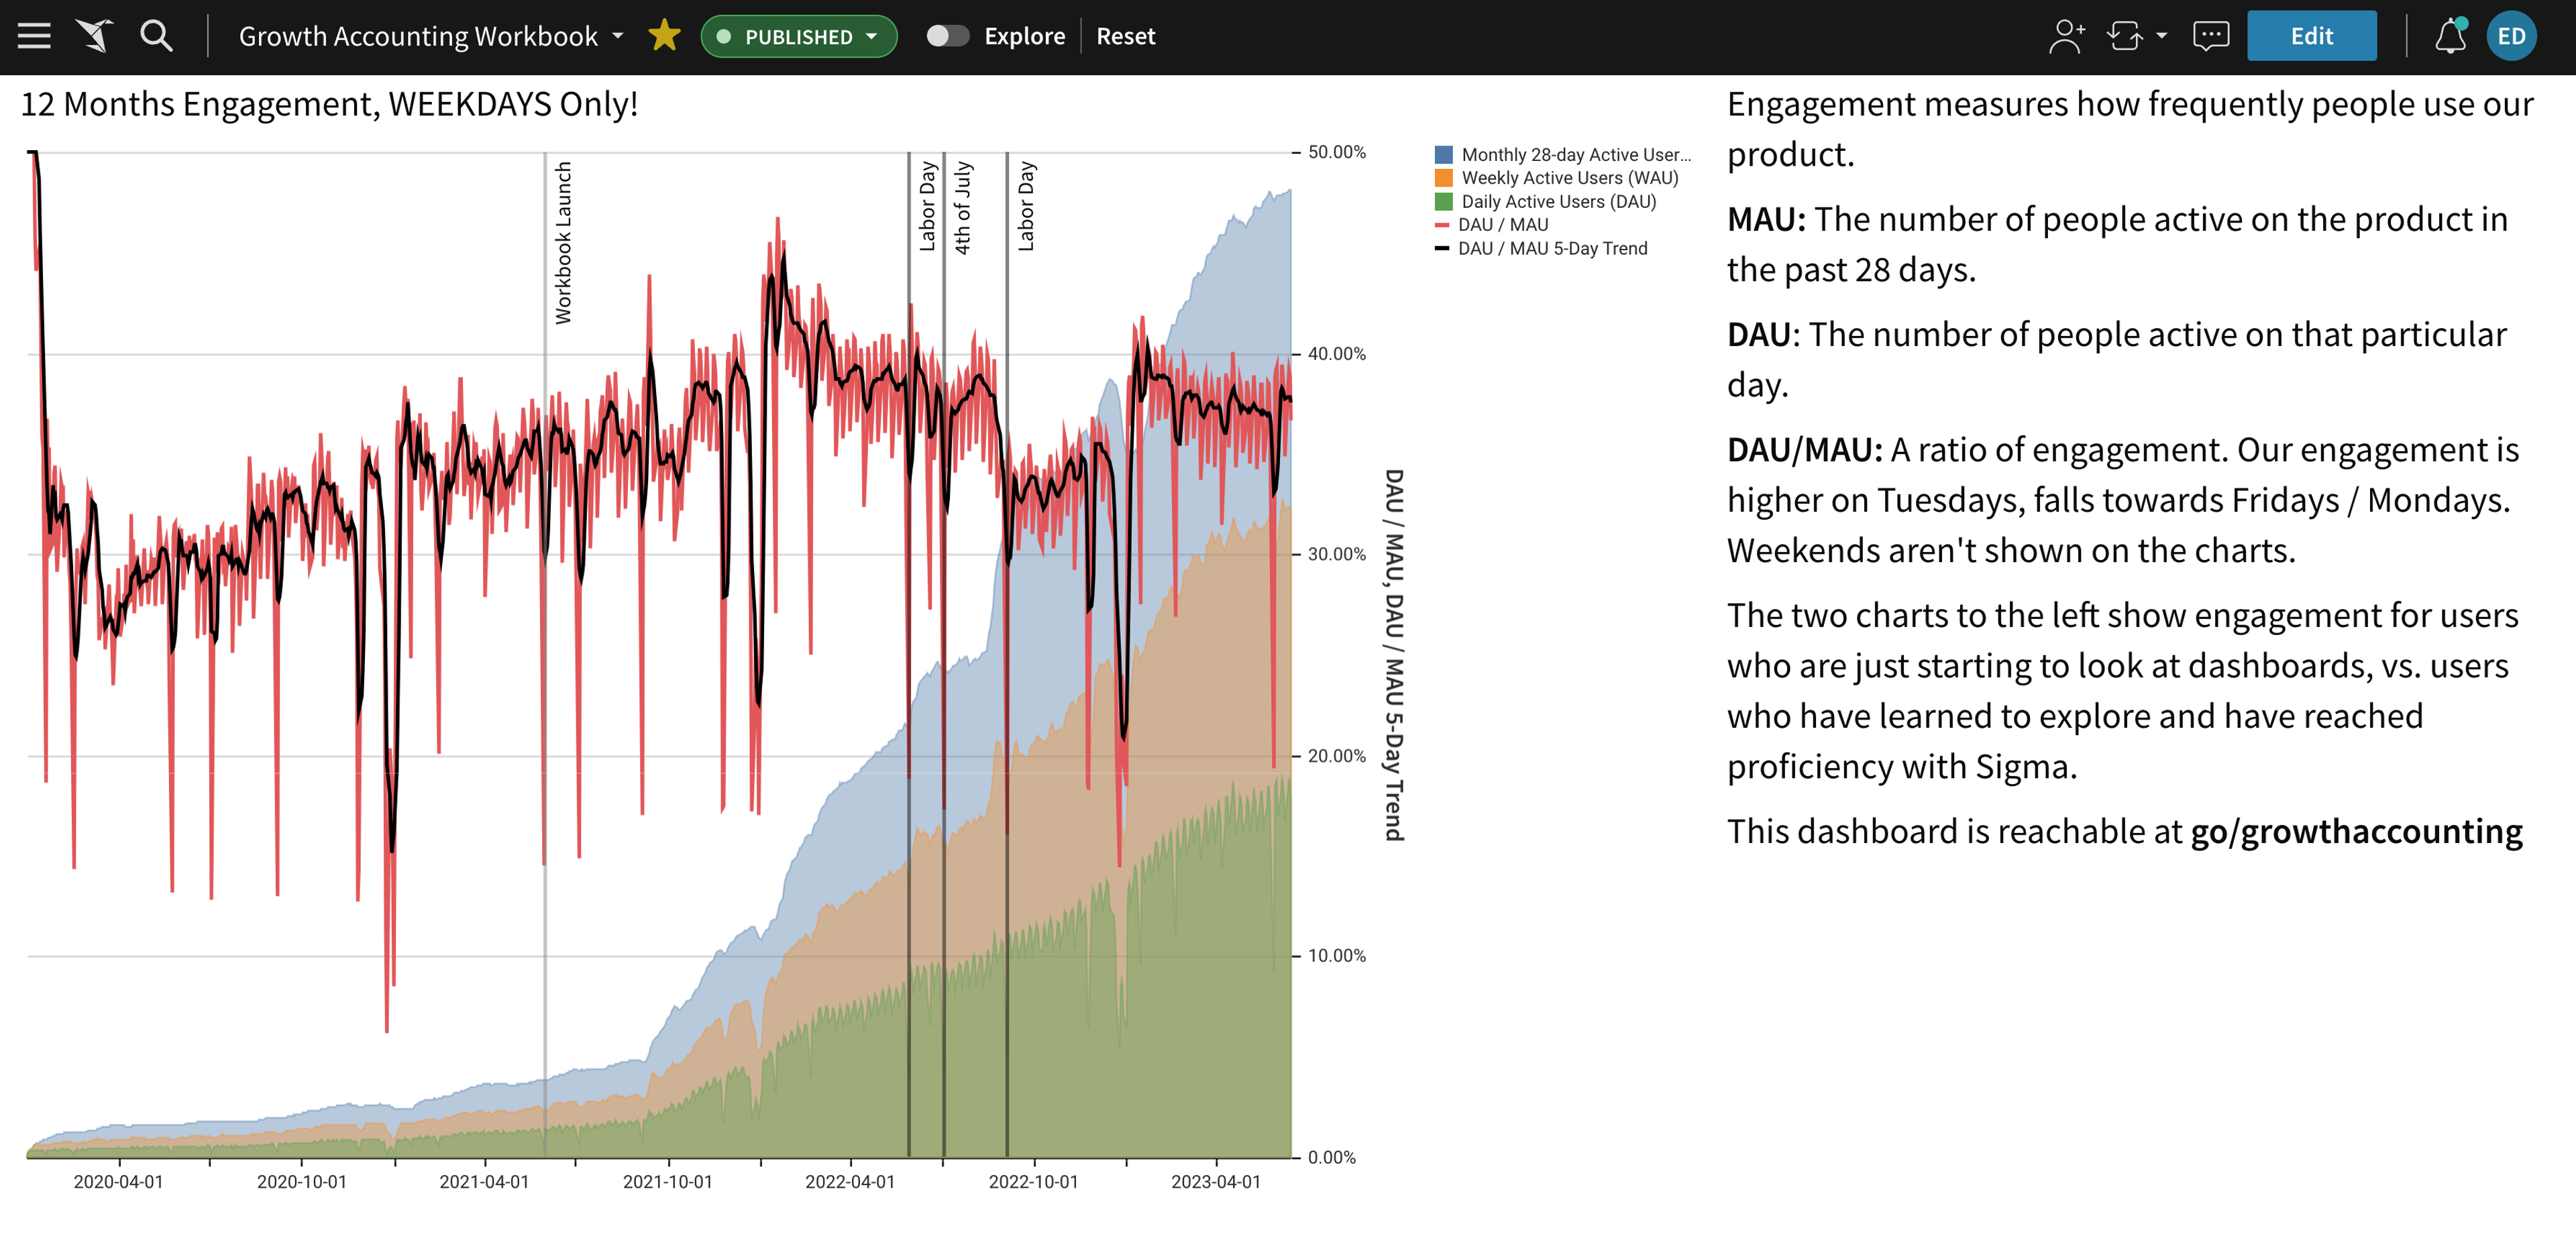
First, we looked at the last two years of data. Instead of looking at general growth of ticket volumes, we could look at individual customer signups. We could treat each customer joining us as if they joined in month 0 instead of the month they actually joined. To illustrate this, imagine the following companies:
- Company A: Started using Sigma in February
- Company B: Started using Sigma in June
We can treat Company A’s February as Month 0, and company B’s June as Month 0. This will allow us to look at all the data in aggregate and get statistical data from the entire cohort.
From this we learned that:
- Large user growth will happen in the first few months. This isn’t surprising as companies will set up and onboard users onto the platform.
- Ticket volumes per active user will be higher in the first few months. Once more users join and the company has learned to use Sigma, these drop and remain at a steady pace, possibly due to new users joining the company, and new features being released.
- These two forces (rising users, dropping tickets) act in opposition to keep a pretty stable ticket/company number for the first six months, dropping by about 20% after that to a new steady state.
Given our quarterly sales projections, expected ticket per Support Engineers per day, and some assumptions about efficiency improvements, we could forecast our support needs for the coming year!
What’s more, the model does not require manual recalculation. The data is continuously refreshed in our warehouse. The workbook we created in Sigma can be used to recheck whether we’re still tracking to the estimates we put in place, and to filter to any specific cohort of customers to see whether our assumptions have changed. We’ve also used enrichment data to filter customers by size to check whether smaller and larger customers change the model in any significant fashion (other than the number of users they bring on).
Monitoring our Customer Support Situation
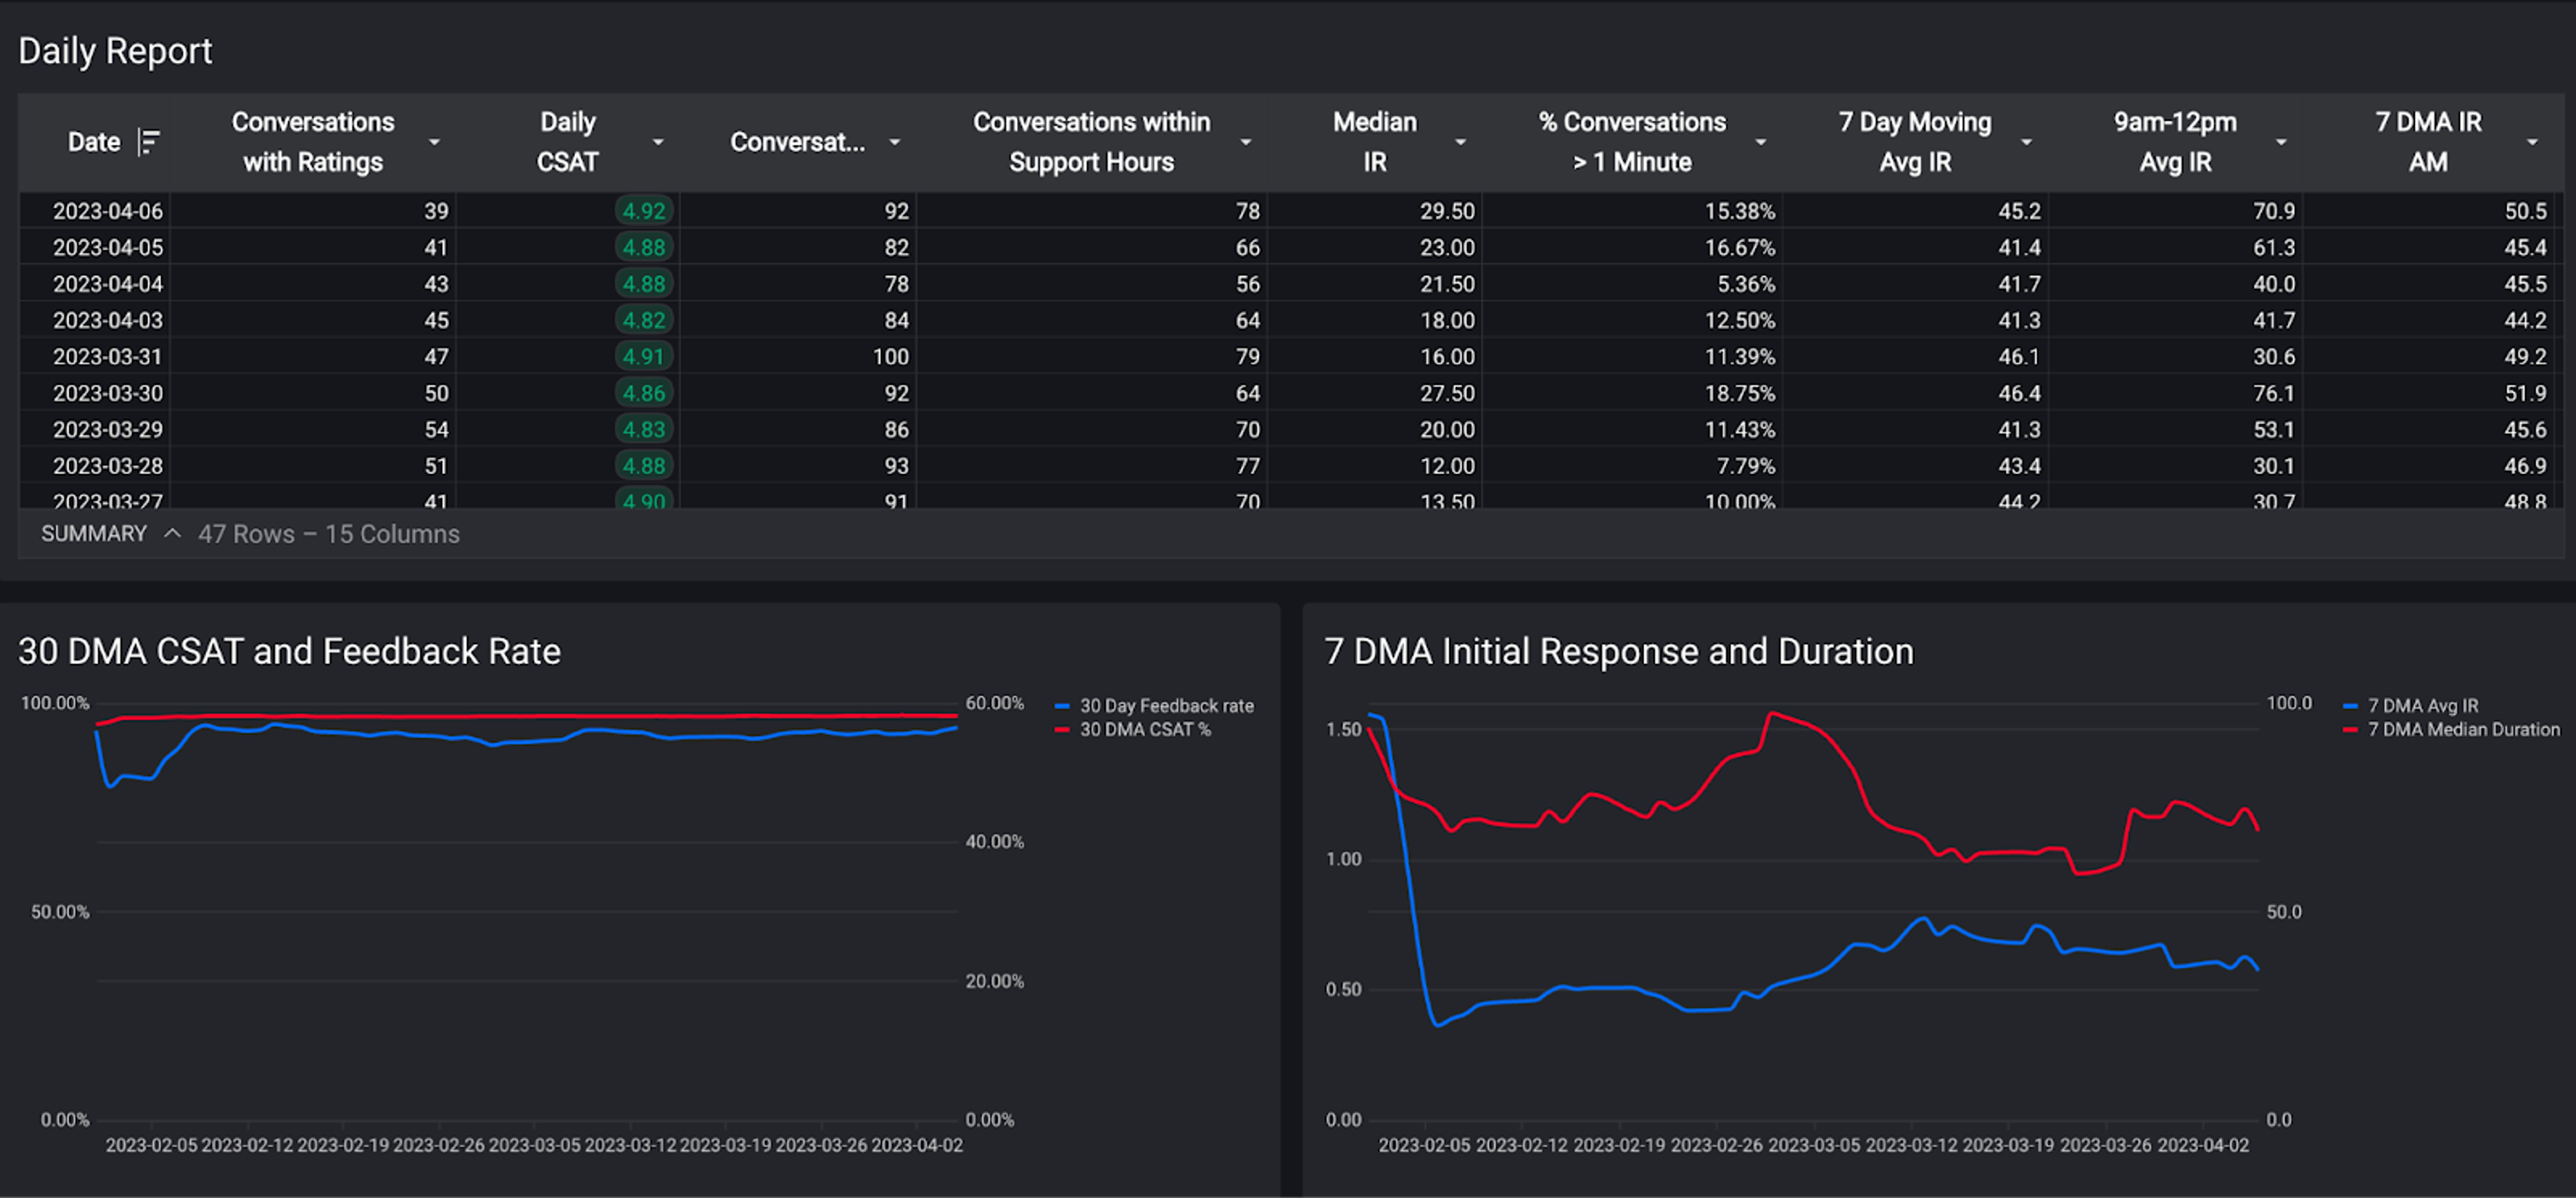
We built a report in Sigma that added a summary row for every day of data, showing the average responsiveness and average CSAT scores for that day, as well as the last few days. This allowed us on a daily basis to understand if we were improving or slipping.
As we looked at this, we kept having questions. For example, if the average responsiveness was two minutes, was it because one conversation took an hour to respond to while all other conversations were under a minute?
Over time we evolved the table:
- We added a column that shows how many conversations took over a minute to respond to.
- We also added how many conversations were started outside of business hours (when we don’t provide support) and took those out of the responsiveness calculation.
- We added a count for how many conversations had a CSAT score, to help explain the average CSAT score, as well as the total number of conversations. This helped when looking at an average of 4.8 CSAT over a total of 50 conversations, but only 30 were rated.
As a result, we experienced the power, ease, and simplicity of Sigma, first-hand—adding each of these was as simple as editing the report and adding a spreadsheet column. The report would be emailed to us daily, and we’d be able to see the data. If we had questions. we could go check what happened today.
Engaging the Team
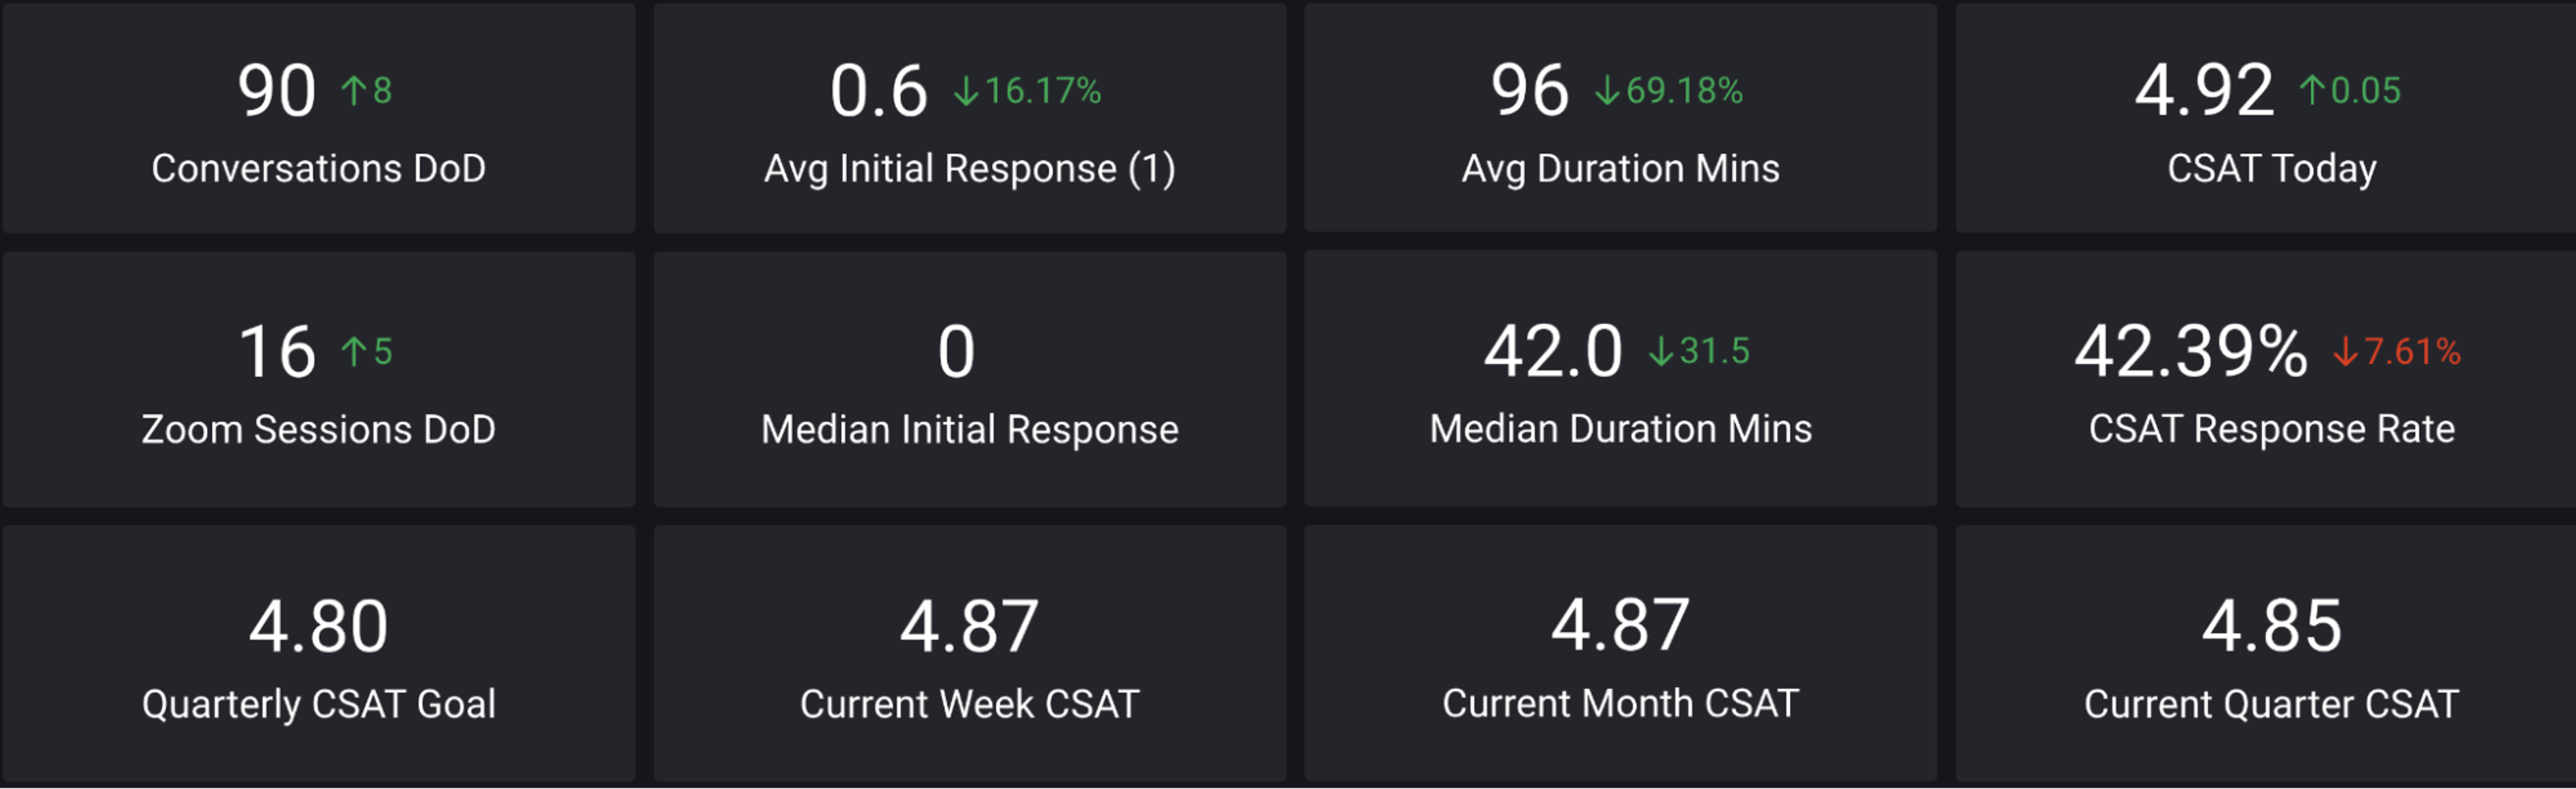
One of the things we did was create a dashboard for the team. We added the day’s queue, ticket count and current average CSAT score in large type to the board. This allowed the team to see where they stand and help rally them around the group goal of improving customer satisfaction. We were able to see the stats in real-time and in the event of unusual volume influx or when we had extra complex tickets, we were able to call for extra set of hands to help out.
Identifying Trends and Product Friction
As customers report bugs, there’s a clear path of filing and handling them by the product team. What’s more interesting are the things that don’t get reported. Support is sitting on a treasure trove of product friction, things that could make your product great, but never quite rise to the top. Imagine that a user contacts support and says: “I don’t know how to schedule a report.” Support shows them, and they go away happy, giving support the coveted 4.8 CSAT rating. Everyone’s happy, right? Now imagine more users contacting support with the same issue. This most likely means there are a hundred more such users who just gave up. It’s product friction or a bad design that will never get reported as a bug.
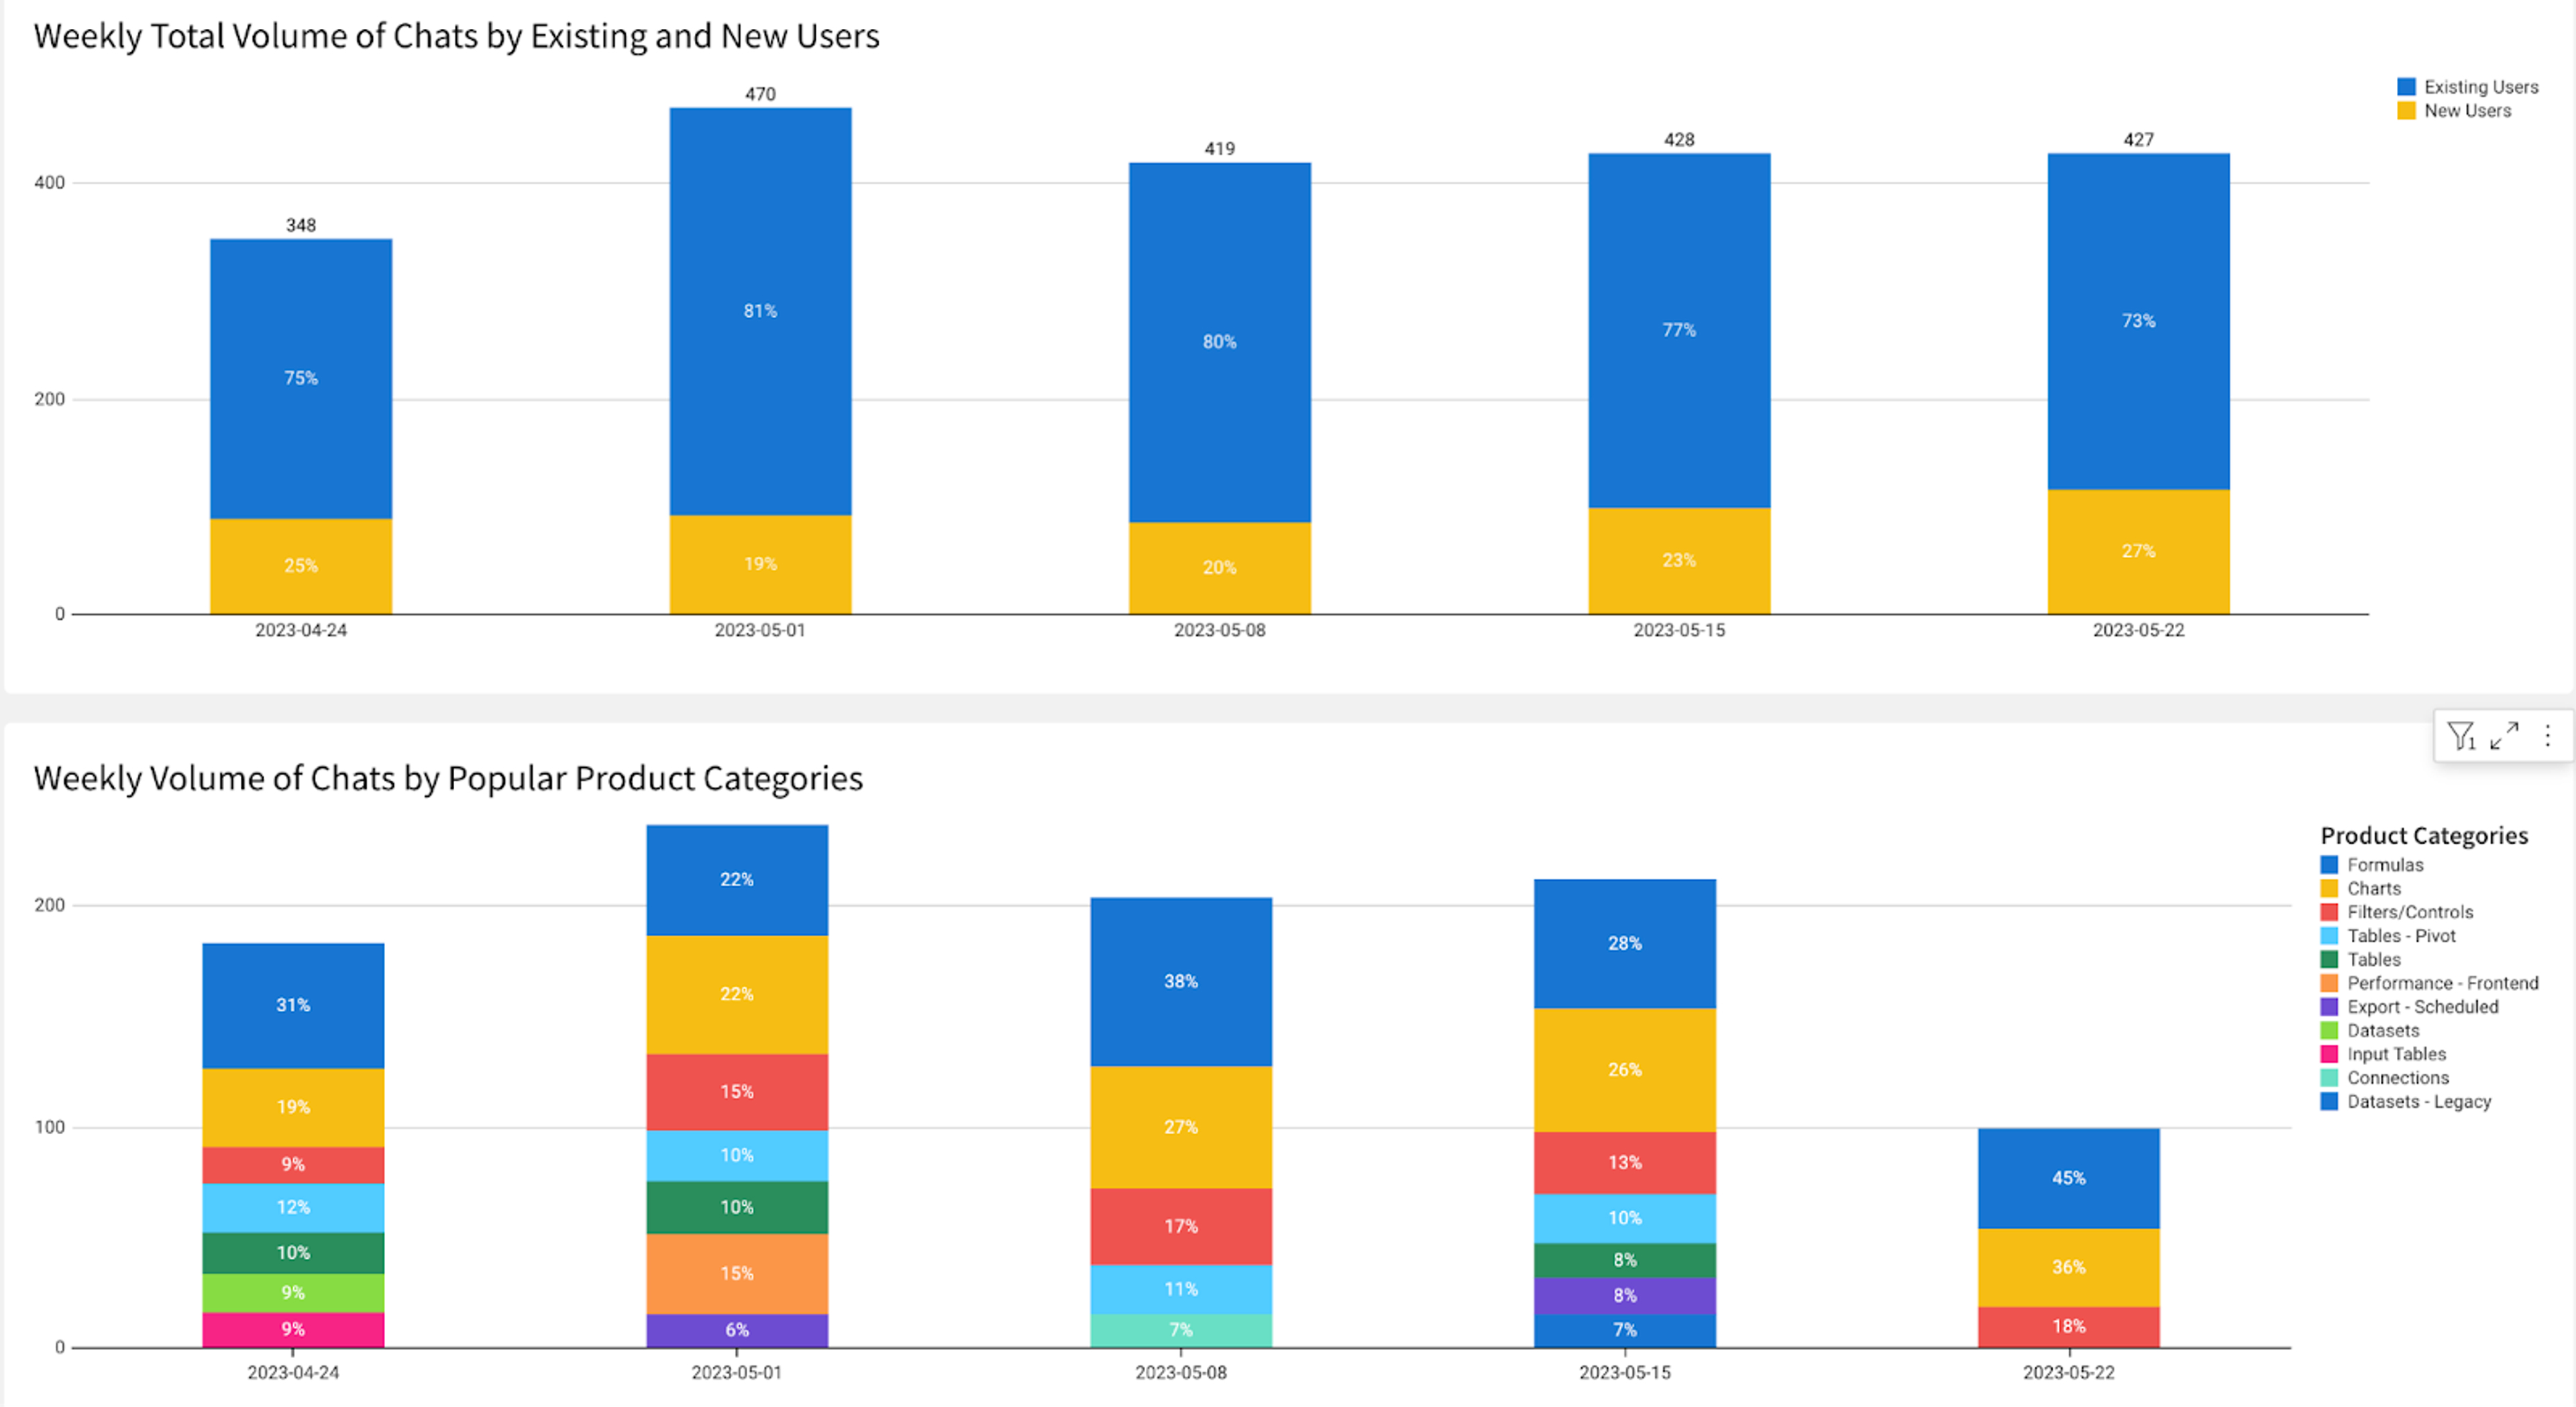
In order to solve for such misses, we’ve added attributes to our Sigma support conversations. Our Support Engineers tag and classify conversations so that we can analyze these quantitatively. Information such as the issue type (e.g., bug), the method of resolution (e.g., explanation) as well as the root cause (e.g., missing documentation) is being added, and the metadata gets synced into Sigma so that we could run interesting reports, such as:
- Areas that get significantly more questions than others. These might not be noticed by individual Support Engineers but they'd be noticed in aggregate once you look at the data.
- Areas that suddenly emerge, i.e., a new product change that was introduced and might be causing issues (or excitement).
- Areas that we can create more documentation for, or compliment with a tutorial that will improve the user onboarding experience and hopefully minimize support tickets.
We share these reports across the company and have Support Engineers join Engineering meetings to present the relevant information based on their area of the product. This keeps the engineering team connected to frequent feedback and questions from our users and effectively impacts the product roadmap.
Data Makes the World Go Round
Sigma made it very easy to use data from our support tool to predict our hiring needs based on user behaviors. It also allowed us to track how we were doing so that we could course correct if needed, and to identify areas of the product that we could improve to make it more intuitive.
How have you used data to improve your customer support?
Want to learn more? Schedule a demo today!


