Announcing Metrics in Sigma

A BI classic, reimagined for the spreadsheets world
We’ve finally done it: Sigma has metrics! You can now encapsulate any aggregate calculation—such as profit margin, churn rate, or net present value—into reusable fields that you can drag and drop into your workbooks.
Many had wondered how it was even possible for Sigma, a BI tool, to have been adopted by the likes of DoorDash, US Foods, and Blackstone without metrics. Don’t all BI tools require you to define metrics before being able to run any reports at all?
The answer is that Sigma isn’t just a BI tool. Up until now we had been strictly focused on building out the first-ever spreadsheets interface on top of live cloud-scale data. Our customer adoption has proven that there is a massive amount of value in doing so, even without metrics. After all, there are over a billion spreadsheet users out there in the world, and Excel and Google Sheets don’t have metrics.
The popularity of the interface allowed Sigma deployments to grow rapidly. And our customers increasingly were looking for ways to reuse business logic and make data analysis more consistent and scalable among their growing user bases. We knew that it was finally time for metrics.
The challenge was: how do we go about introducing a classic BI concept—a metric—into the spreadsheets world?
Founding Principles
To achieve that, we first decided on a few founding principles:
1. Metric definitions should be owned by subject matter experts, not engineers. Defining a metric should be as easy as writing a spreadsheet formula.
2. Metrics should be optional, not required. They should save you time, not get in your way.
3. If you update a metric, it should update everywhere the metric is used. Metrics should help your team speak the same language as the business evolves.
It took quite a number of iterations in the development process to get this right, but last month we arrived at a place we’re really proud of. Without further ado, let’s jump in.
How Metrics in Sigma Work
Creating Metrics
Creating a metric is really simple. All you need to do is type in a formula and give it a name. The formula editor uses the same suggestions, auto-complete, in-product documentation, and field coloring that our users are accustomed to from our workbook editor.
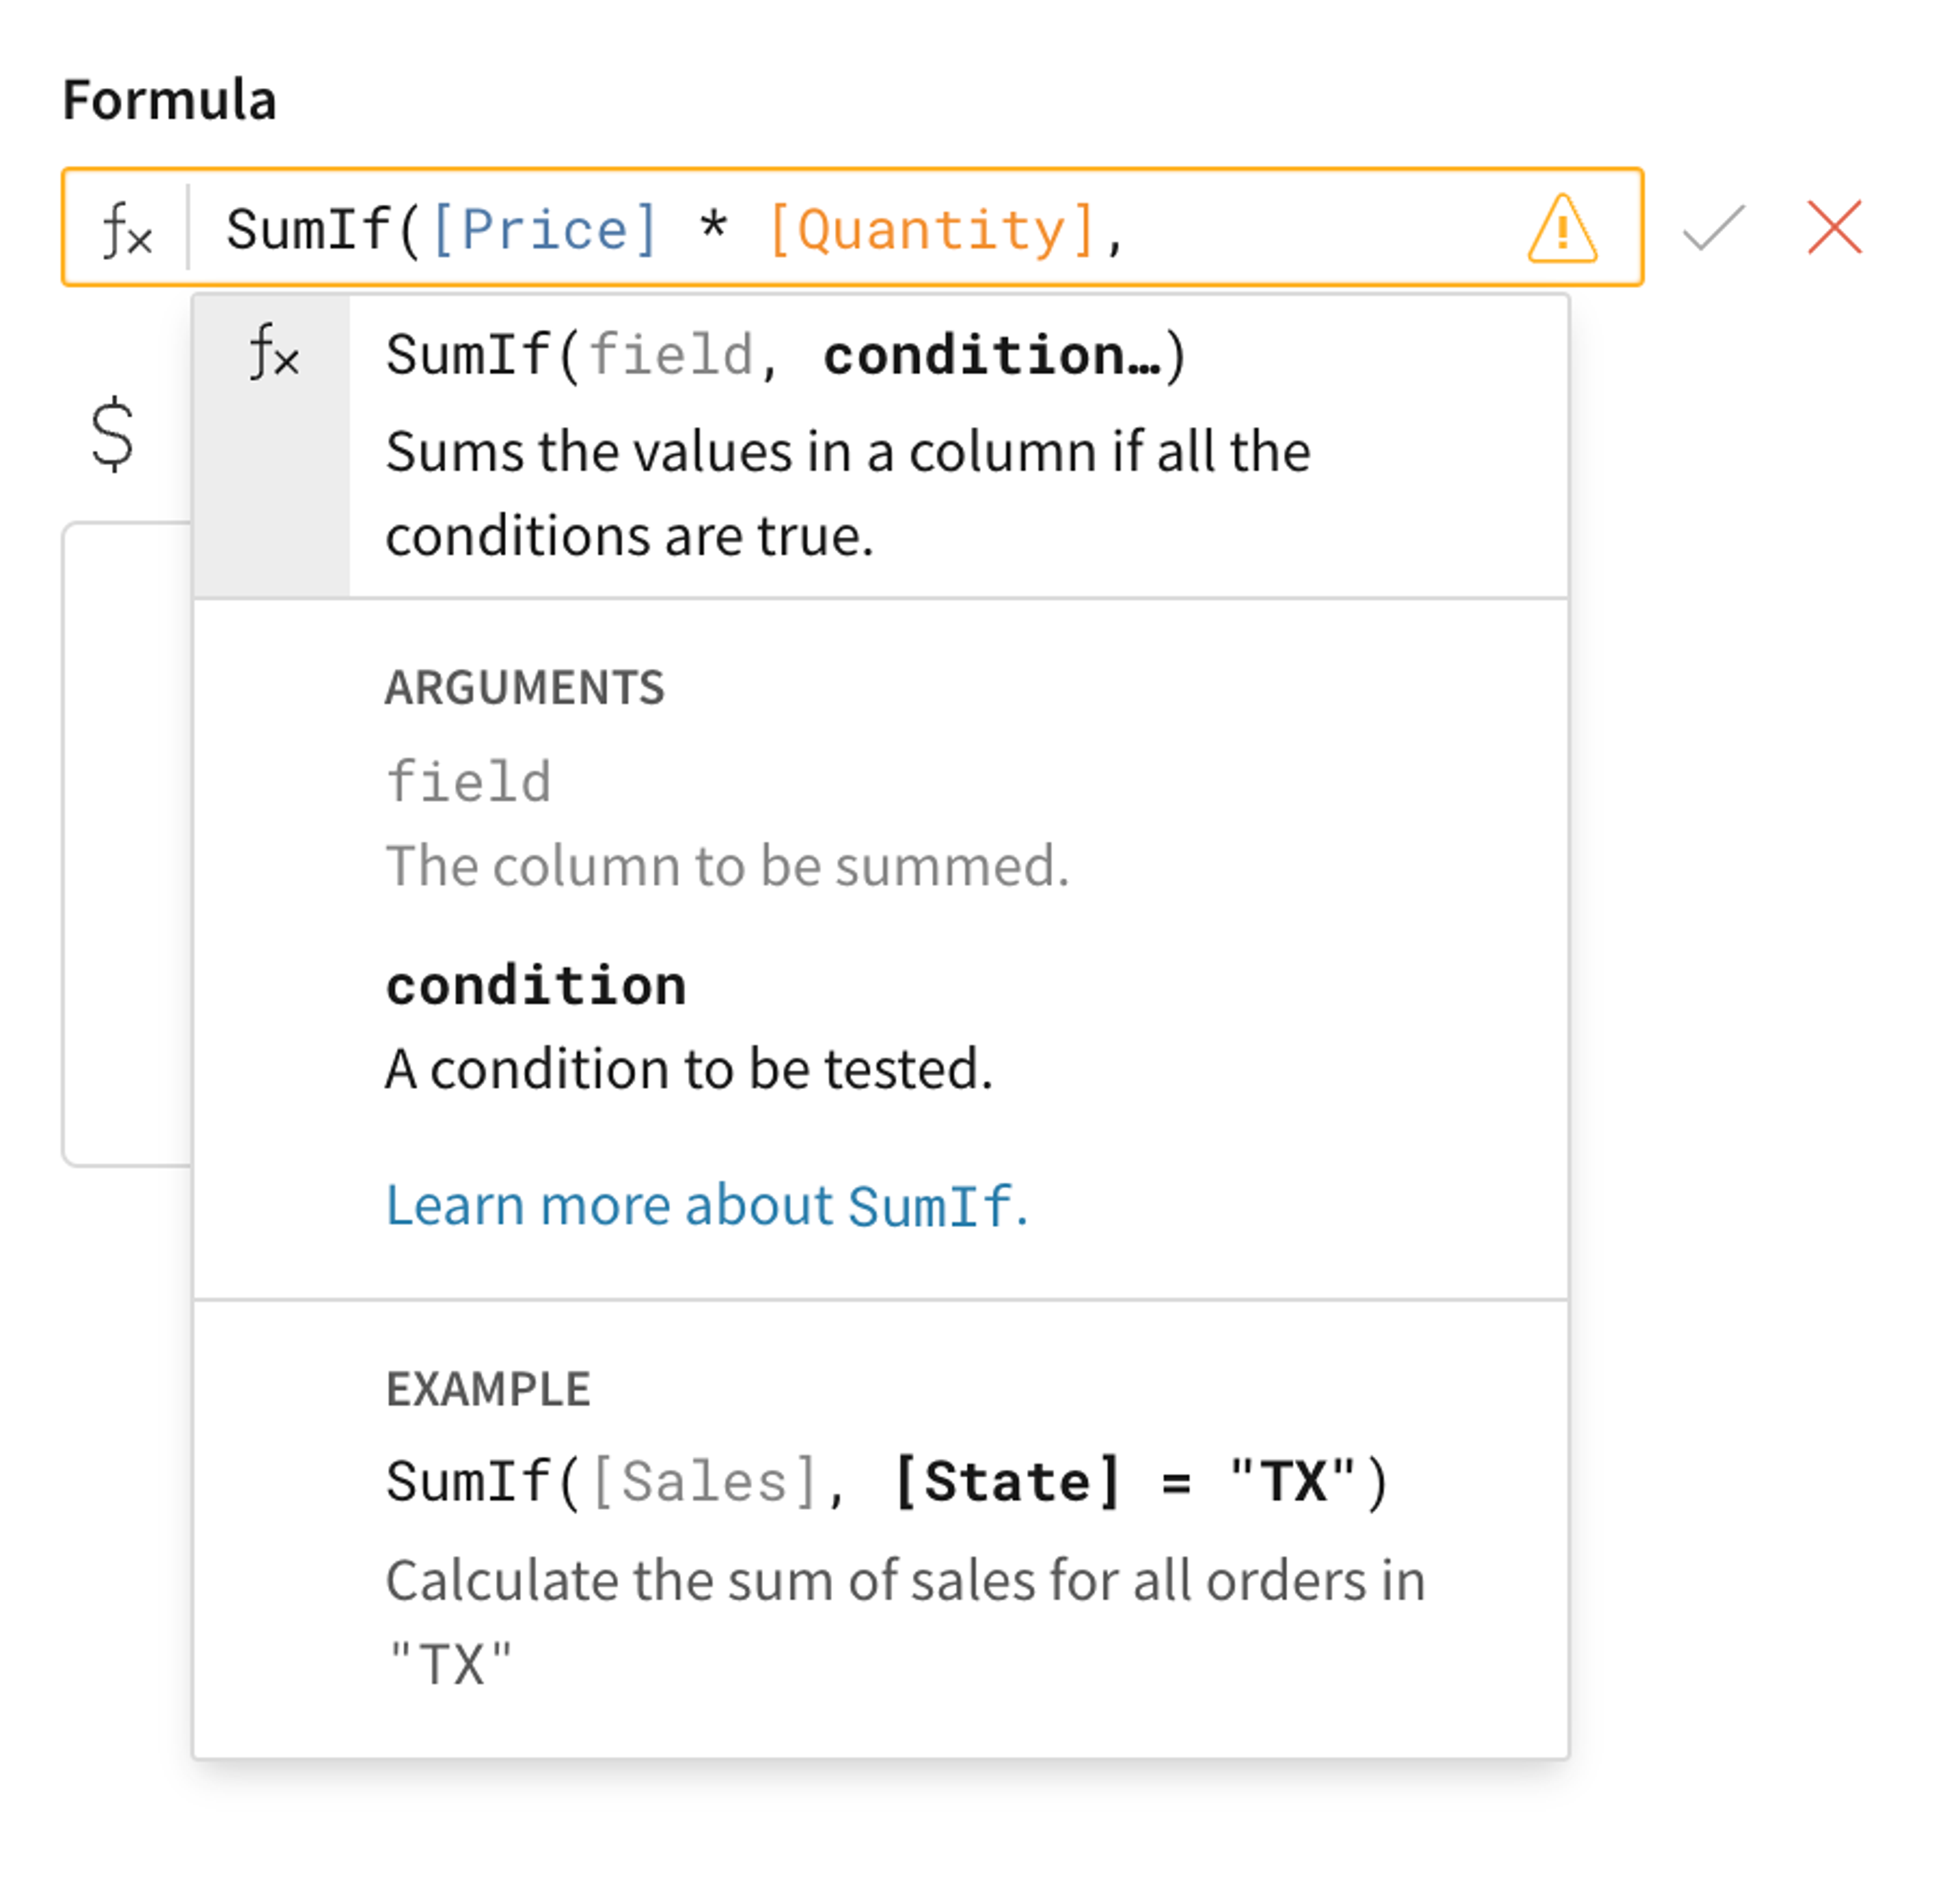
Any Sigma functions are valid in a metric definition—conditional, mathematical, textual, aggregate, even lookups. The only requirement is that all functions should at some point be rolled into an aggregate function. For example, this formula defines a new metric I’m calling “Total Revenue This Month”:
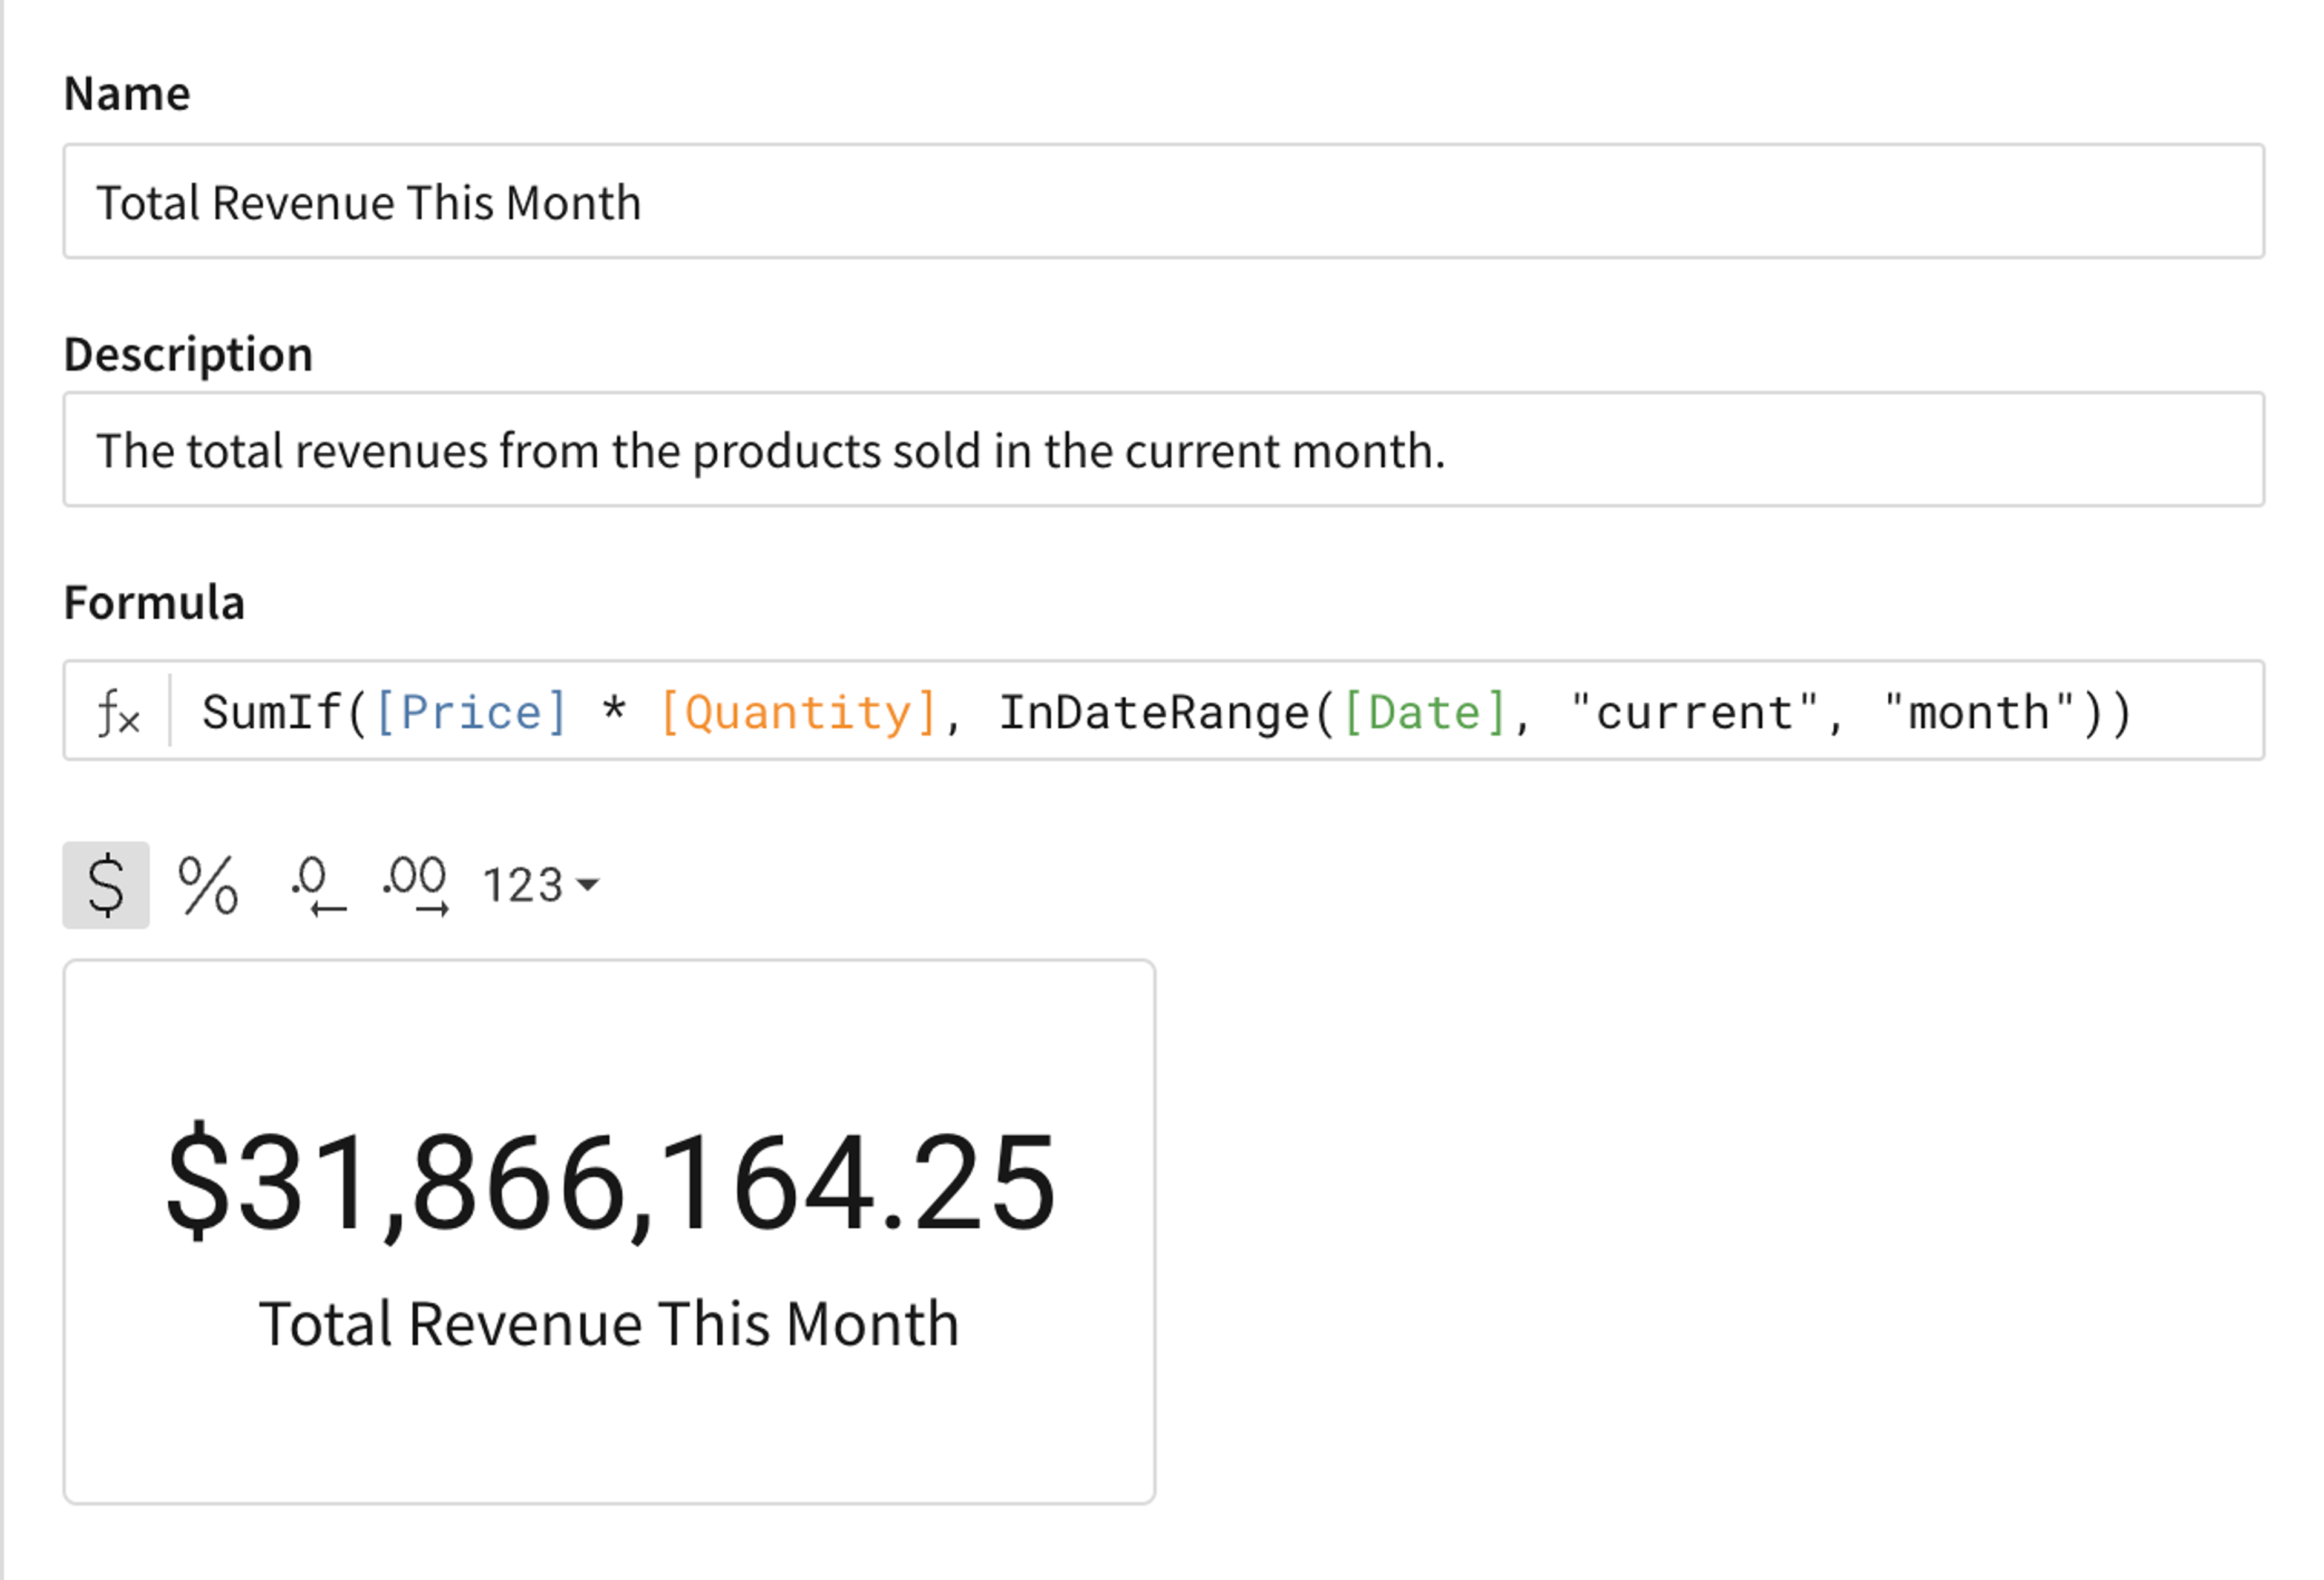
You can also add some nice optional fields, like a description or a format to be applied everywhere the metric is used. We also show you a quick preview of the result. To save it, you just click the Publish button. Easy peasy!
Using Metrics in Workbooks
This metric we created will now be visible in any workbook that uses the table or dataset associated with it.
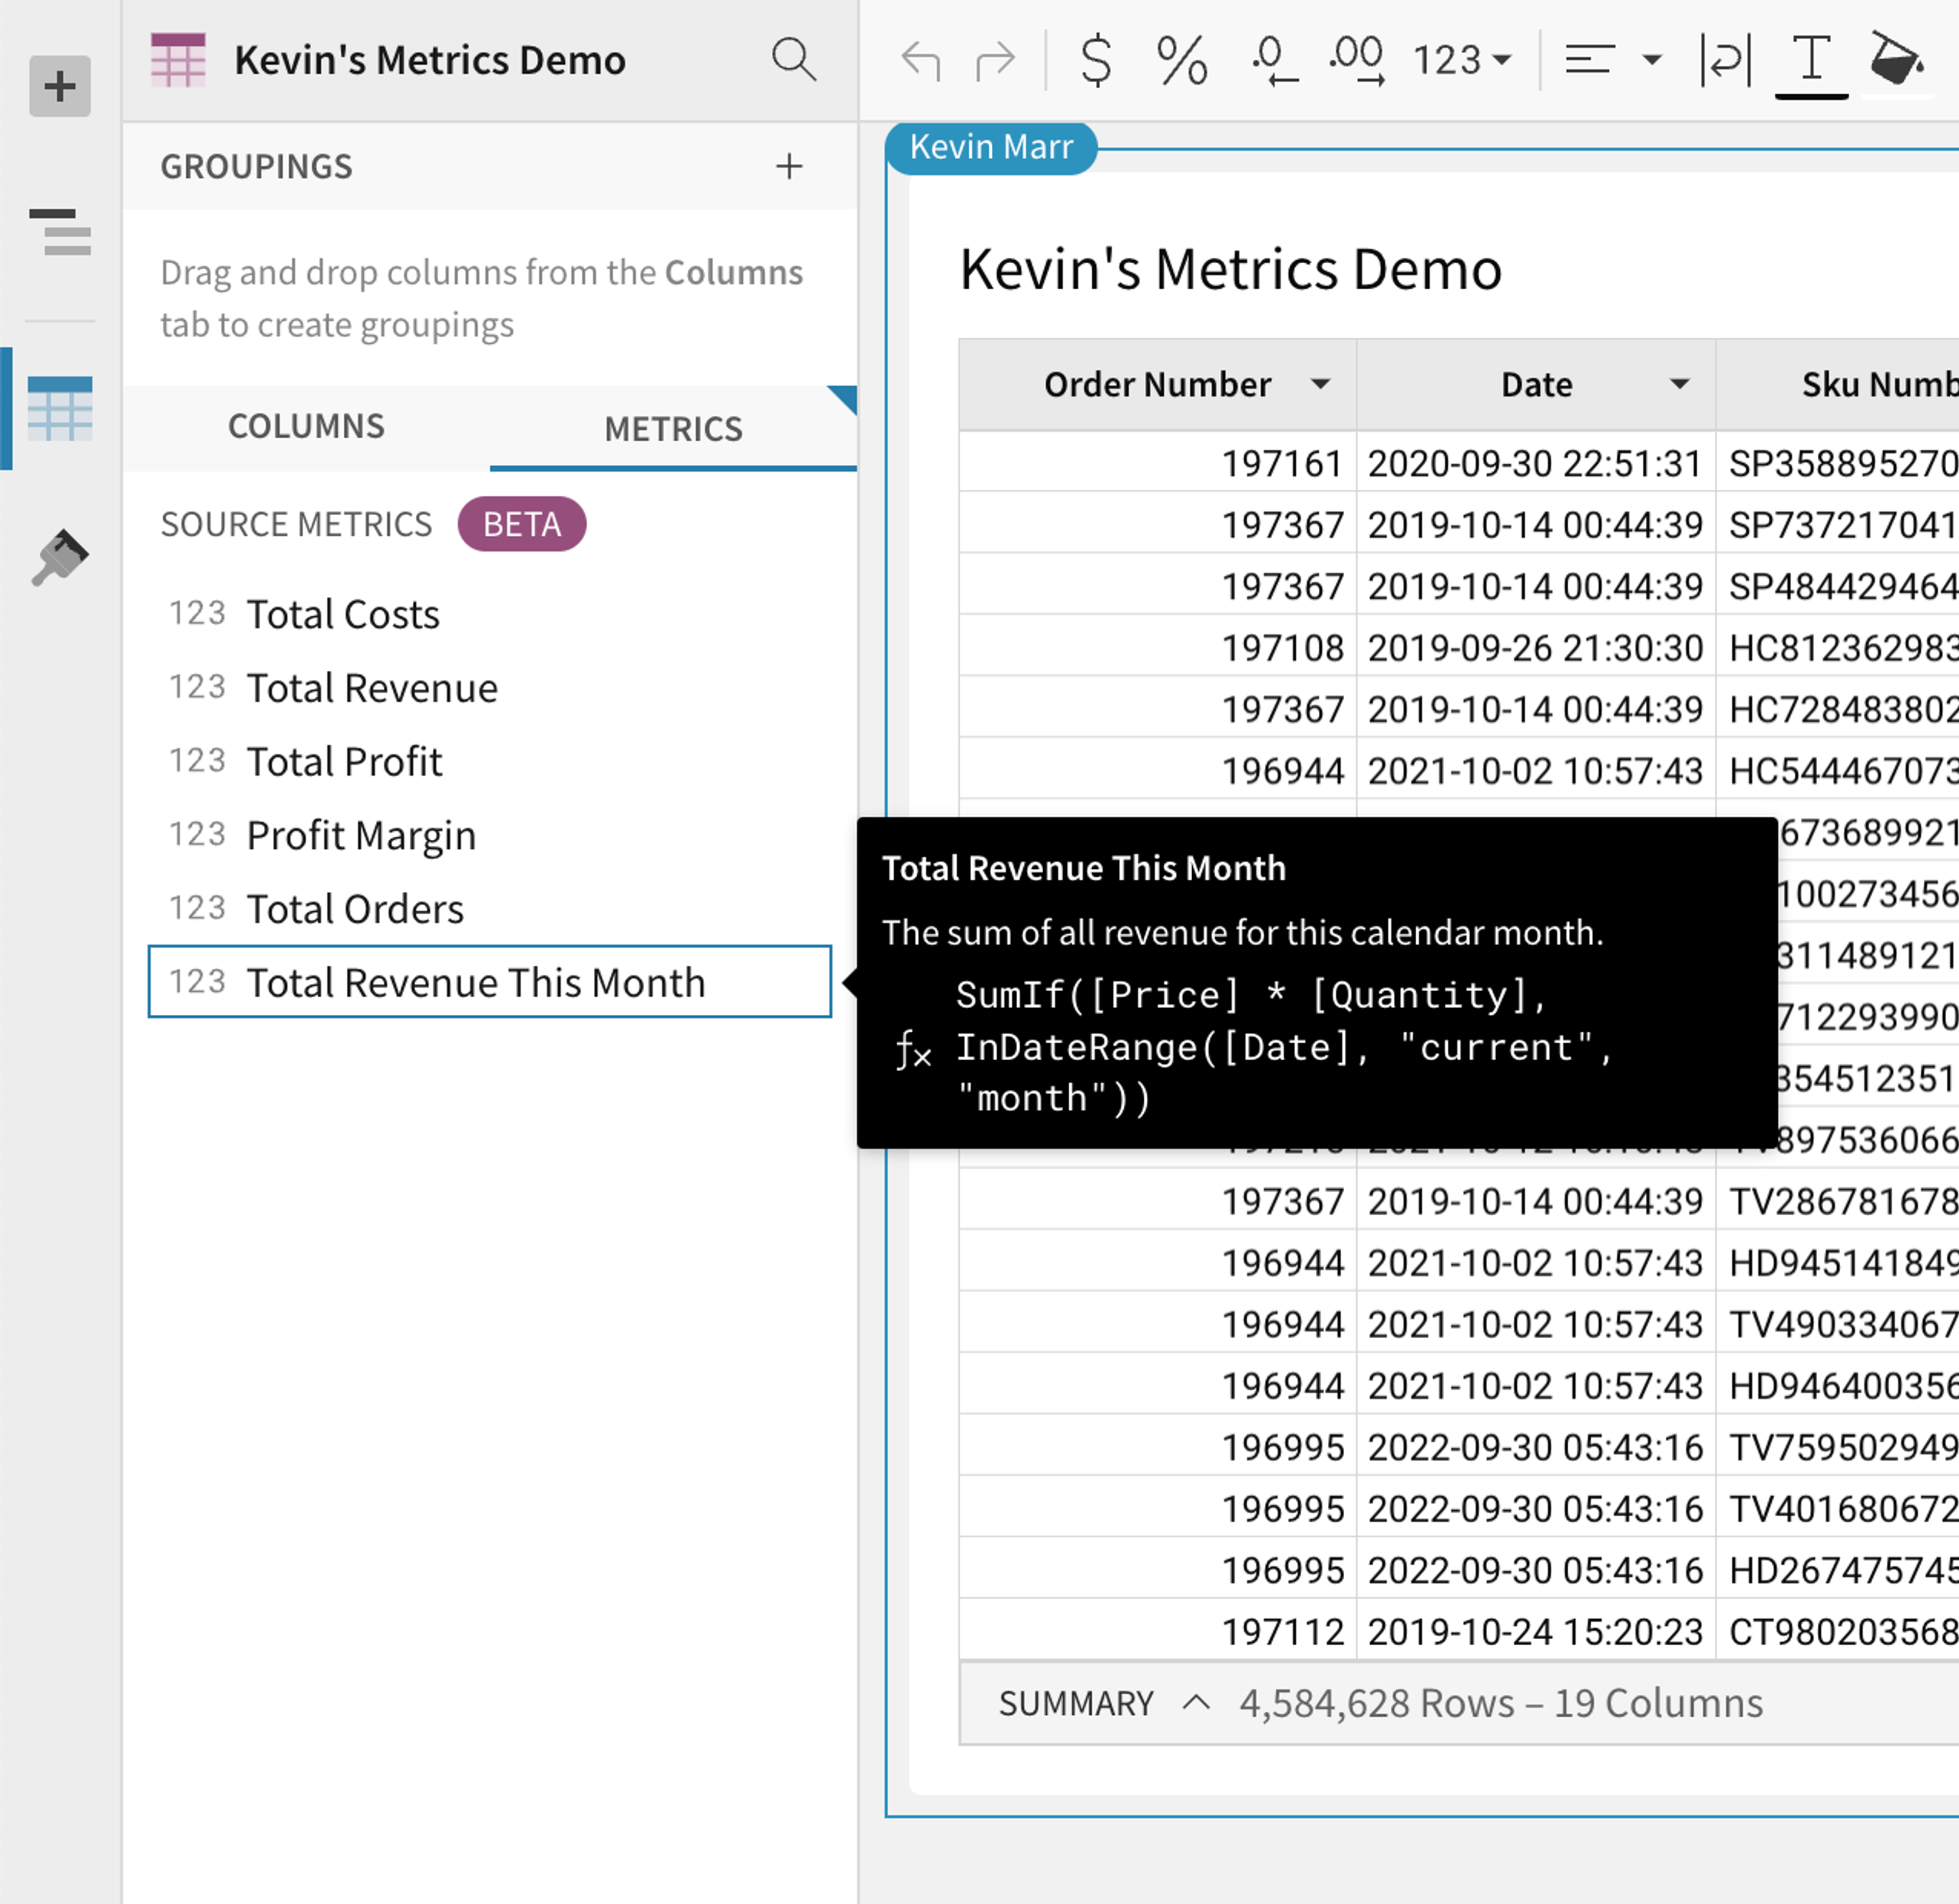
Hovering over a metric displays its definition as well as its formula, so that workbook analysts can be sure that the metric does what they think it will. Trusting data is key to adopting it.
To bring it into your analysis, you just drag the metric in. You can drag it into a table’s grouping level, a pivot table’s Values section, or a chart’s Y-axis. The important thing here is that you don’t have to type anything or remember how the metric was defined—that work has already been taken care of.
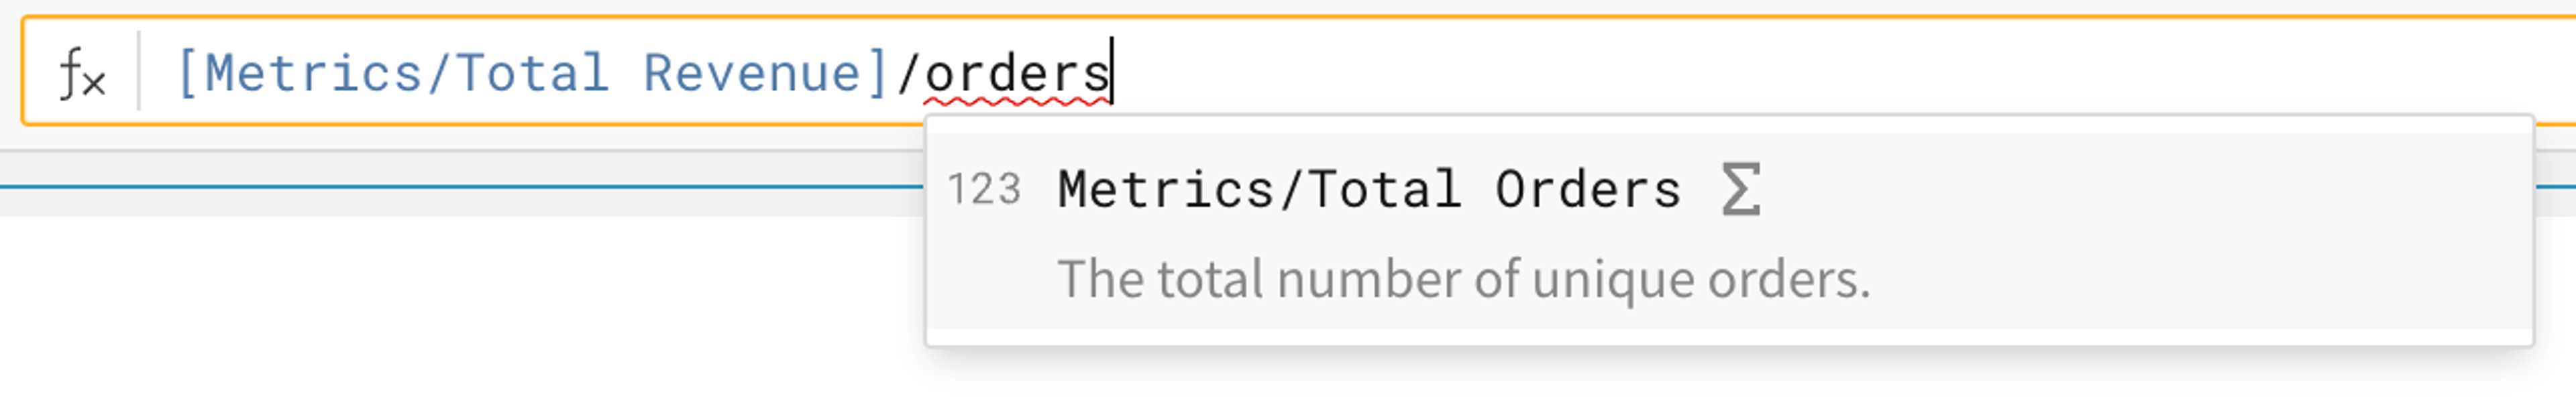
An enterprising analyst can also use metrics as a starting point from which to spin off bespoke explorations. Any metric can be referred to from another column’s formula via [Metrics/Metric Name]. And of course, we will suggest and auto-complete them for you in the formula bar.
Changing Metrics
Inevitably there will come a time when you need to edit a metric that’s already been incorporated into many workbooks. We wanted to make sure that doing so wouldn’t result in any broken content, which we found was a big issue in some other tools. When you edit a metric in Sigma, the update just flows through to all of the places where the metric is used—even if you change the name of the metric! No broken stuff, and no tears.
Take Metrics for a Spin!
Metrics are now in Beta, available for every Sigma user. Take them for a spin, and start building up your organization’s lingua franca for how critical KPIs are defined.
To learn more, check out our documentation.


