How To Calculate Percent Of Total In Spreadsheets

Numbers without context can be hard to interpret. That’s why looking at a number as a percent of a whole is such a powerful tool. It lets you contextualize data points into compelling stories of relative performance. That’s why Sigma has made it easier than ever to create percent of total calculations.
Spreadsheet formulas for percent of total
Before diving into Sigma's features, here are a few common spreadsheet approaches to calculate the percent of total:
- Basic Excel/Google Sheets formula: =A1/SUM($A$1:$A$10) - This divides a cell by the sum of a range, giving you the percentage that cell represents of the total.
- Array formula: =A1/SUM(A:A) - This references an entire column for the denominator, useful when your data might grow.
- SUMIF for conditional percentages: =SUM(B2)/SUMIF(A:A,"Category X",B:B) - Calculate what percentage a value represents within a specific category.
While these formulas work, they require manual updates as your data changes. For more dynamic analysis across large datasets, an automated approach can save significant time and reduce errors.
Sigma's percent of total calculations
That's why Sigma has made creating percent of total calculations easier than ever.
Adding a percent of total calculation to any workbook data element is possible on visualizations, pivot tables, and grouping tables. You will now see a new "Advanced Calculations" section of the 'Set aggregate' menu.
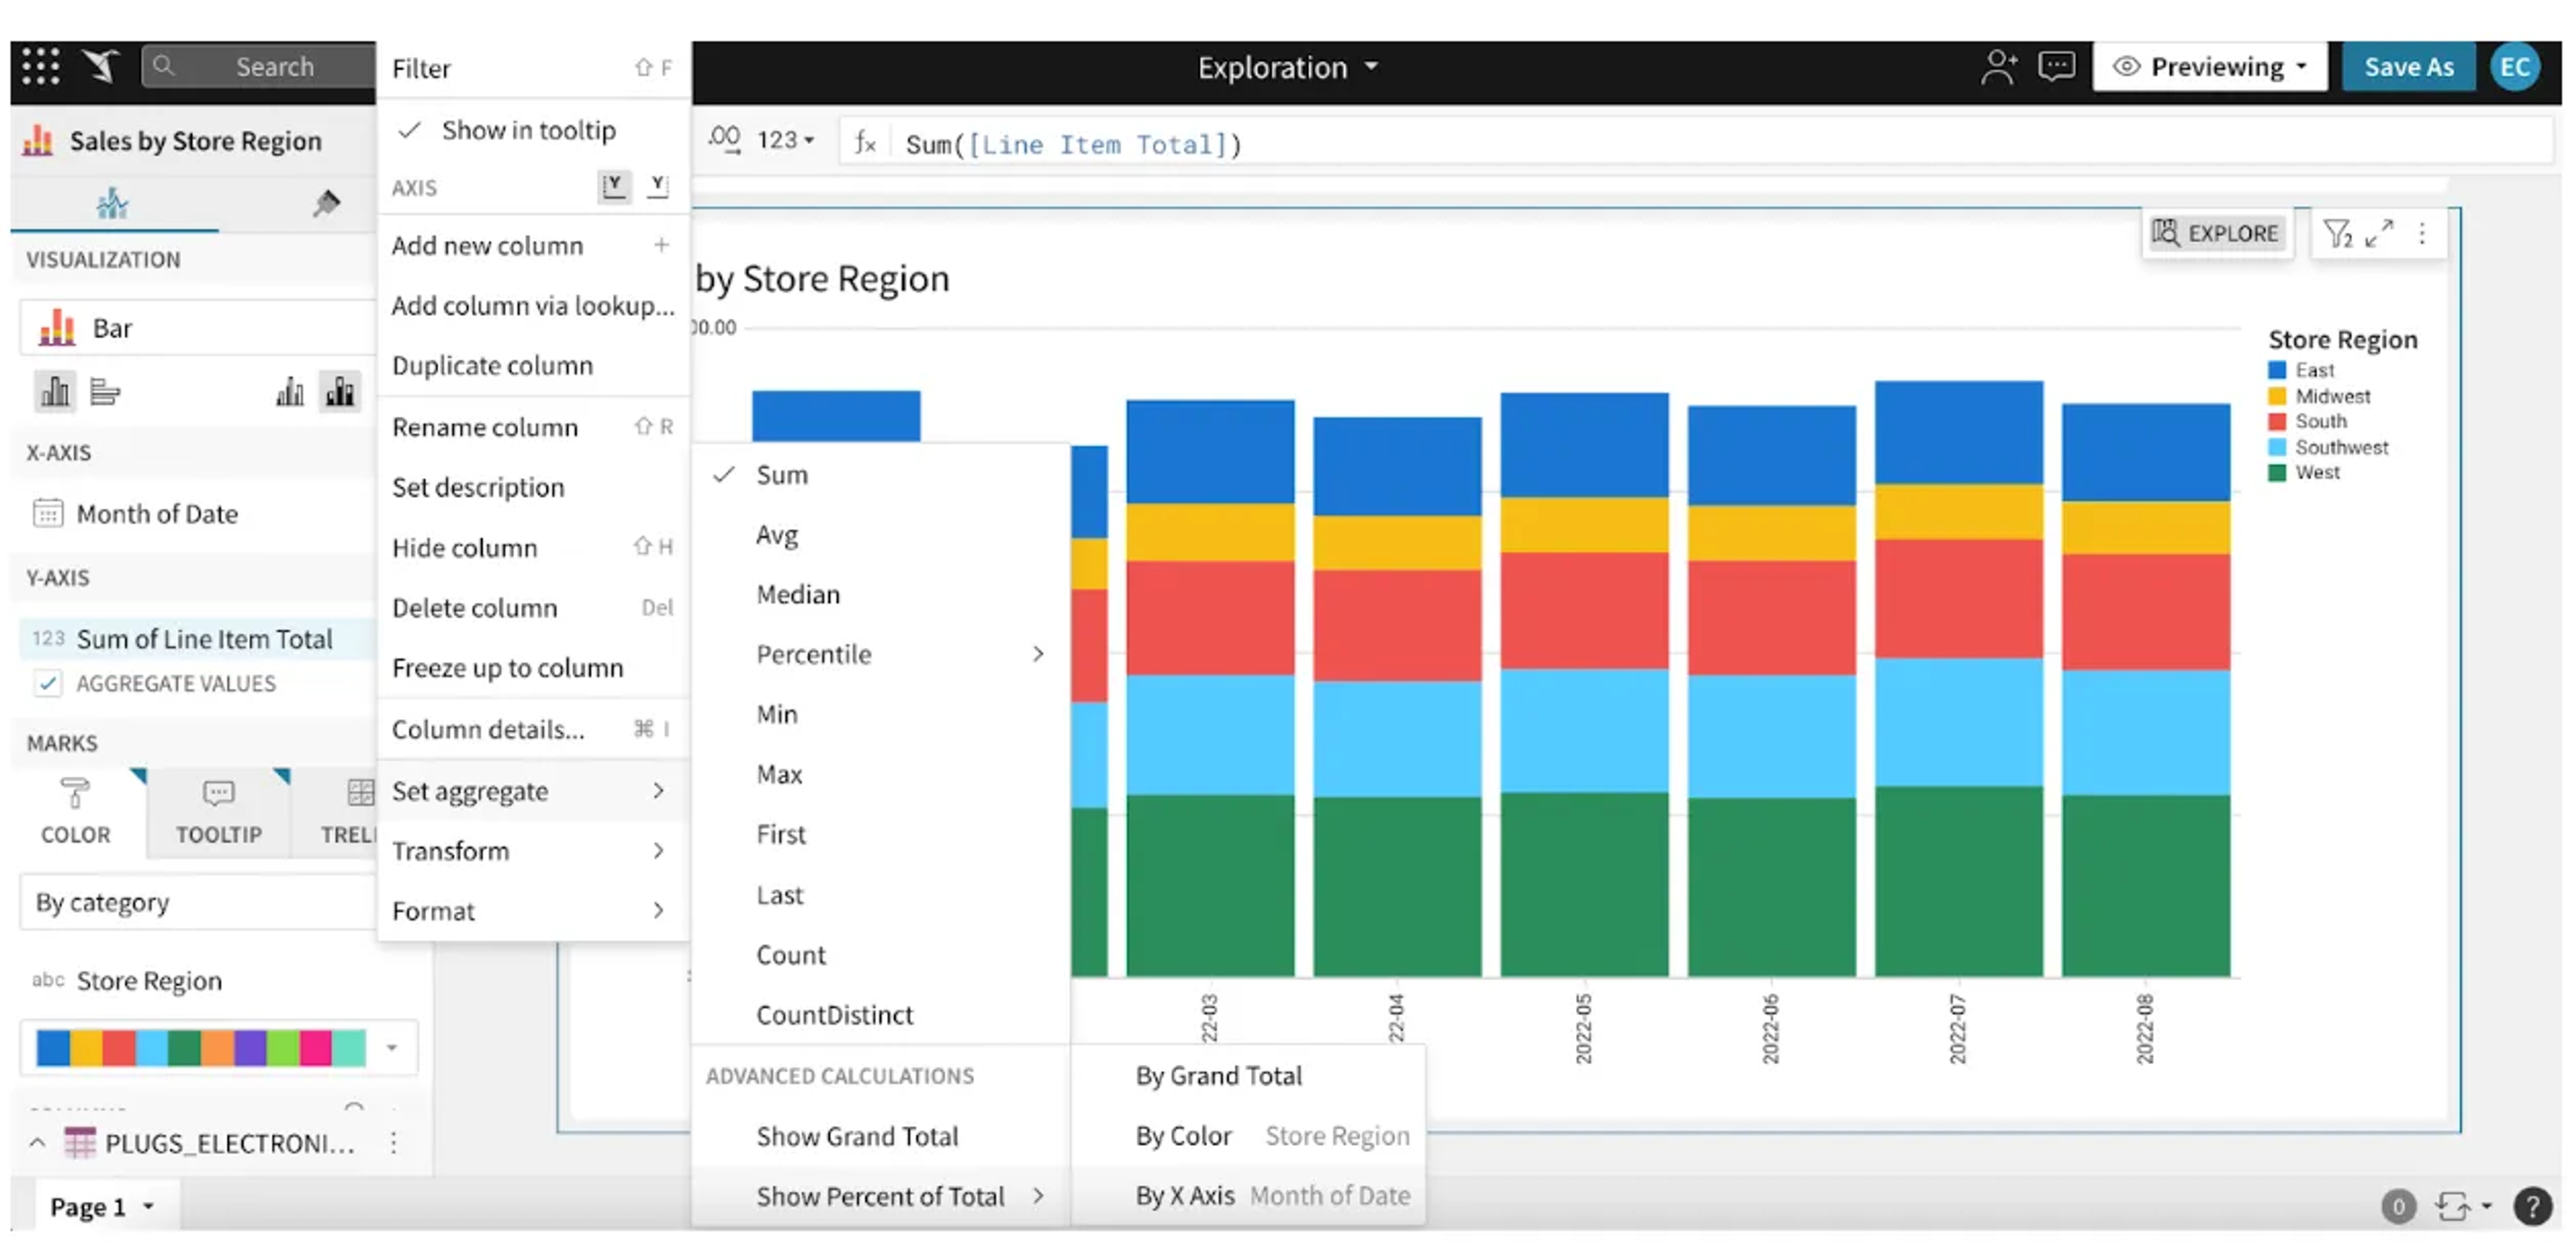
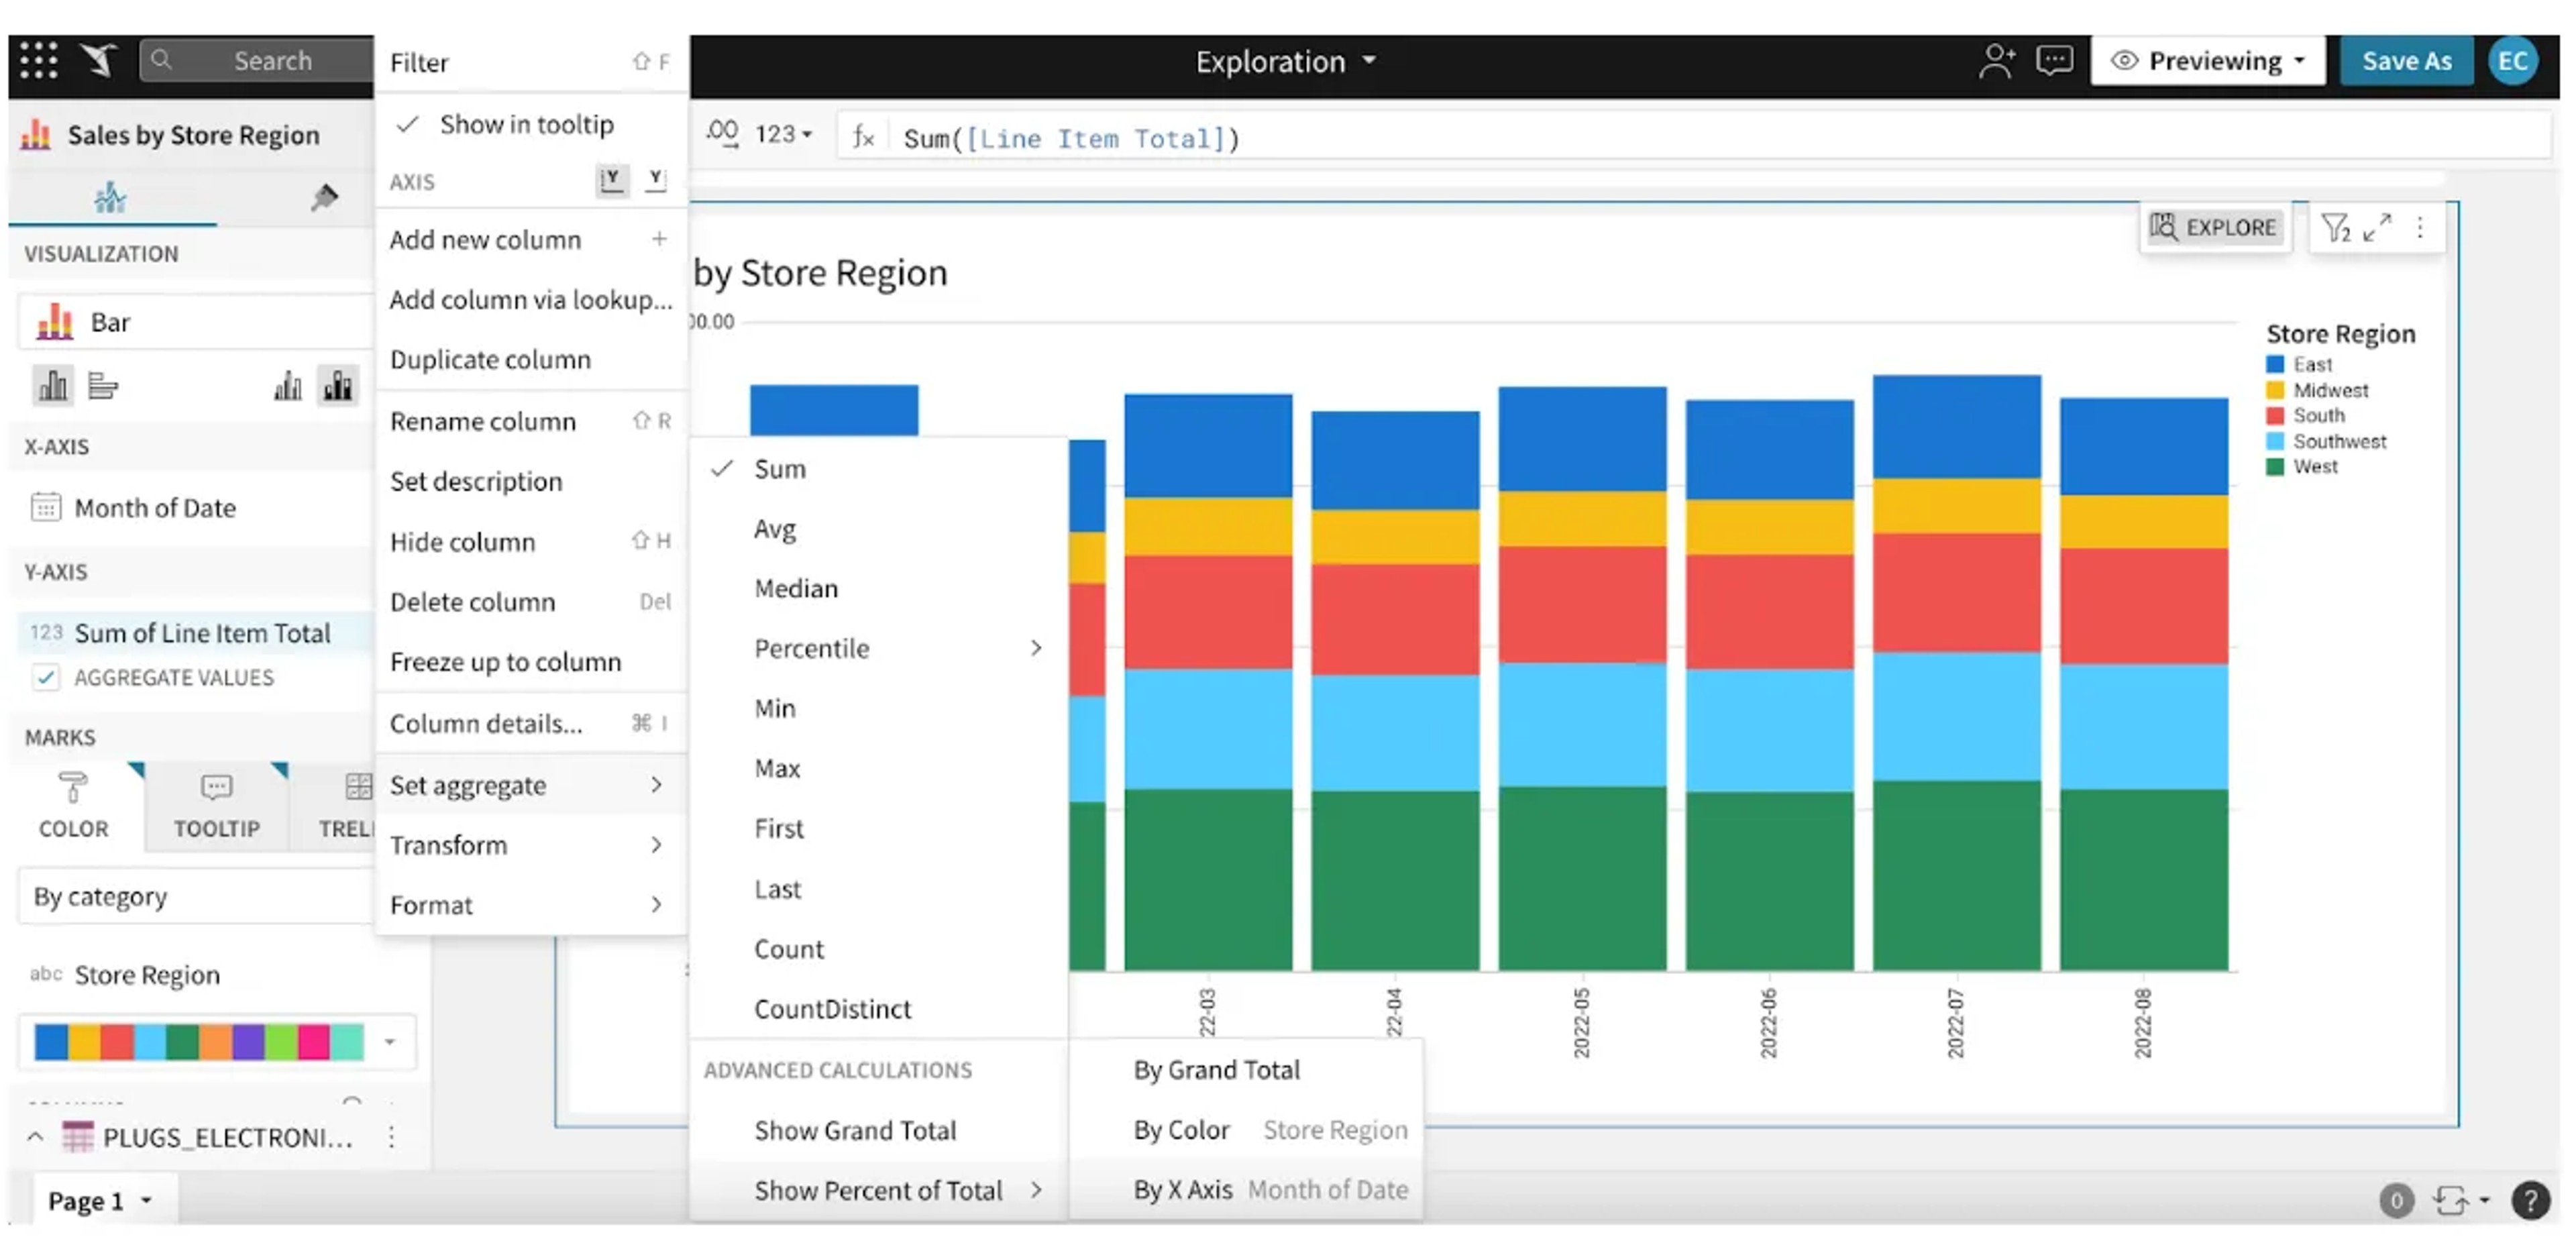
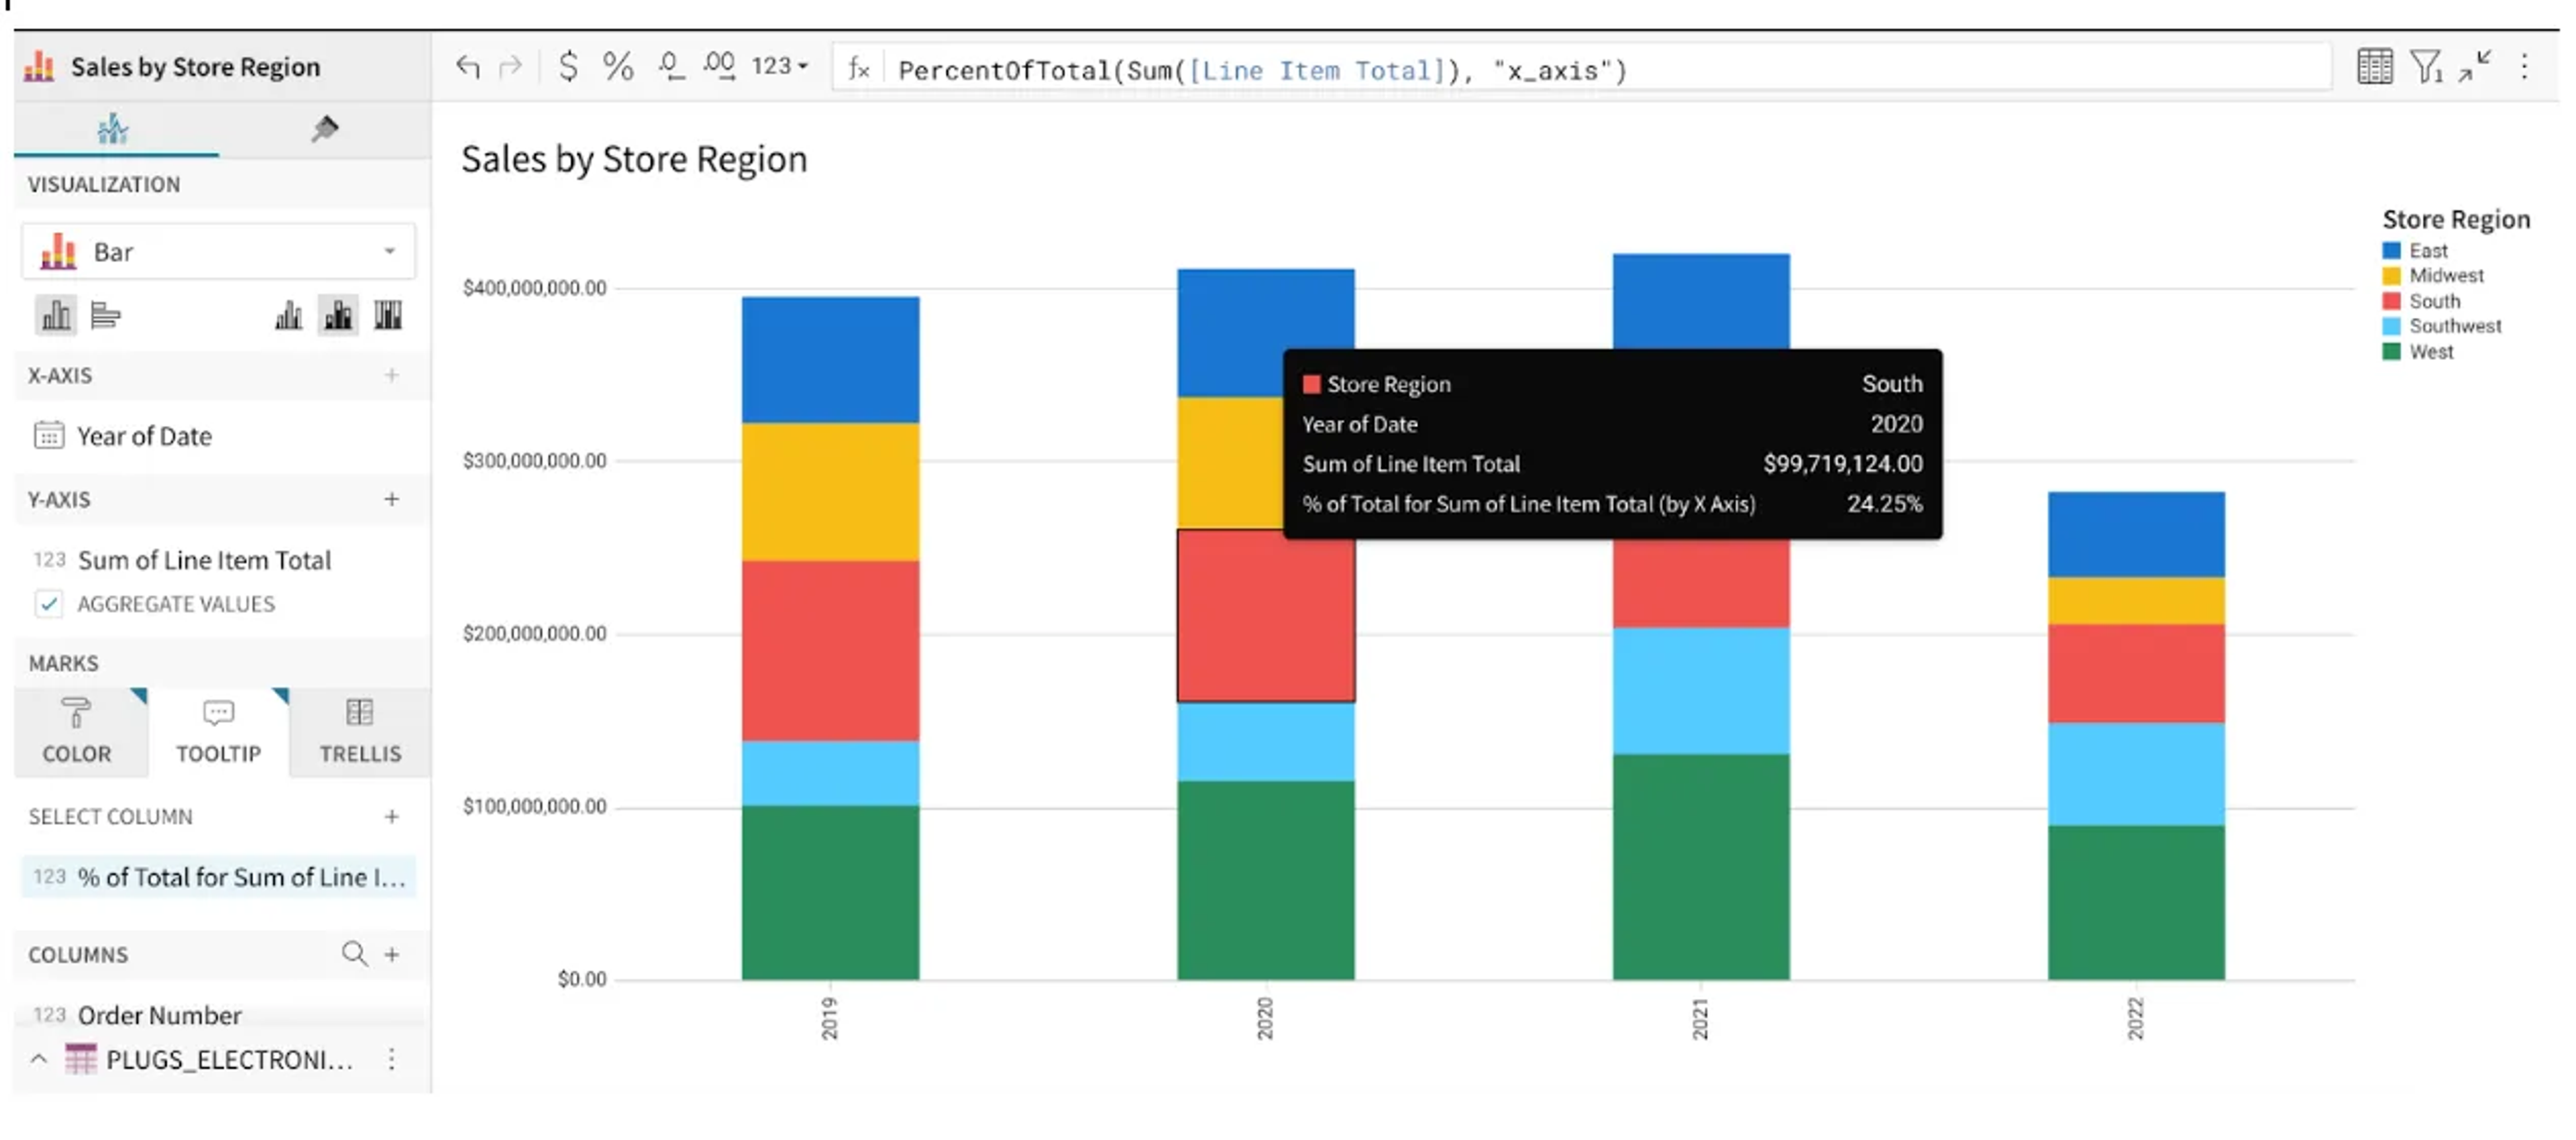
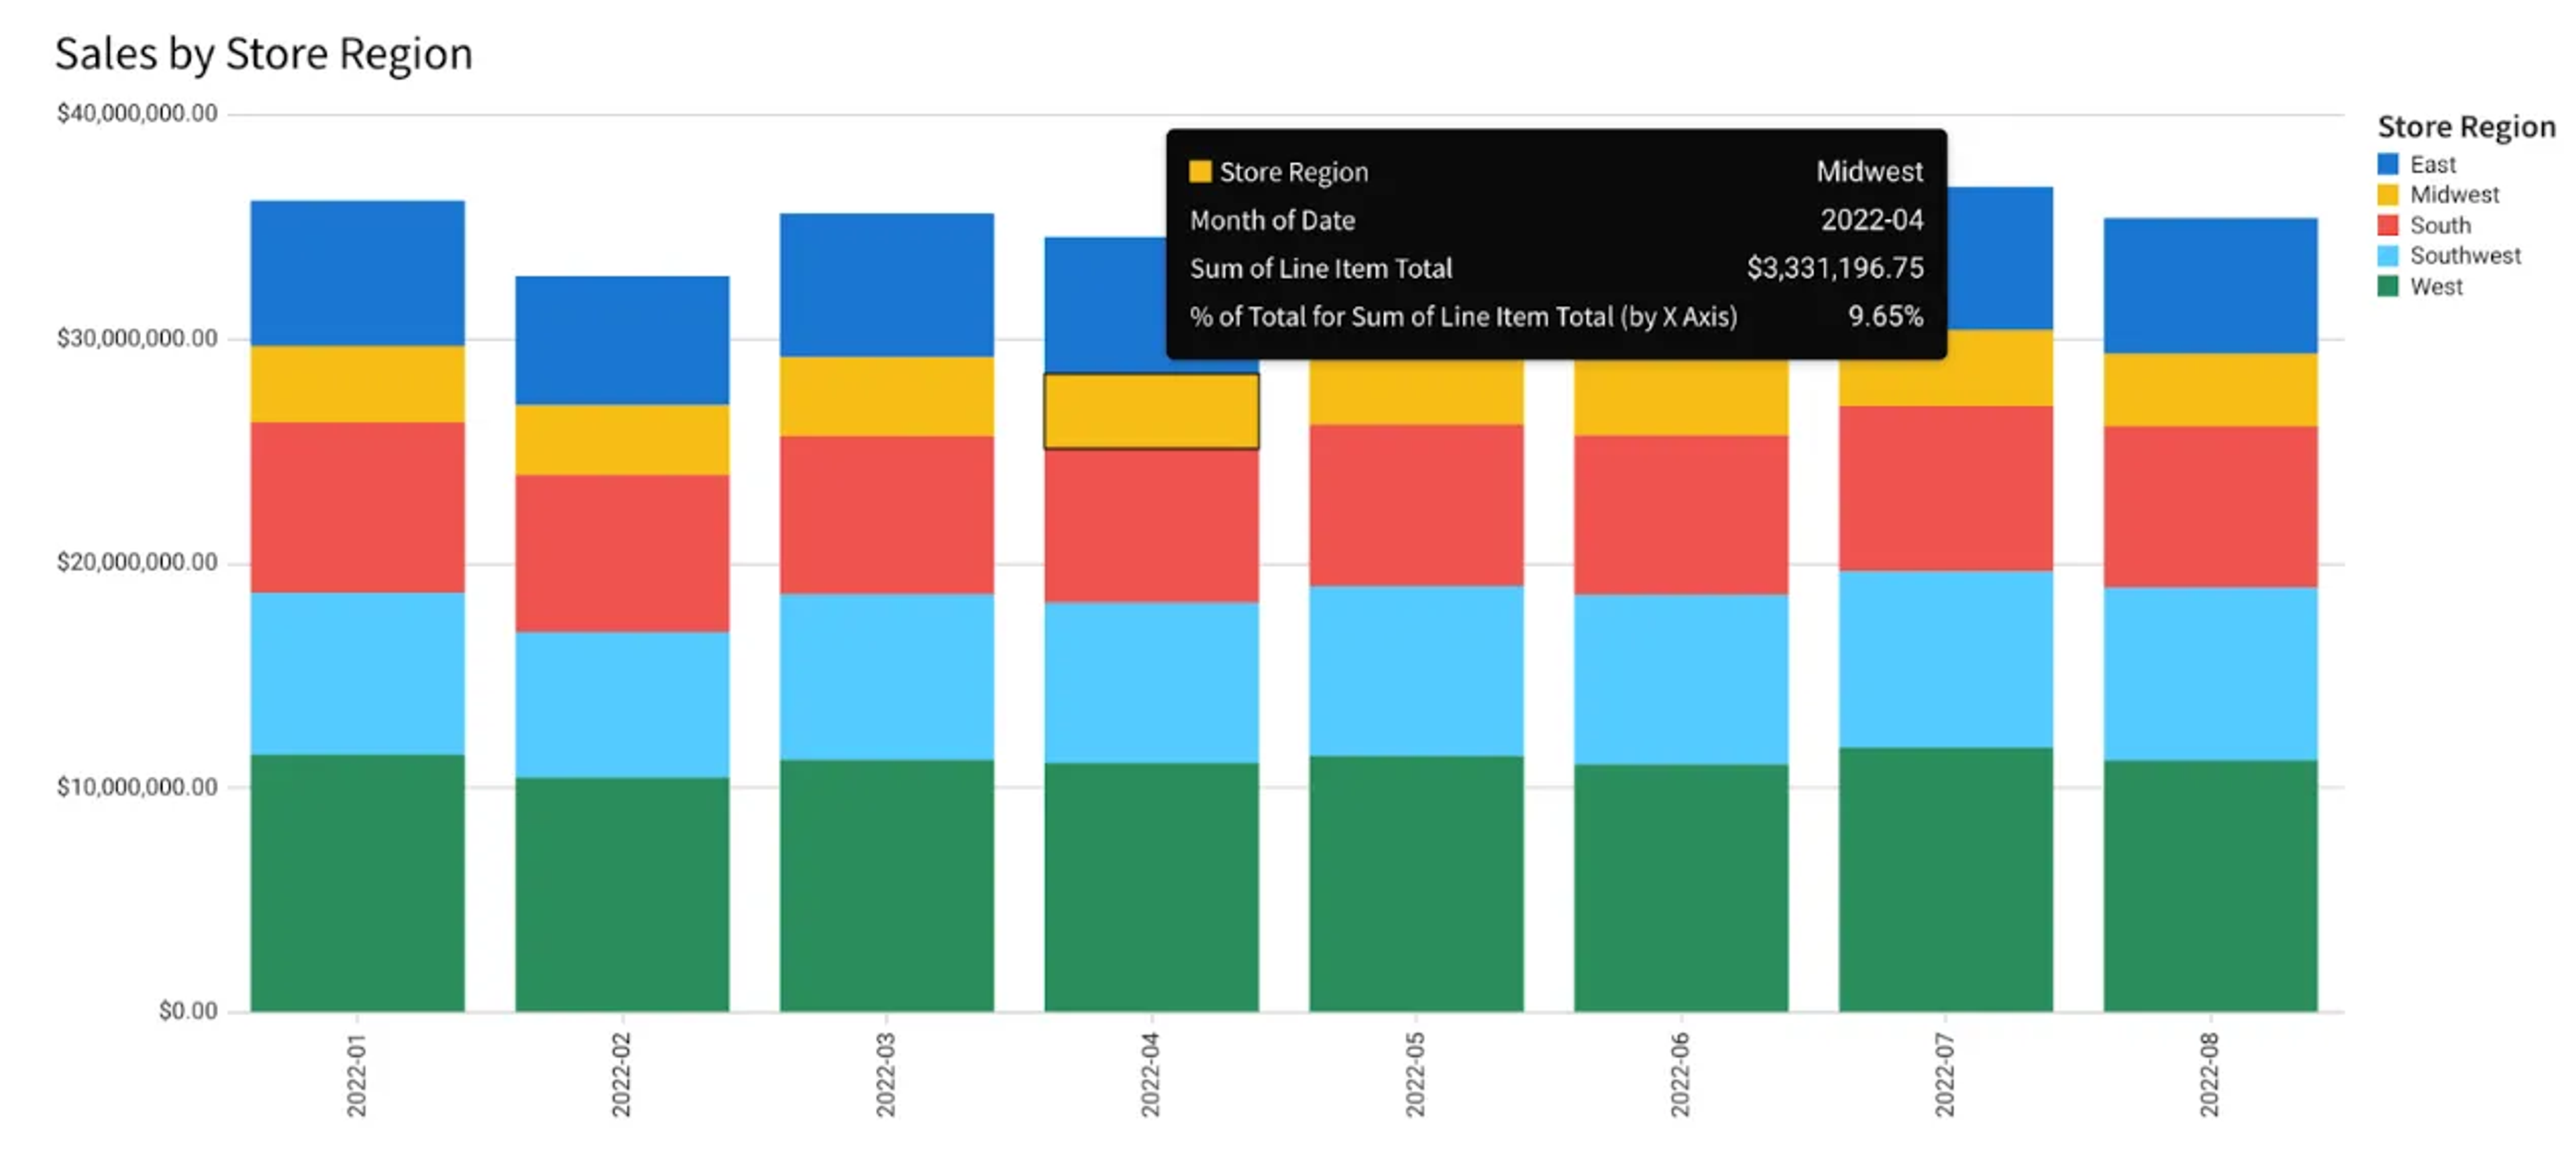
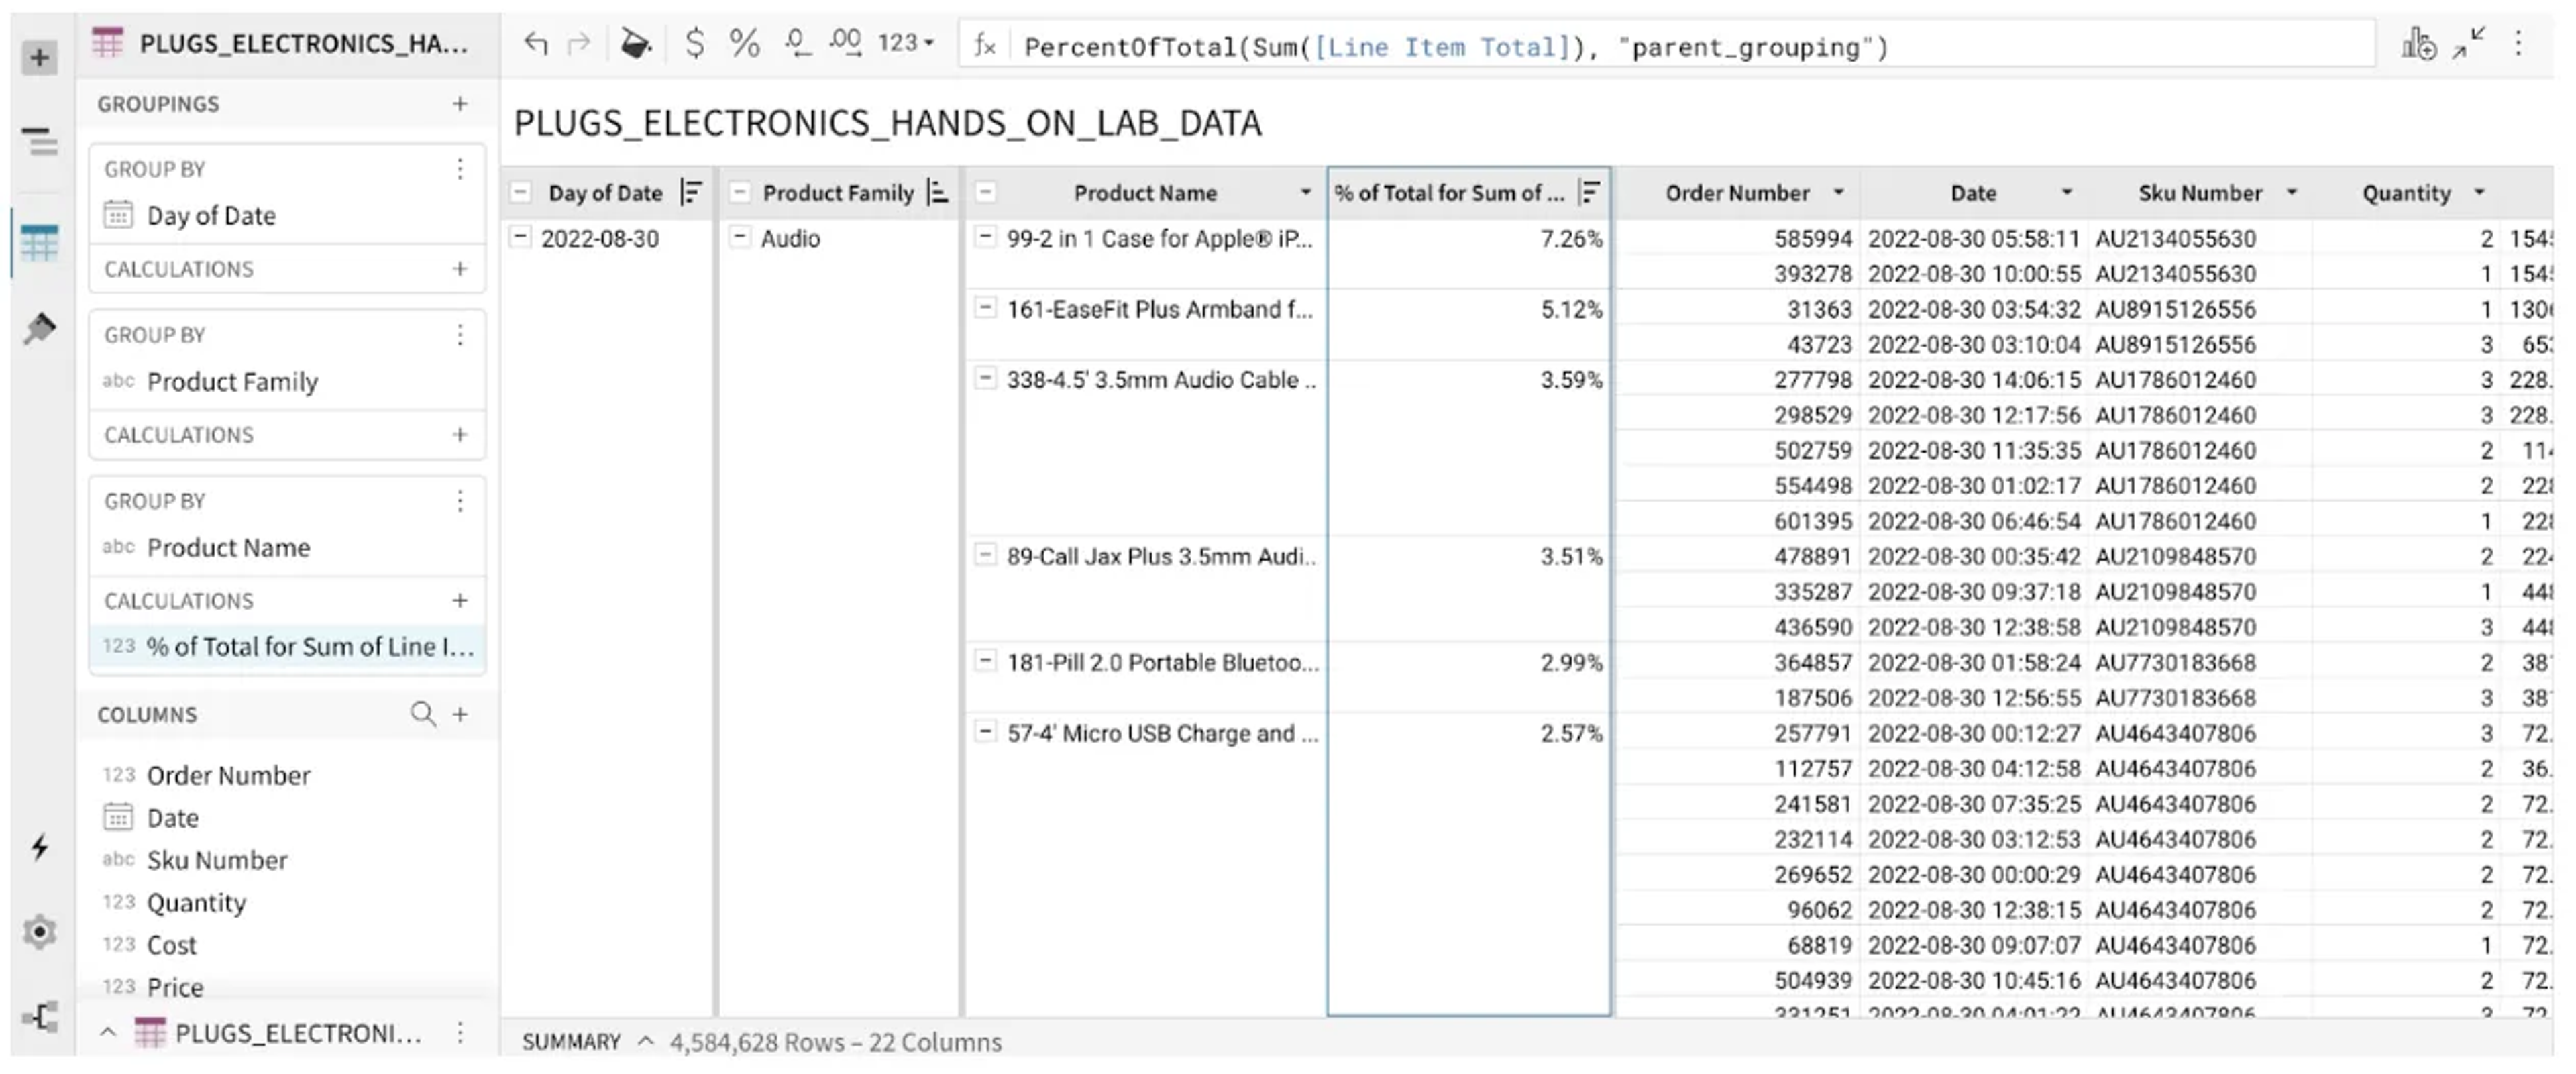
One powerful capability of the PercentOfTotal function is that it dynamically references calculations in a data element. Here’s an example: Let’s say you set up a percent of total function that references the x-axis of your chart. If a drill down changes the calculation on the x-axis, such as drilling down from year to month, the percent of total calculation will dynamically recalculate. These new functions create a powerful pairing with our drill anywhere functionality, helping users drill in and get contextual data on how the business is performing.
Let's take a look at what that can look like in practice:
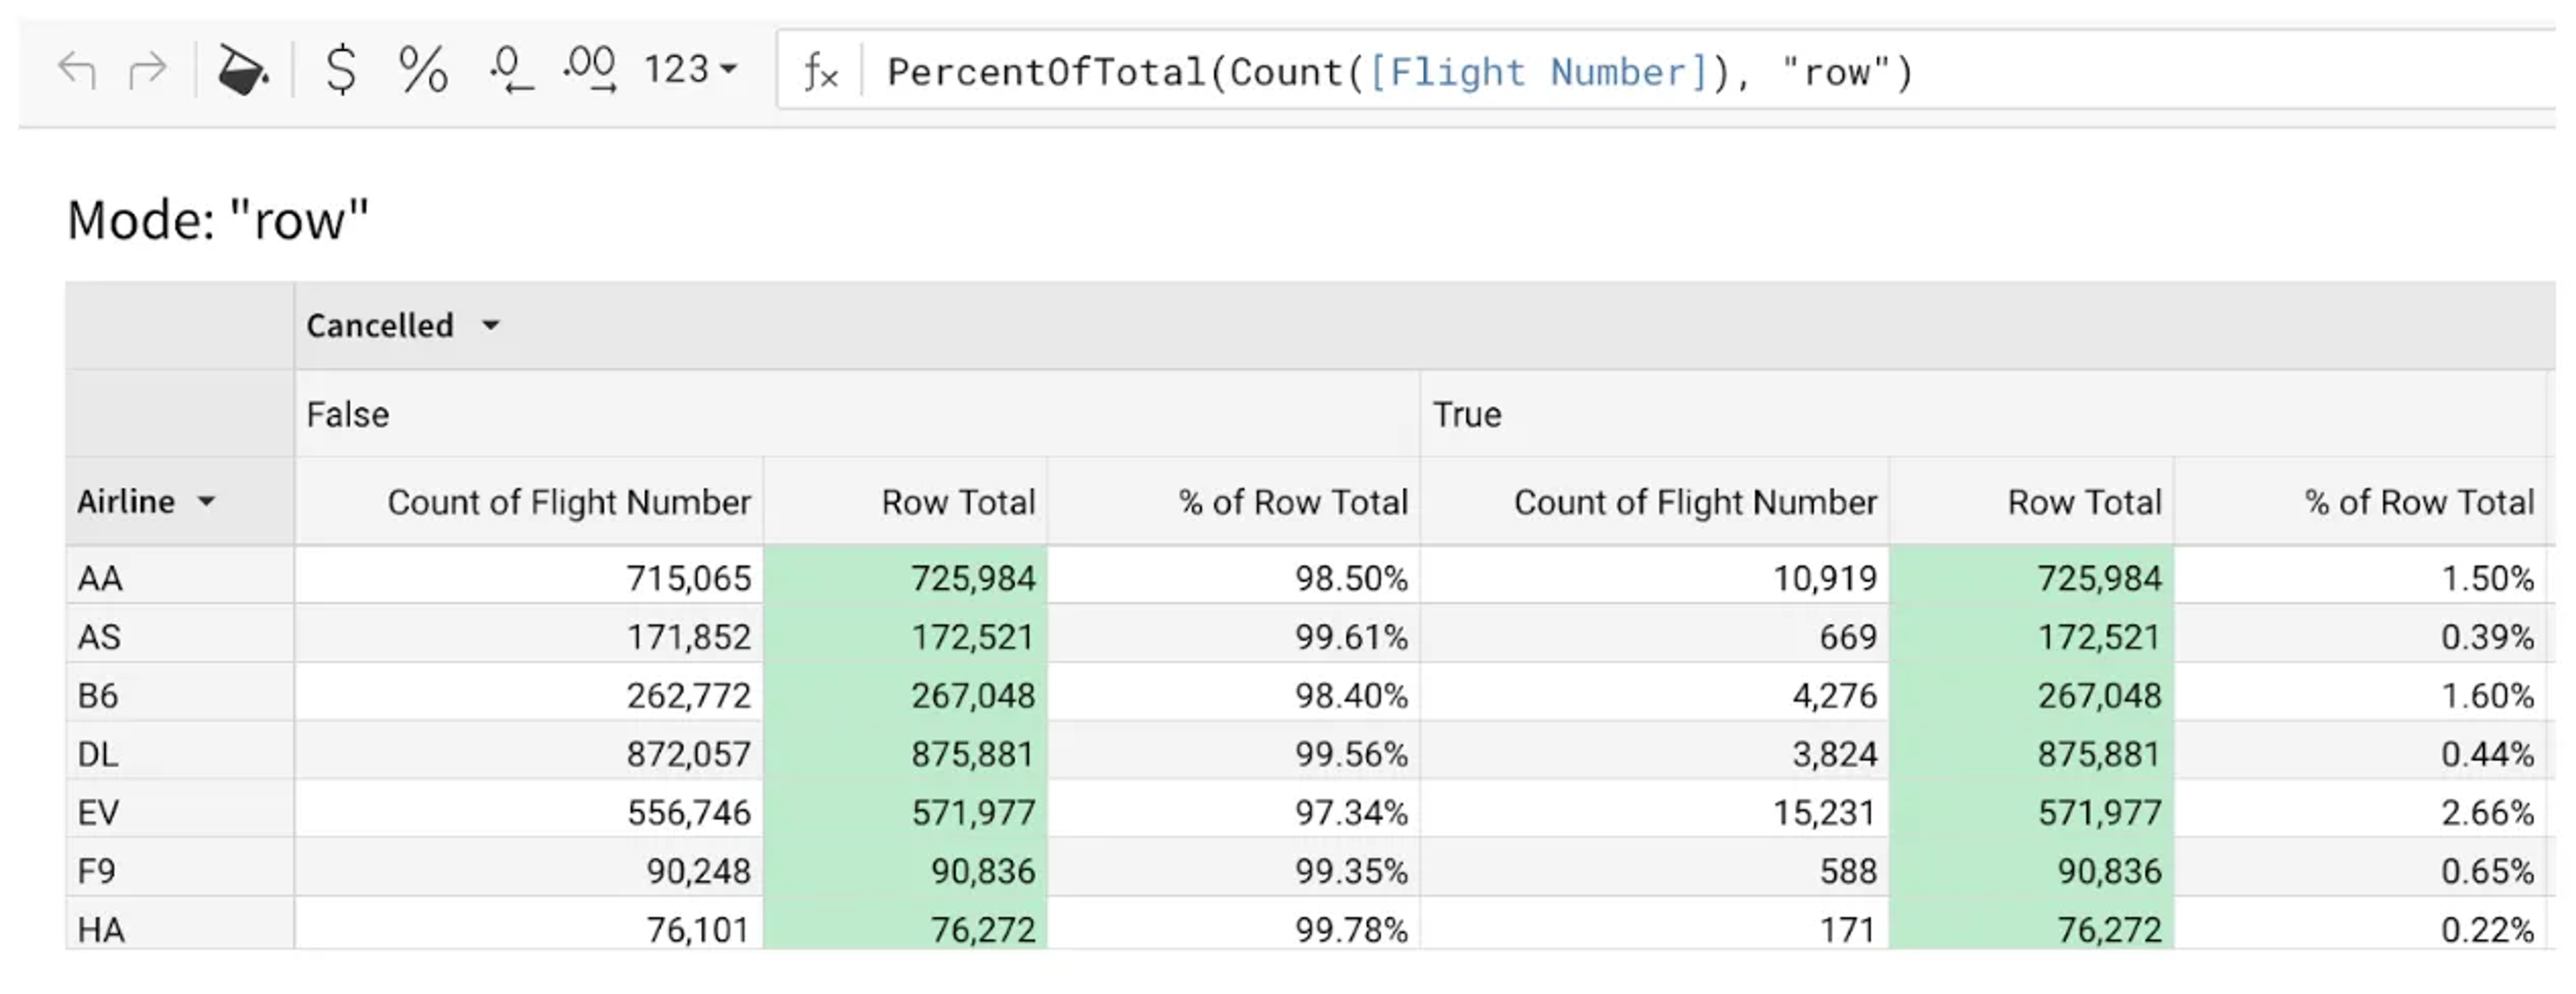
The new functionality also accelerates percent of total calculations across various table formats. You can now easily implement percent of total by row, column, or grand total in pivot tables with just a few clicks.
Begin using contextual calculations in your analyses today. Whether you're comparing regional performance, tracking seasonal trends, or analyzing market segments, percent of total calculations are essential for revealing the true story behind your data. They translate raw numbers into meaningful insights by showing each value's relative importance within the bigger picture.
Sigma simply makes implementing these calculations easier and more dynamic than traditional tools, allowing you to focus on discovering patterns and making informed decisions rather than managing formulas.
Try incorporating the percent of total in your next project and experience how proper context elevates your entire analytical process.


