
Sigma for Supply Chain Teams
Navigate disruption with real-time scenario modeling. Use Input Tables to test supplier changes and tariff impacts instantly, protecting margins before issues arise.
Get a demoAbout Supply Chain
Sigma's pixel perfect reporting enables finance and operations teams to create boardroom-ready reports directly on warehouse data. Design P&Ls, financial statements, and operational reports with precise formatting, then schedule automated delivery to stakeholders—all governed by enterprise security policies.
Trusted by 2,000+ leading enterprises around the world
From Data to Supply Resilience
Identify alternative suppliers and routes instantly. Teams use live data to assess risk and pivot operations during global disruptions.
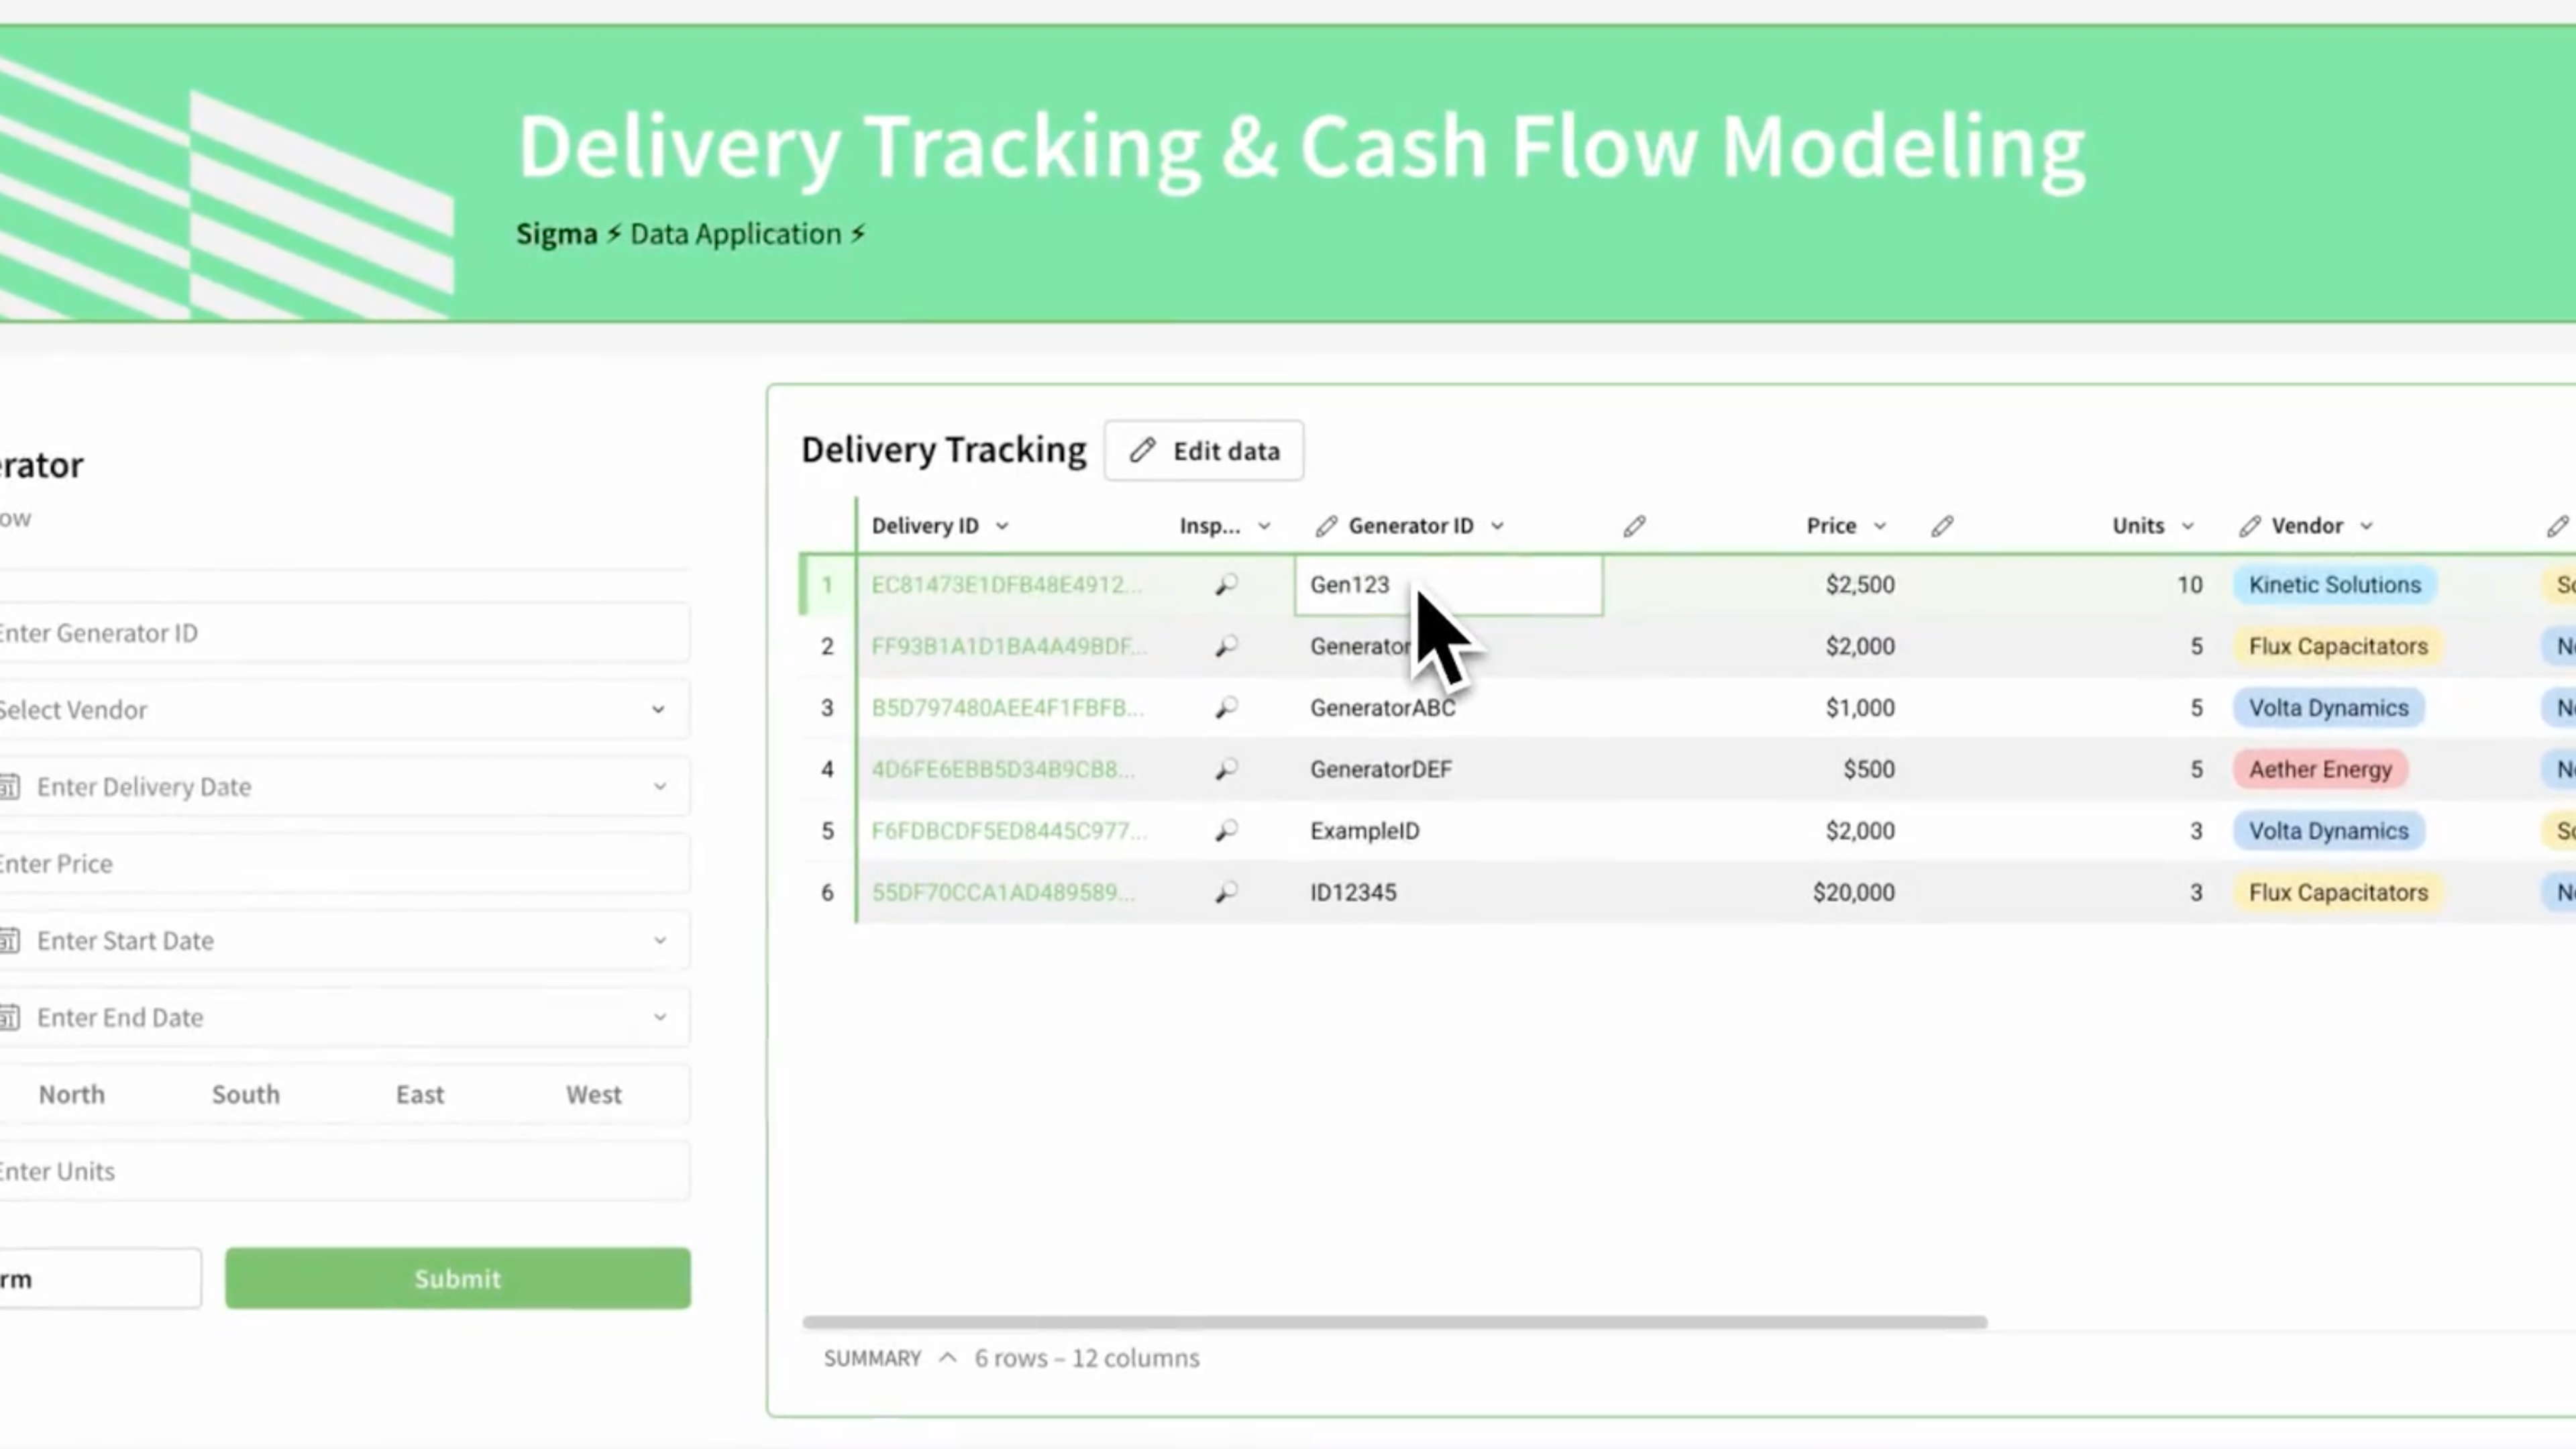
Model supply chain scenarios
Navigate disruption with confidence. Use Input Tables to model tariff impacts, safety stock changes, and supplier shifts on live data before they hit the
- P&L.Input Tables for modeling
- Tariff impact simulation
- Stock-to-service level optimization
Unify demand forecasting in a single platform
Replace disconnected spreadsheets with a unified plan. Regional planners use Input Tables to submit local forecasts directly to the warehouse, updating the global demand plan instantly.
- Forecast writeback
- Regional roll-ups
- Forecast accuracy tracking
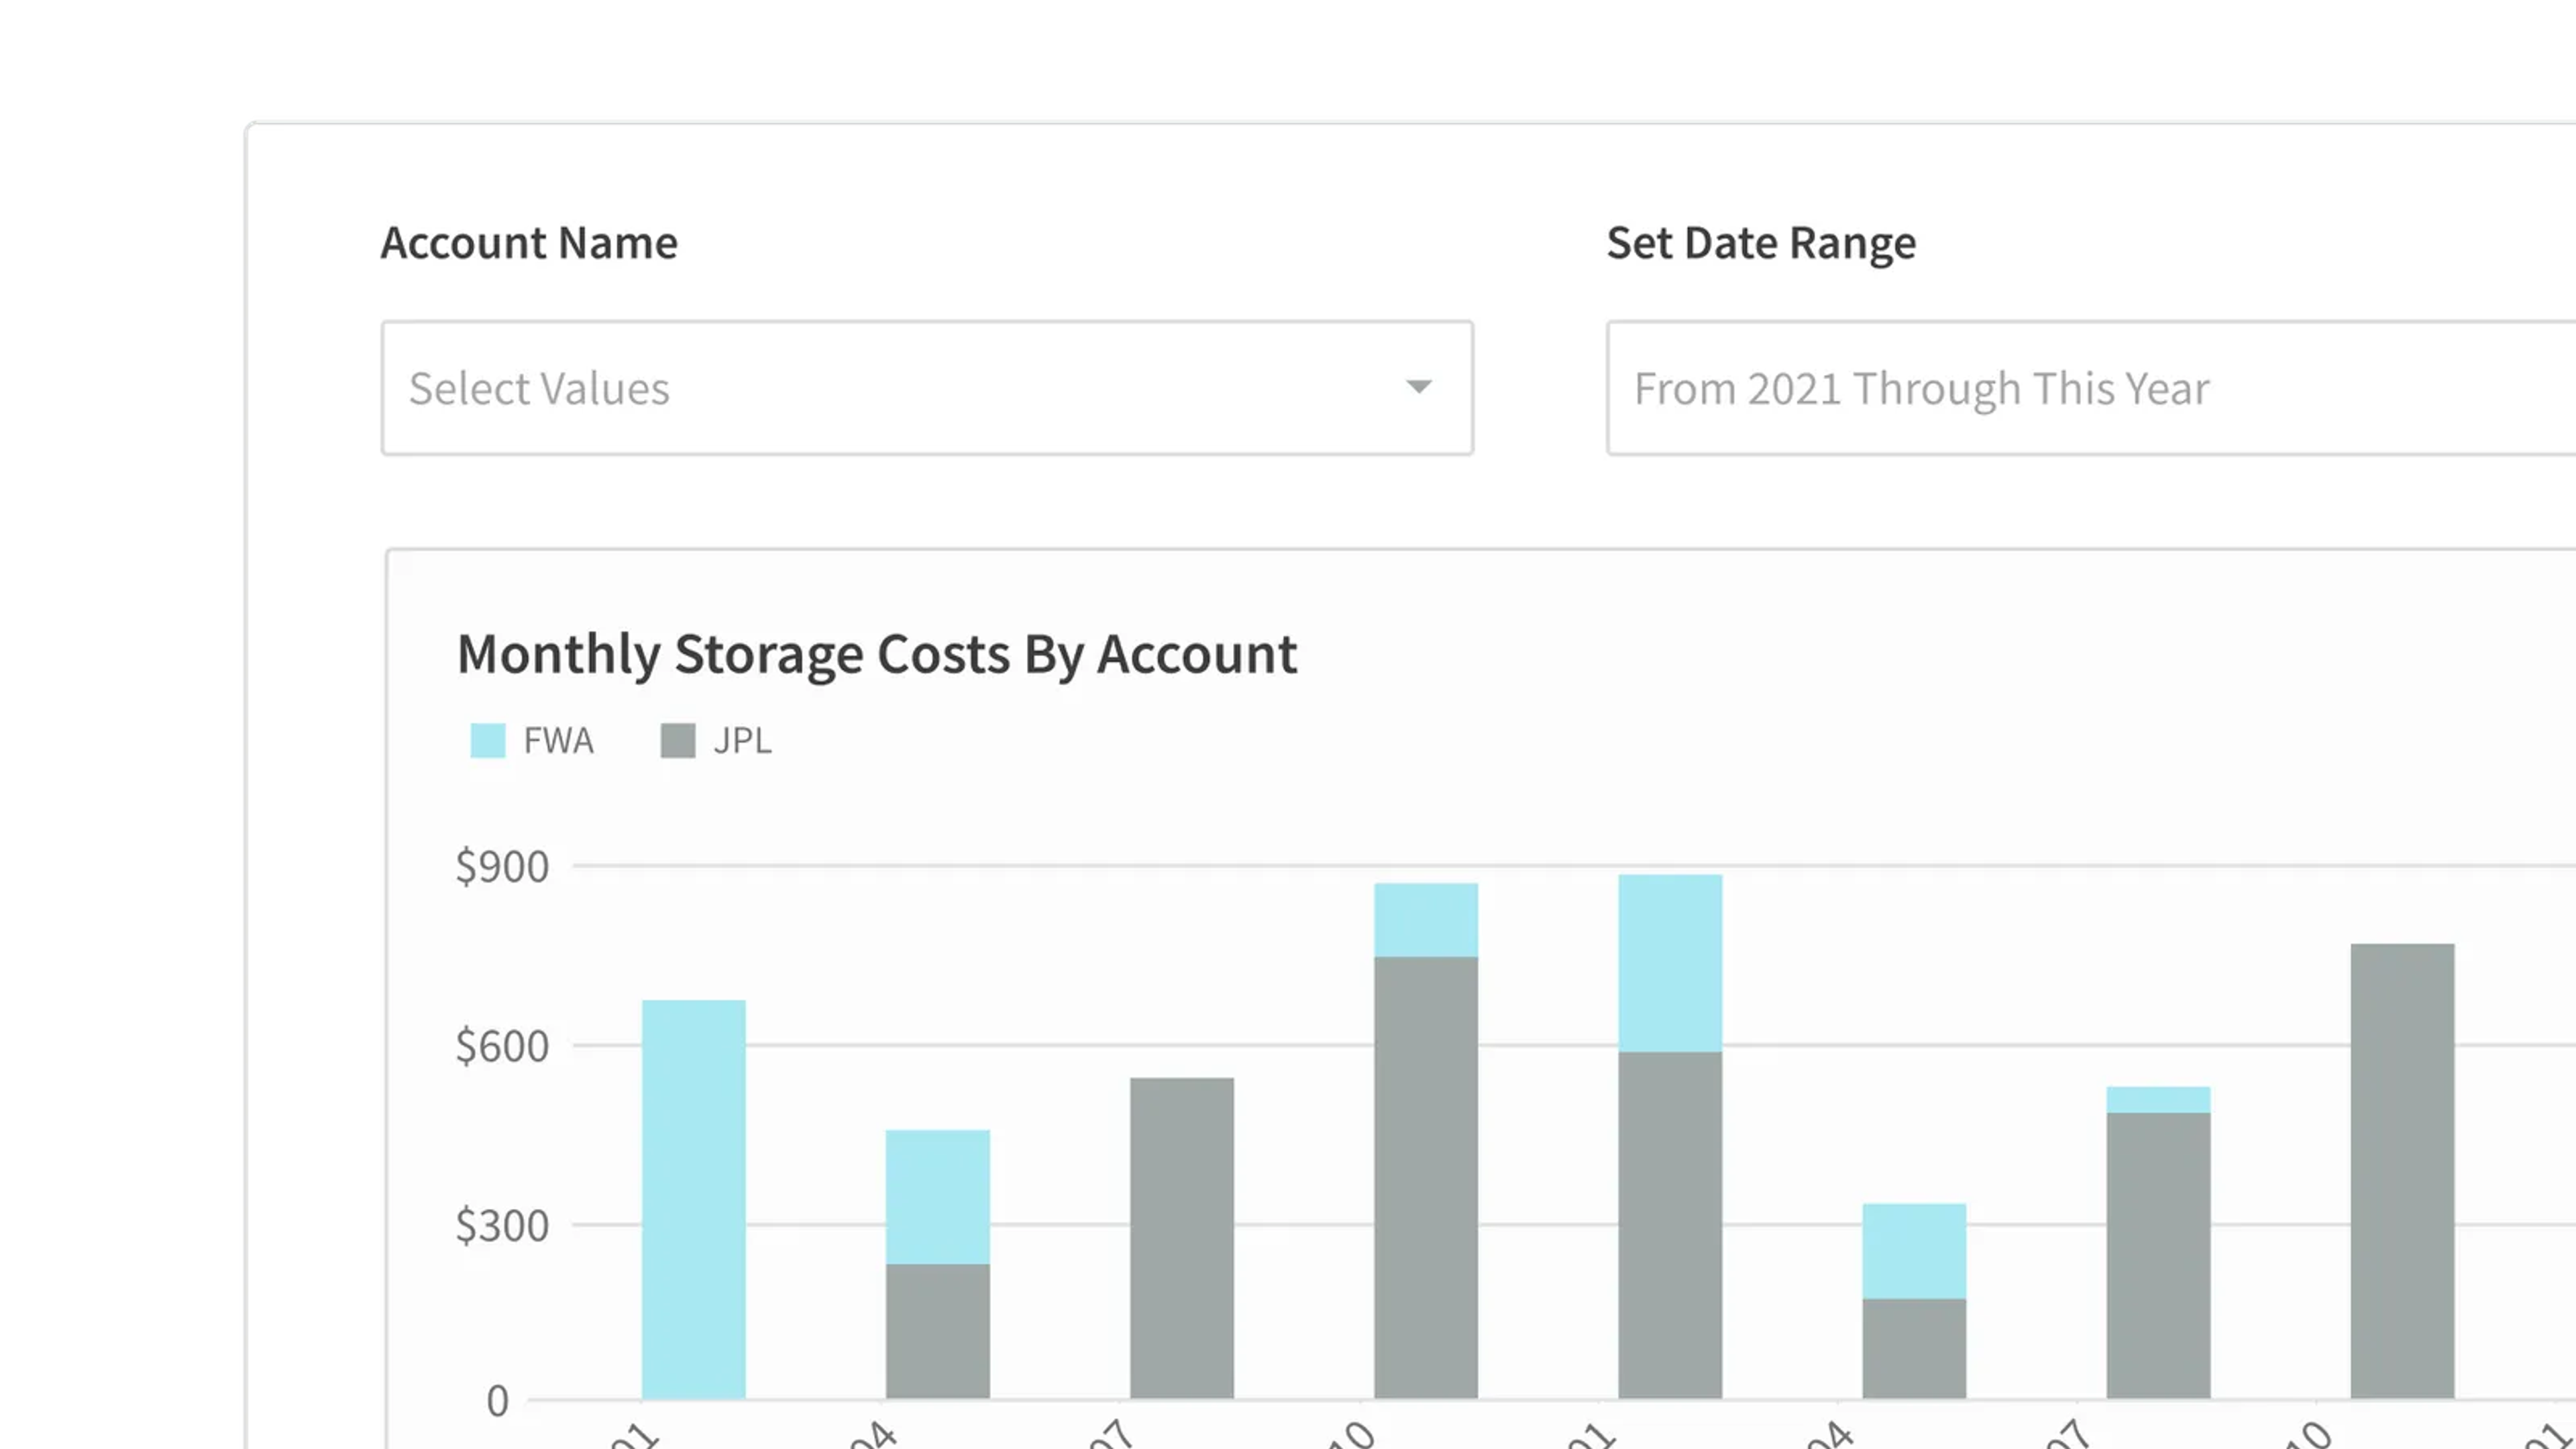
Analyze landed costs and uncover savings
Calculate the true landed cost of every SKU. Join invoice, duty, and freight data live to identify margin erosion and negotiate better terms with suppliers.
- Total landed cost analysis
- Purchase Price Variance (PPV)
- Spend categorization
Drive vendor accountability
Identify quality issues and delivery risks instantly. Drill down to individual POs and quality logs to hold suppliers accountable and diversify sourcing faster.
- Live quality scorecards
- On-time delivery (OTIF) drill-down
- Sourcing diversification analysis

Control transportation spend in real-time
Control logistics costs at the shipment level. Analyze billions of freight records to streamline routes, consolidate loads, and reduce carrier spend without waiting for extracts.
- Route profitability analysis
- Carrier performance tracking
- Freight cost-to-serve modeling
Trusted for Operational Continuity
Global brands trust Sigma to monitor supply chain health in real time, ensuring delivery targets are met despite market volatility.

 Customer Story
Armstrong Transport Group replaced manual spreadsheets with Sigma’s real-time analytics platform, gaining automated visibility across its $2B+ contract freight network during an industry downturn.


Enterprise-Grade Analytics for Supply Chain Scale
Sigma is built for business teams that need flexibility without sacrificing governance or performance.
Live Warehouse Connectivity
No data extracts—query live ERP and WMS data directly from your cloud warehouse
Spreadsheet-Like Interface
Instant adoption for planners and operators with familiar Excel-like formulas
Secure Writeback
Planning and adjustments with governance controls and approval workflows
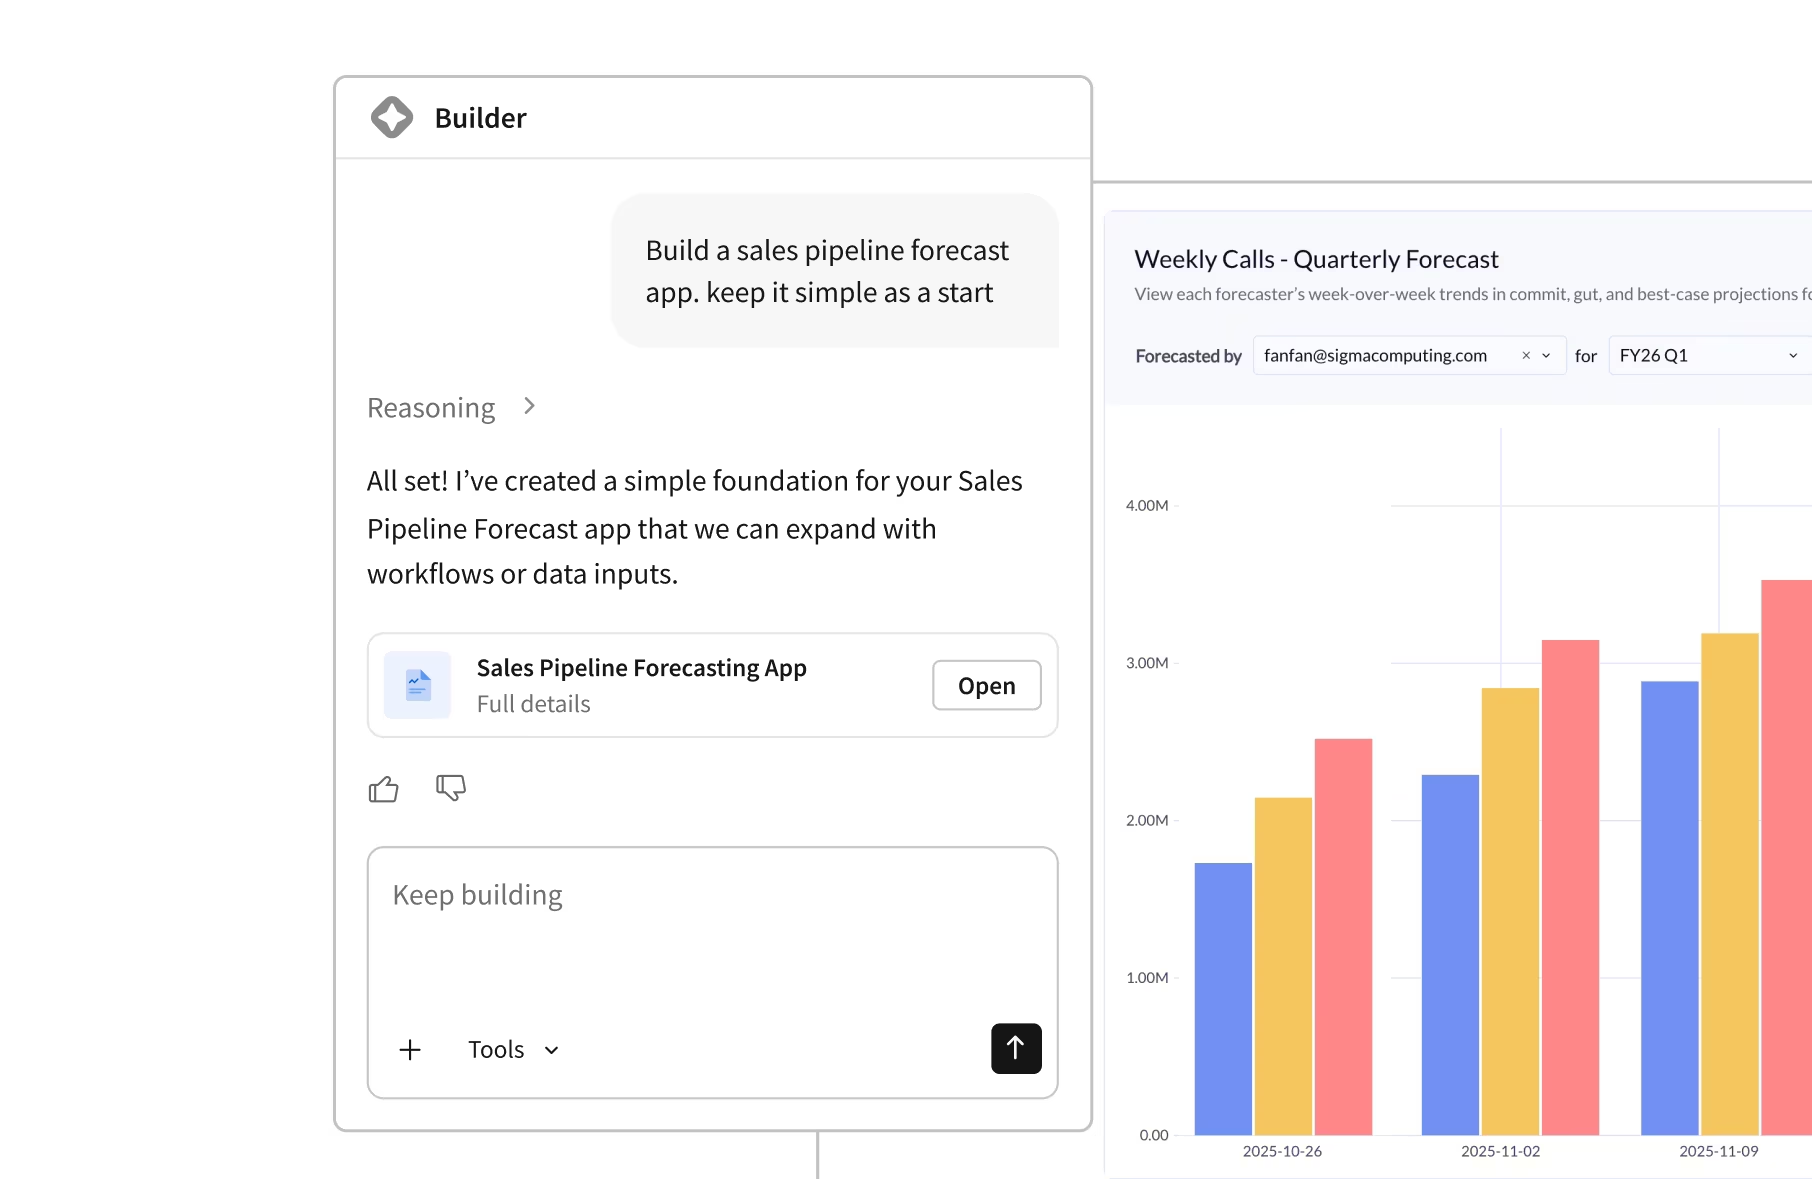
What-If Analysis
Scenario planning for demand and supply with real-time data
Embedded Analytics
Share insights with customers and partners through secure embedded dashboards
Drill-Down at Scale
Unlimited exploration from summary to transaction detail without performance limits

SOC 2

ISO/IEC 27701

GDPR

CCPA
Related Resources
Supply Chain Cost Optimization App
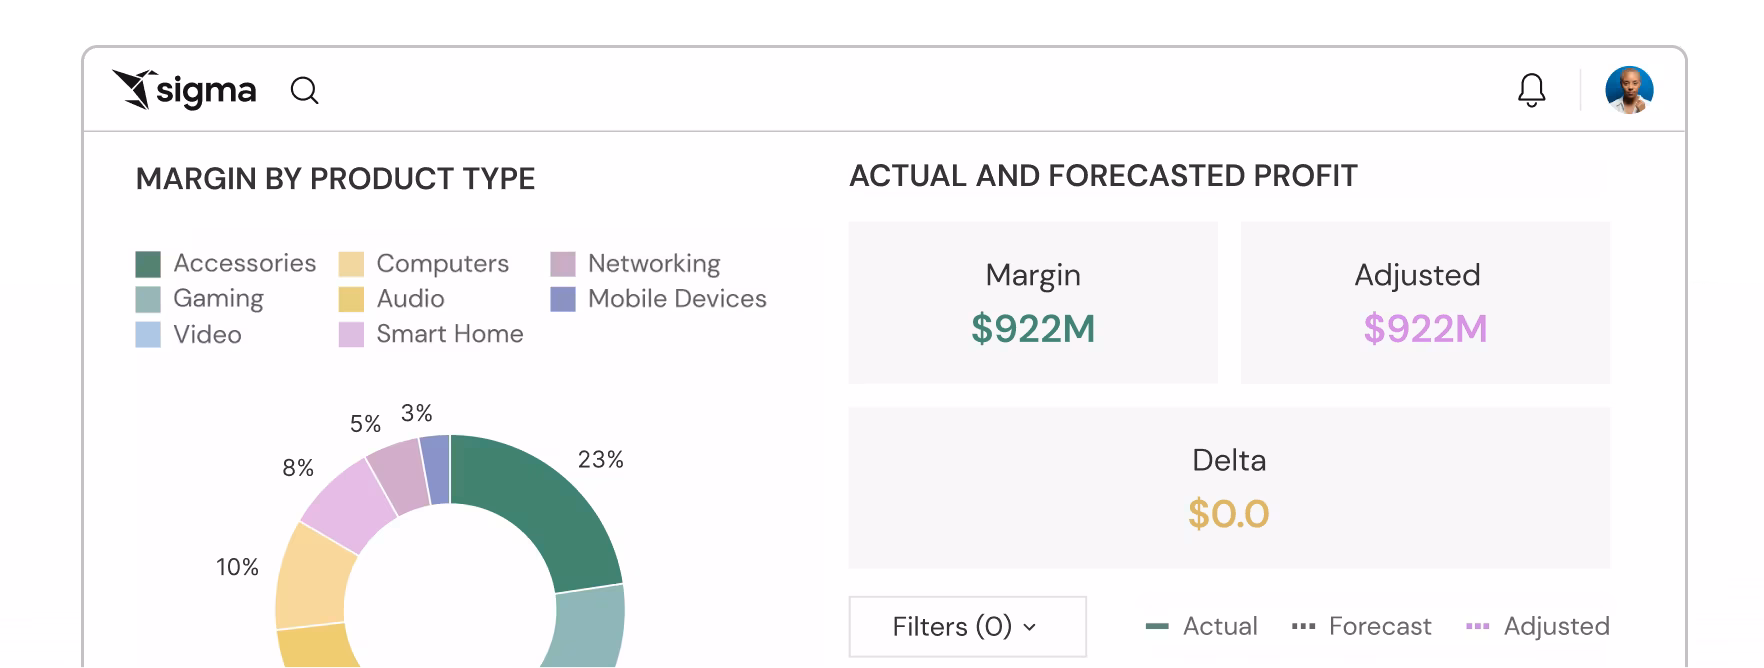
Visualize vehicle margins, forecast tariff impacts, and optimize suppliers in real time using live data, AI forecasting, and writeback.
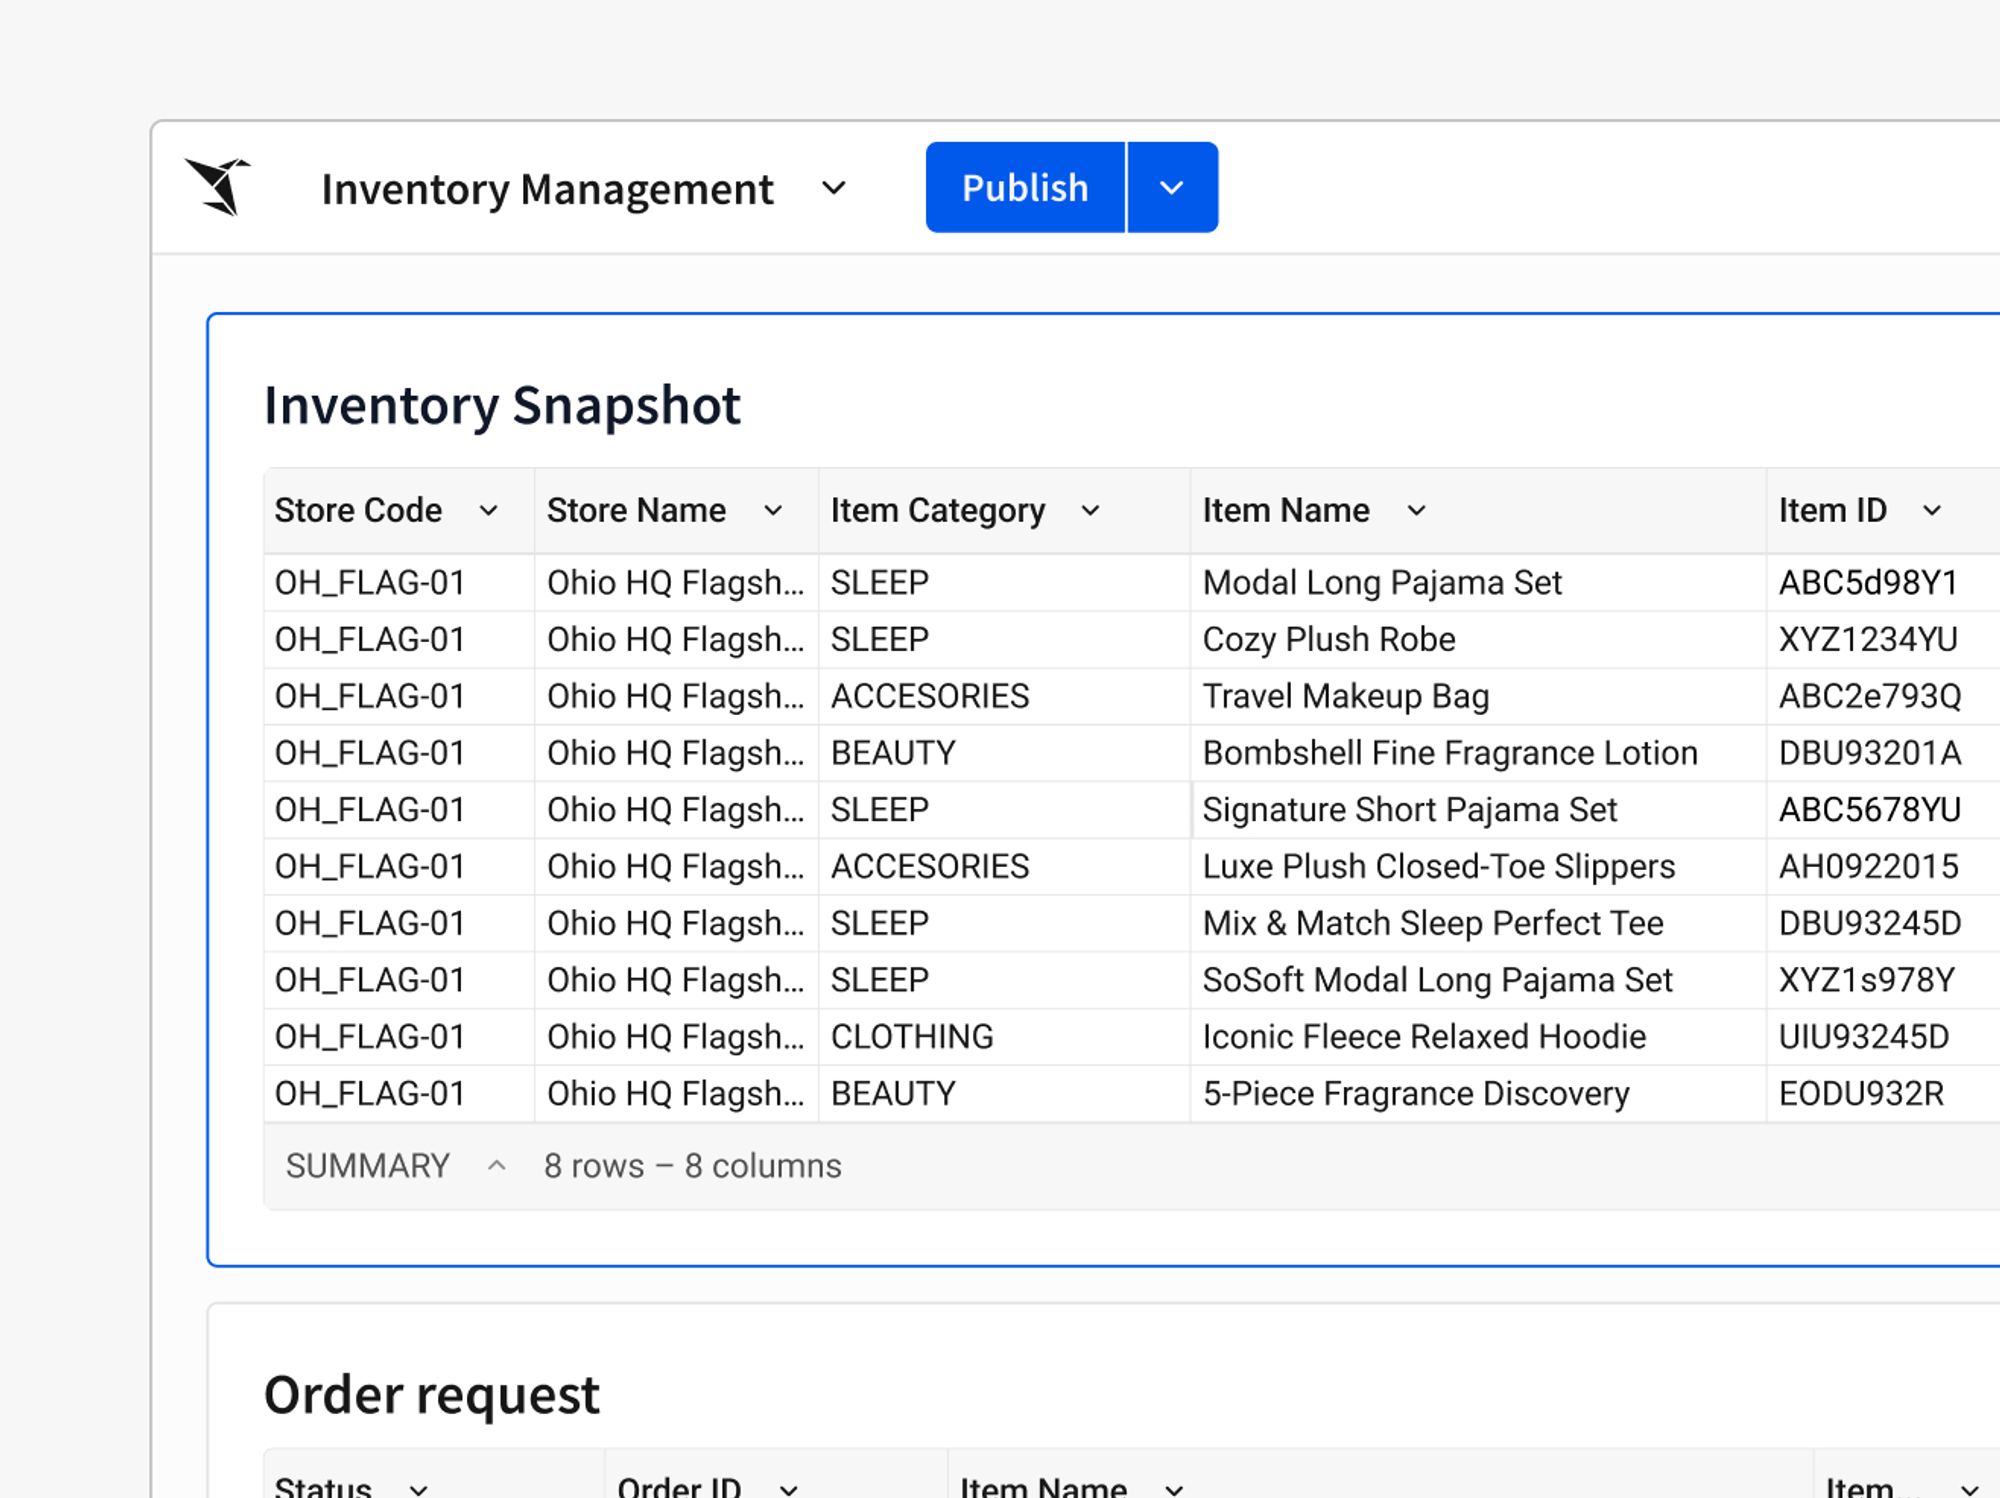
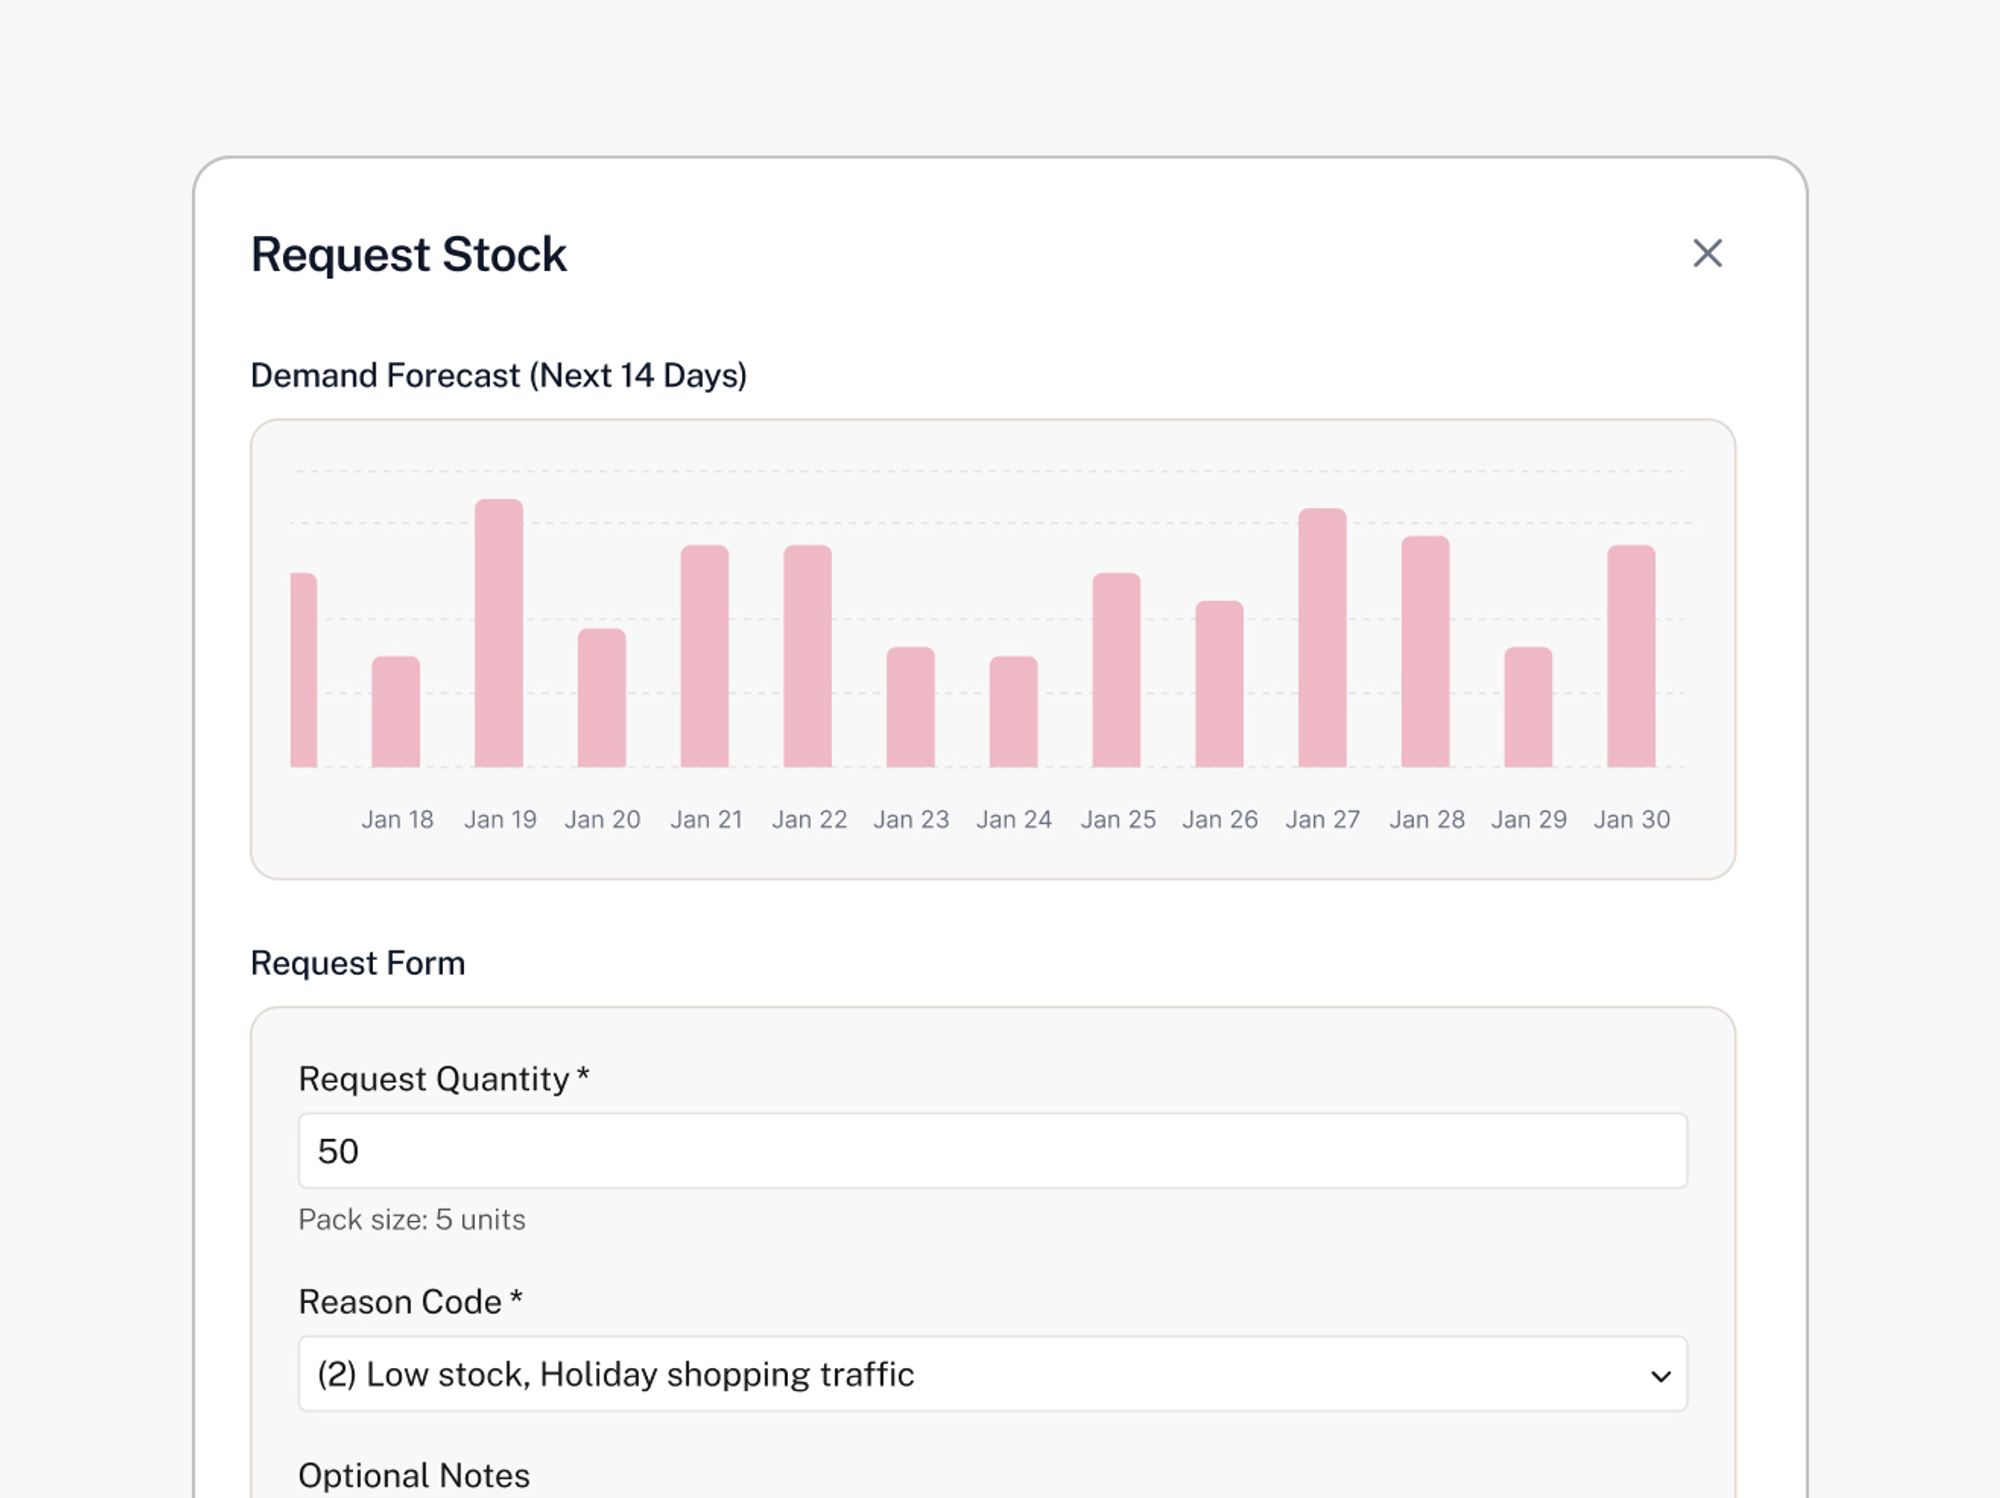
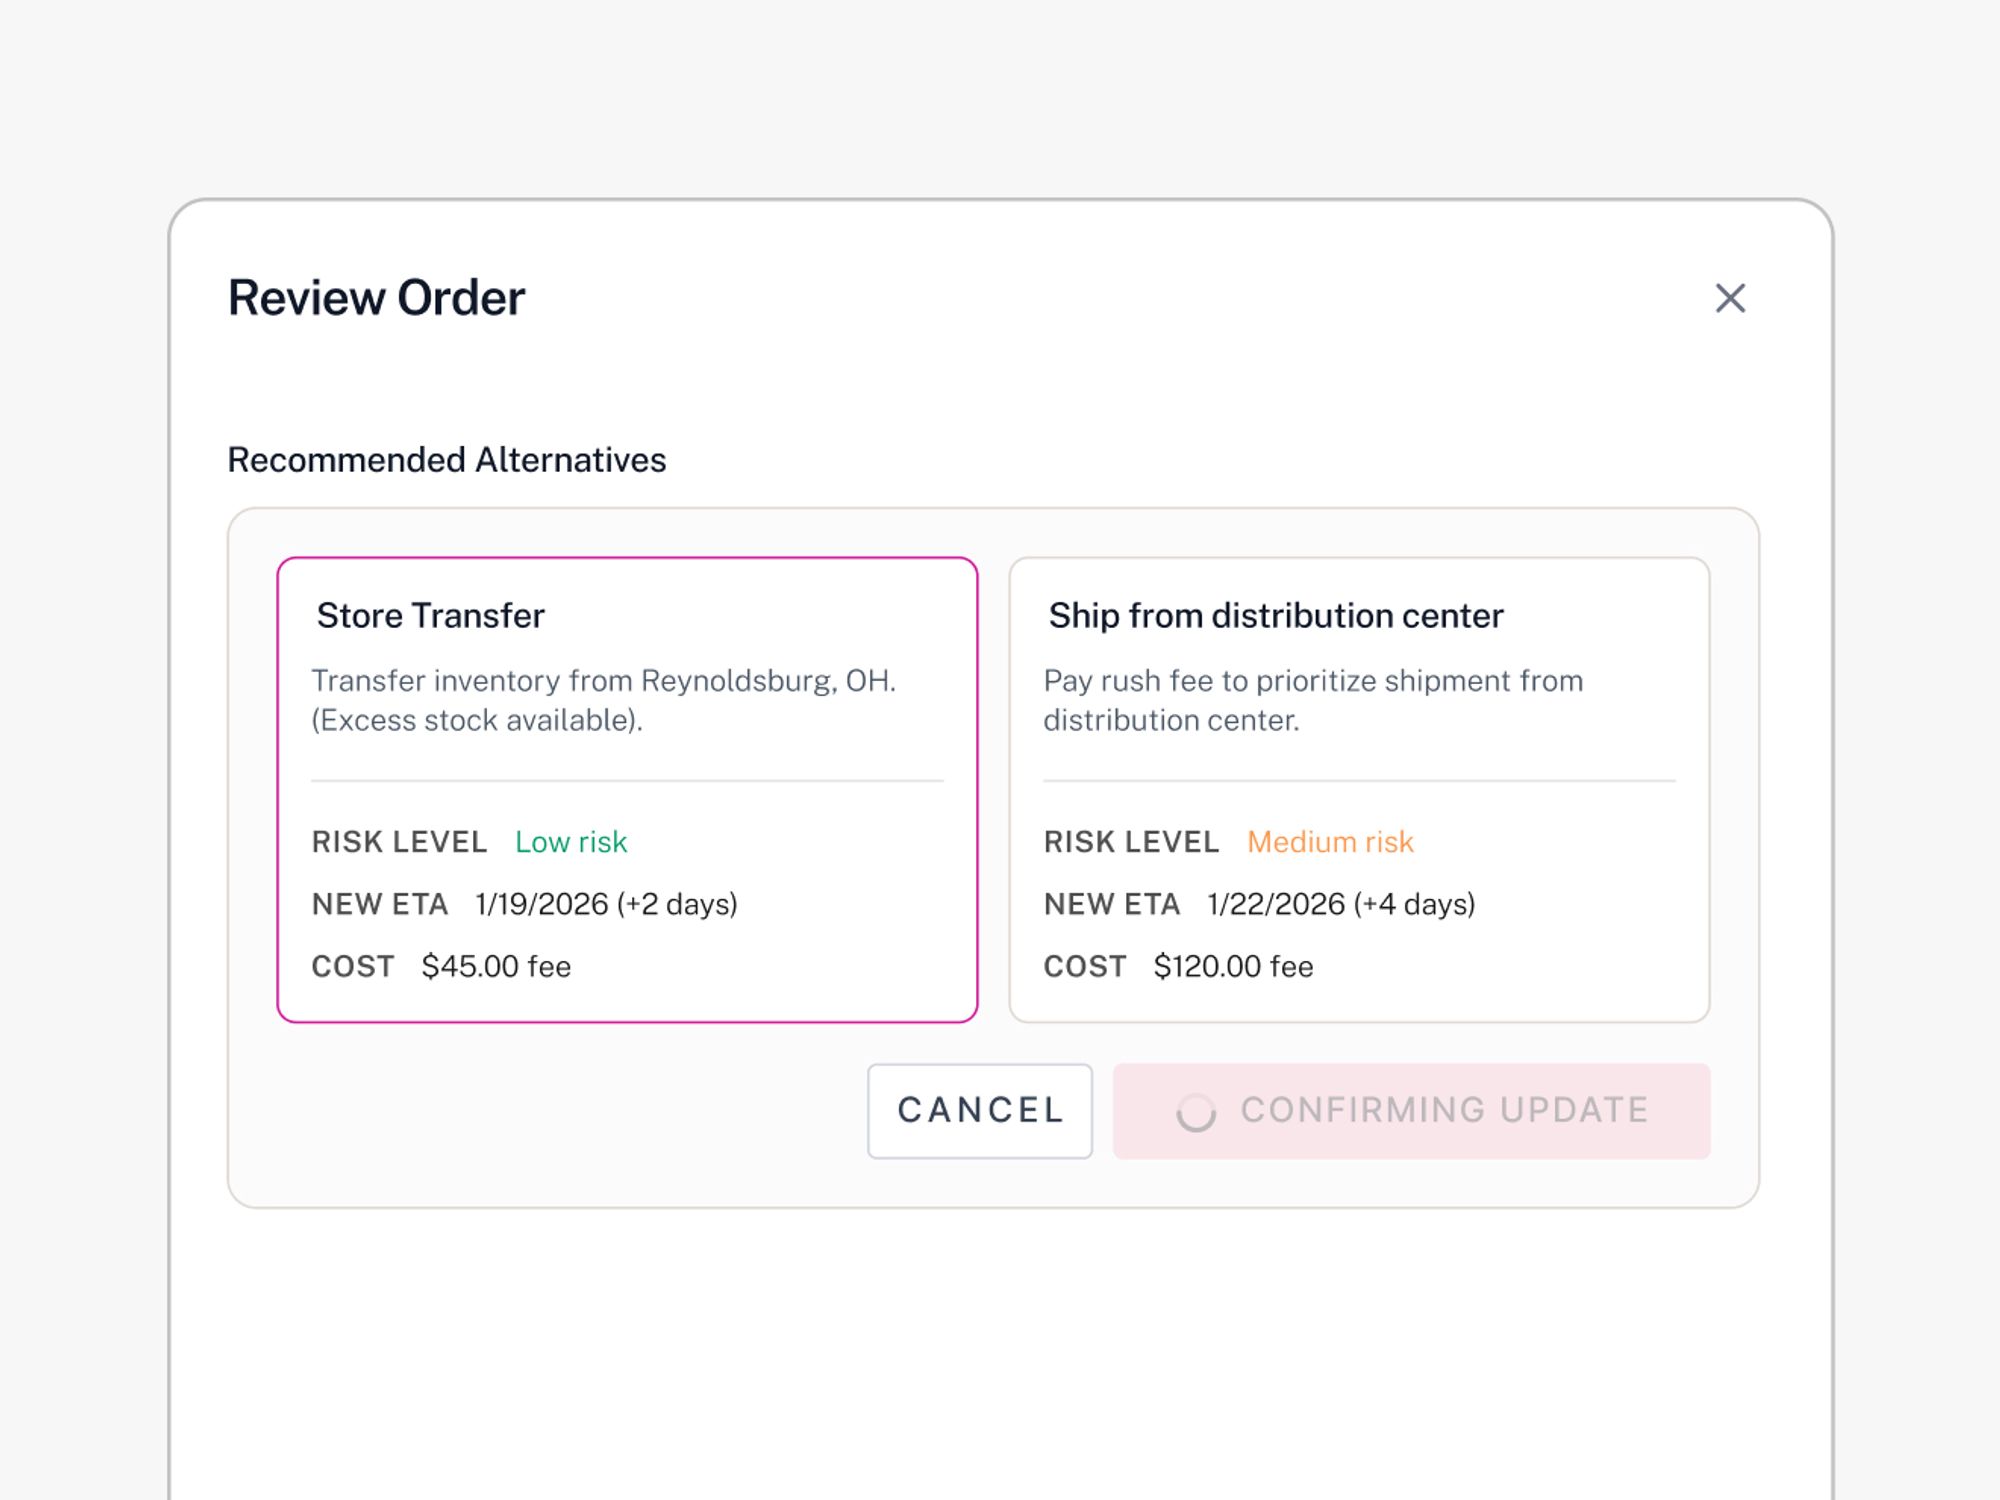
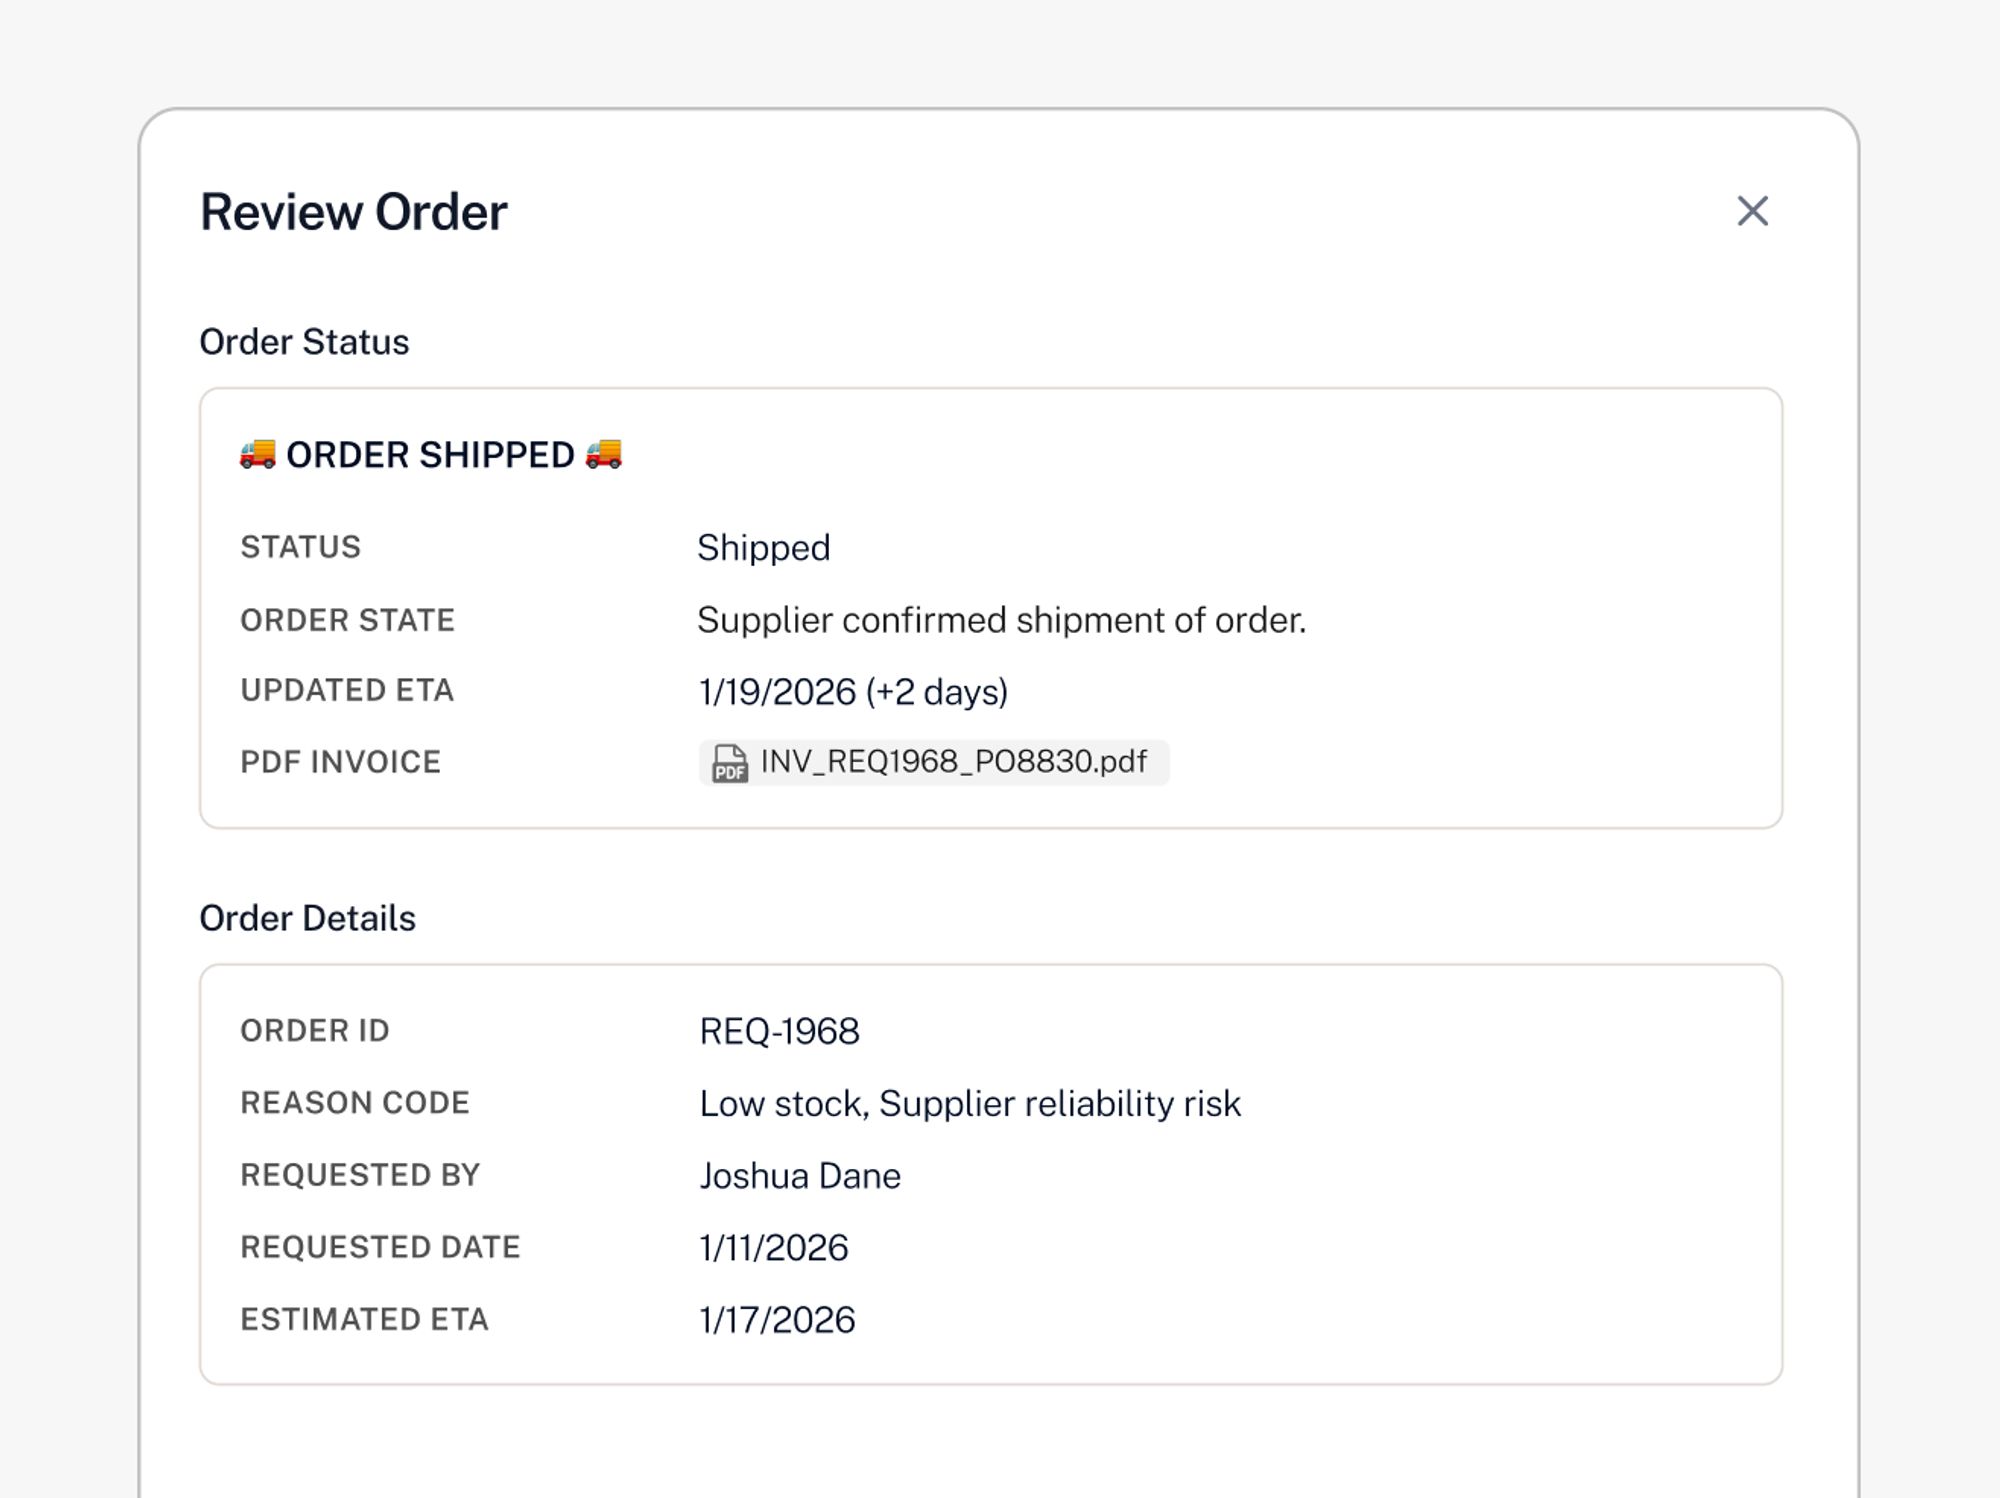
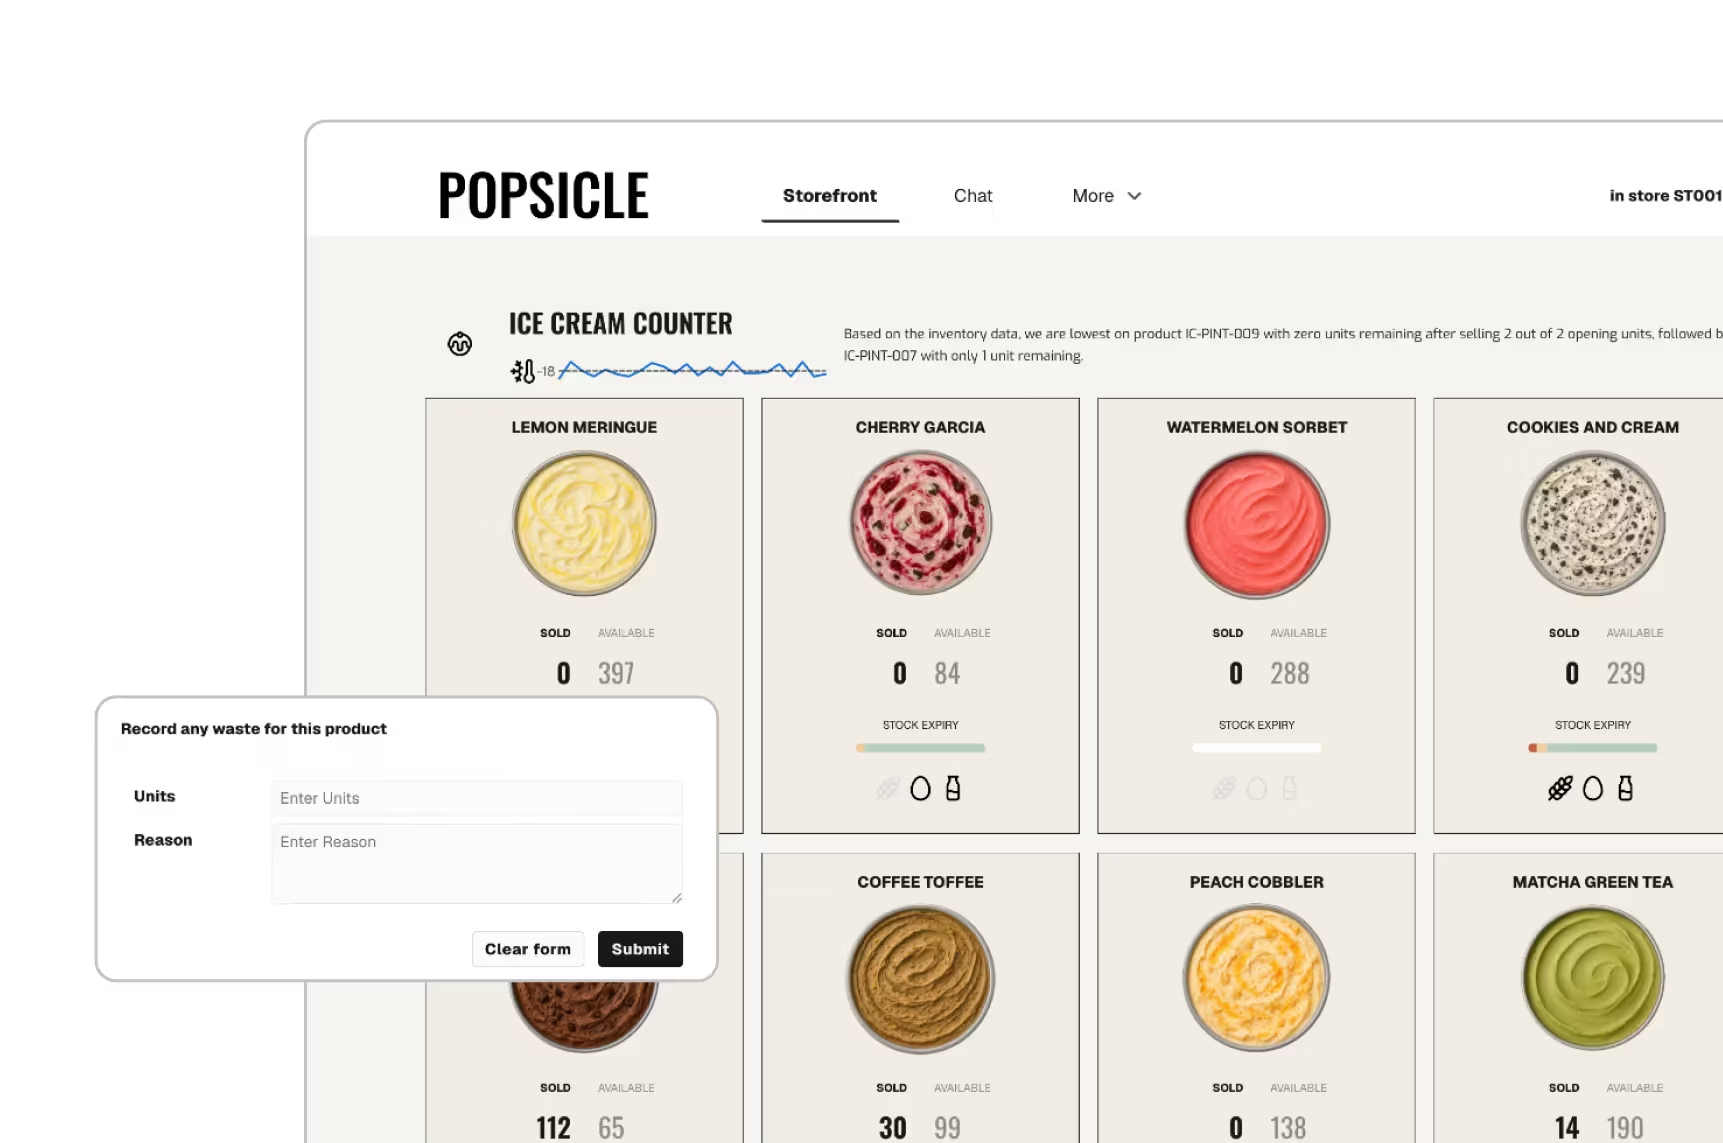
Supply Chain Tracking App
Optimize your supply chain and eliminate bottlenecks. Empower teams to track orders and update statuses instantly in a single interface, ensuring real-time visibility and operational efficiency.
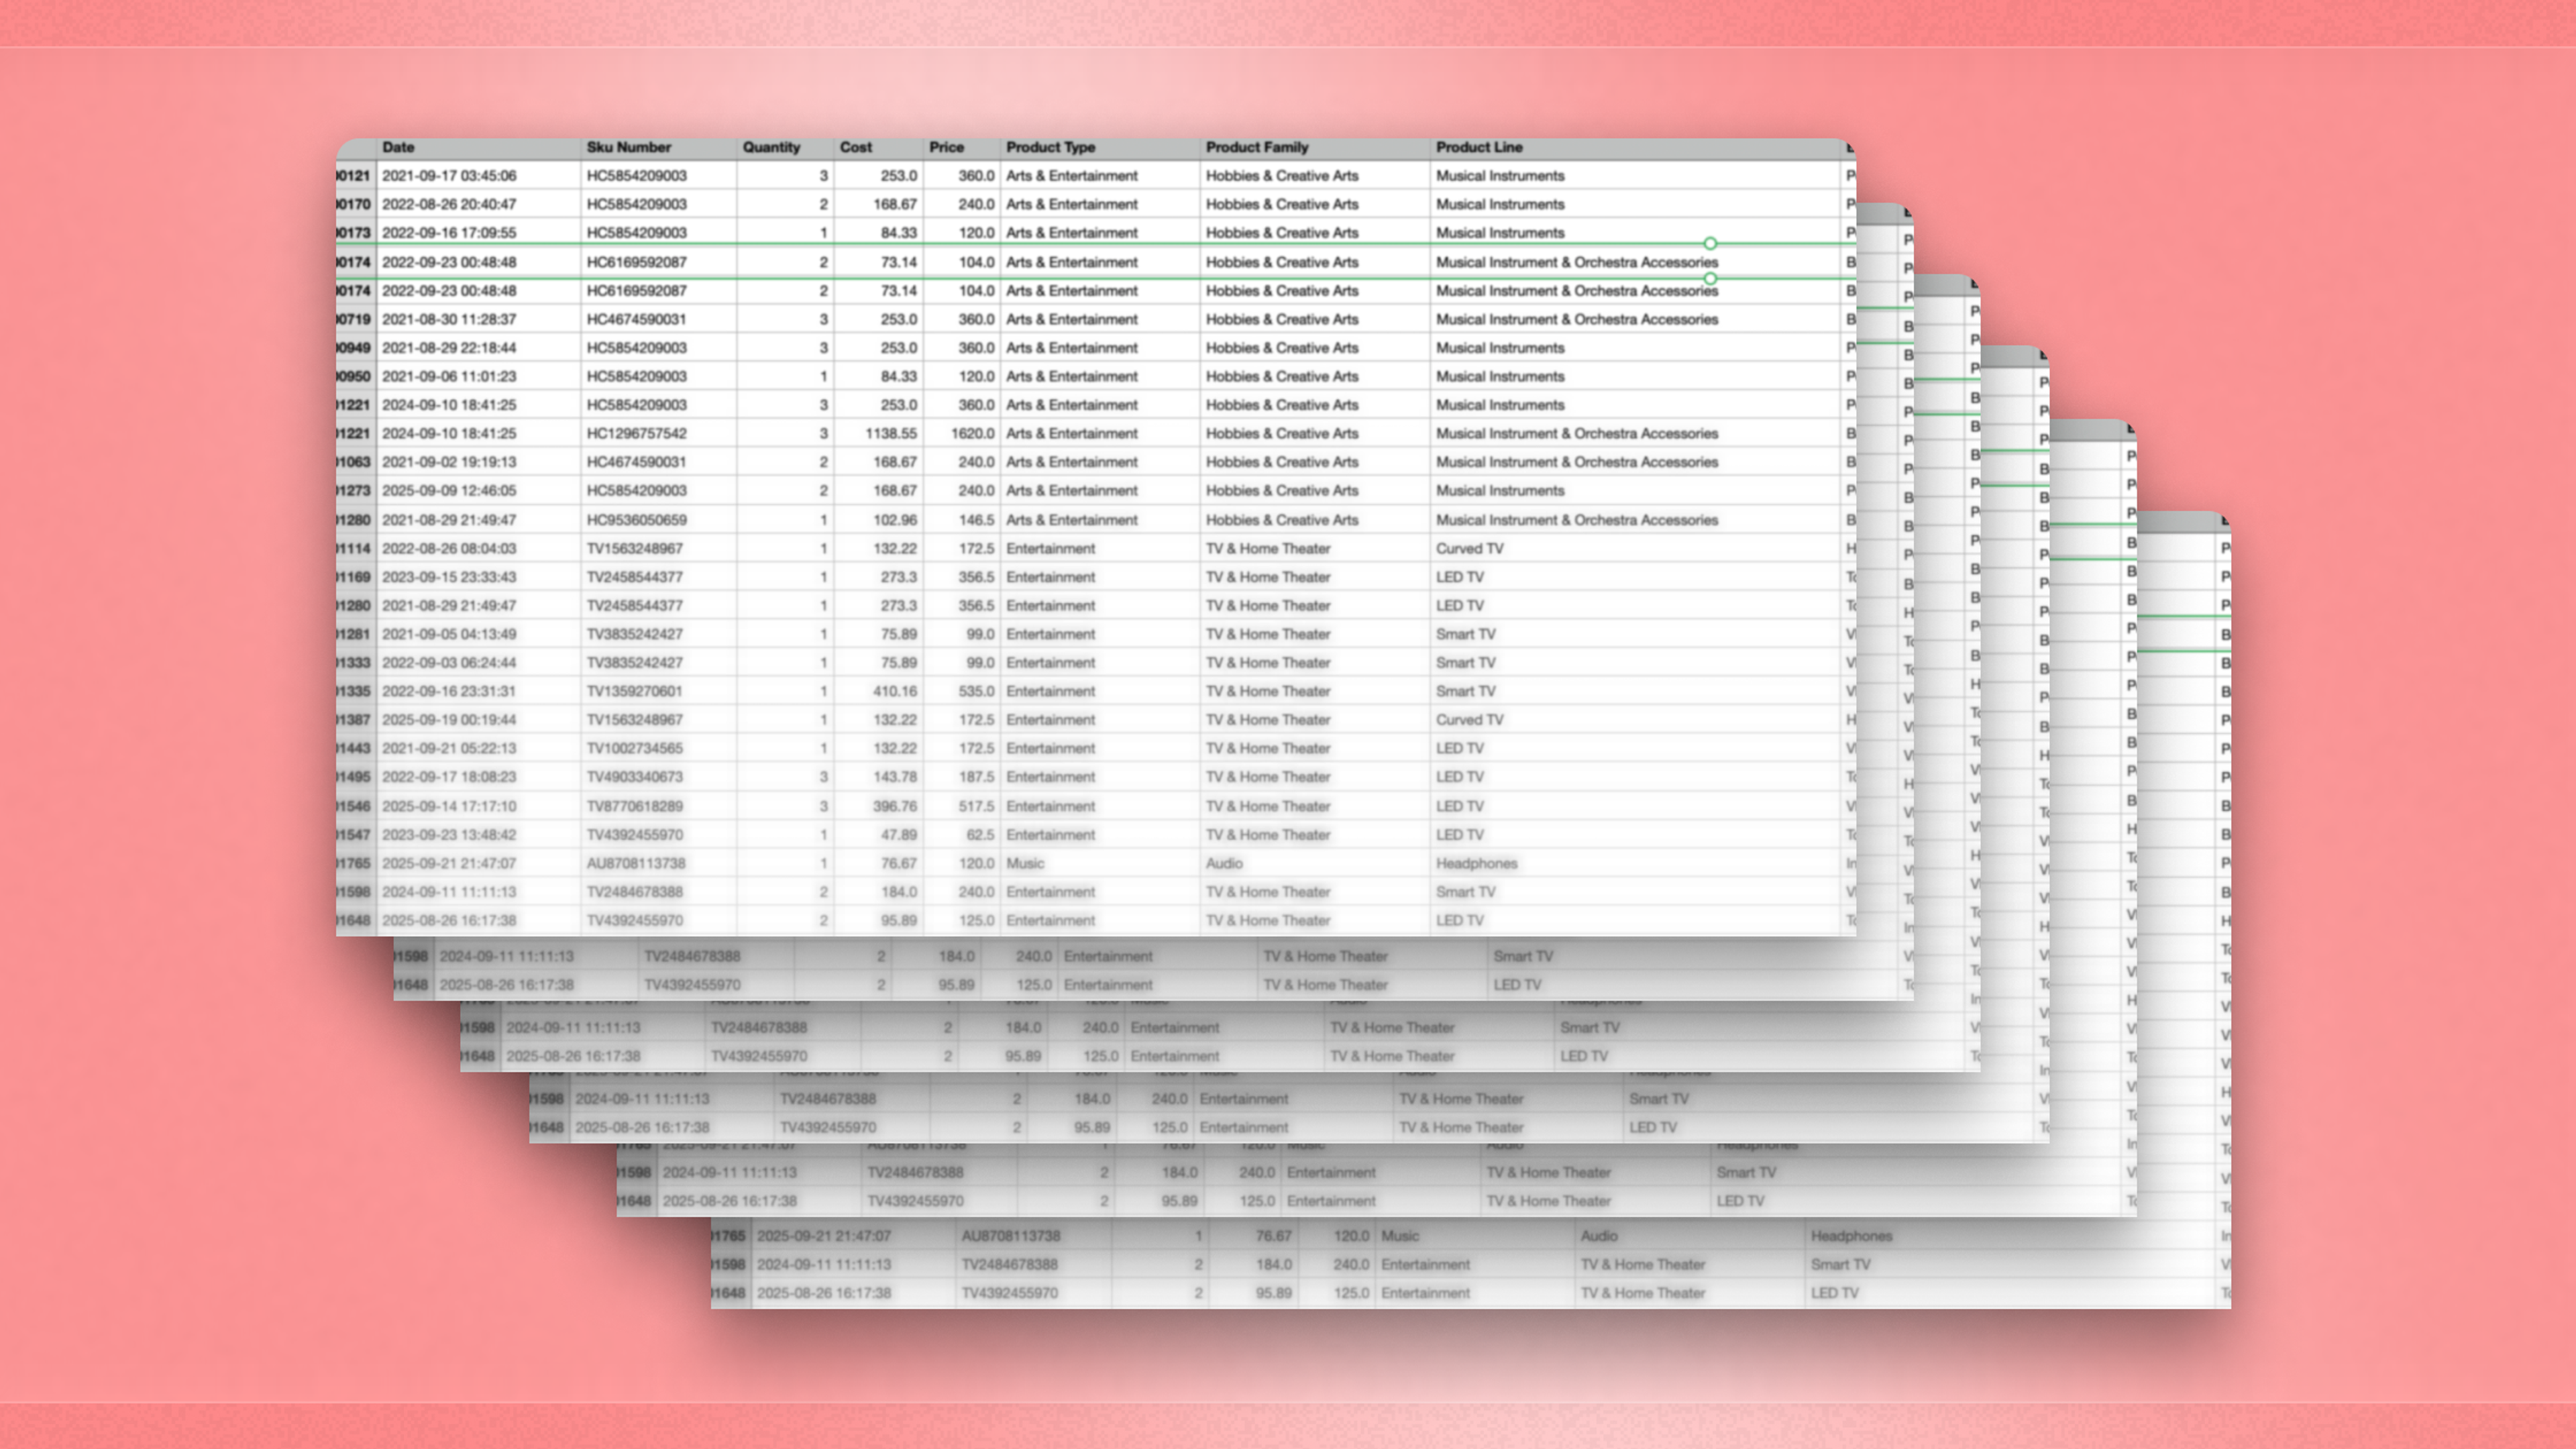
The Hidden Tax of Extracts
A technical walkthrough of the execution lanes: browser cache, Alpha Query, results cache via Stop moving data and start using it. Learn why the industry is shifting from scheduled extracts to live warehouse queries, ensuring your team always acts on a single, secure source of truth.query ID, materialization, and warehouse cache behavior.
Everything you need to analyze, report, and act
One platform for dashboards, reports, embedded analytics, and AI-powered insights.

Supply Chain FAQs
Common questions about supply chain with Sigma.