00
DAYS
00
HRS
00
MIN
00
SEC
AI AGENTS ON YOUR WAREHOUSE · LAUNCHING APRIL 2ND
REGISTER FREE
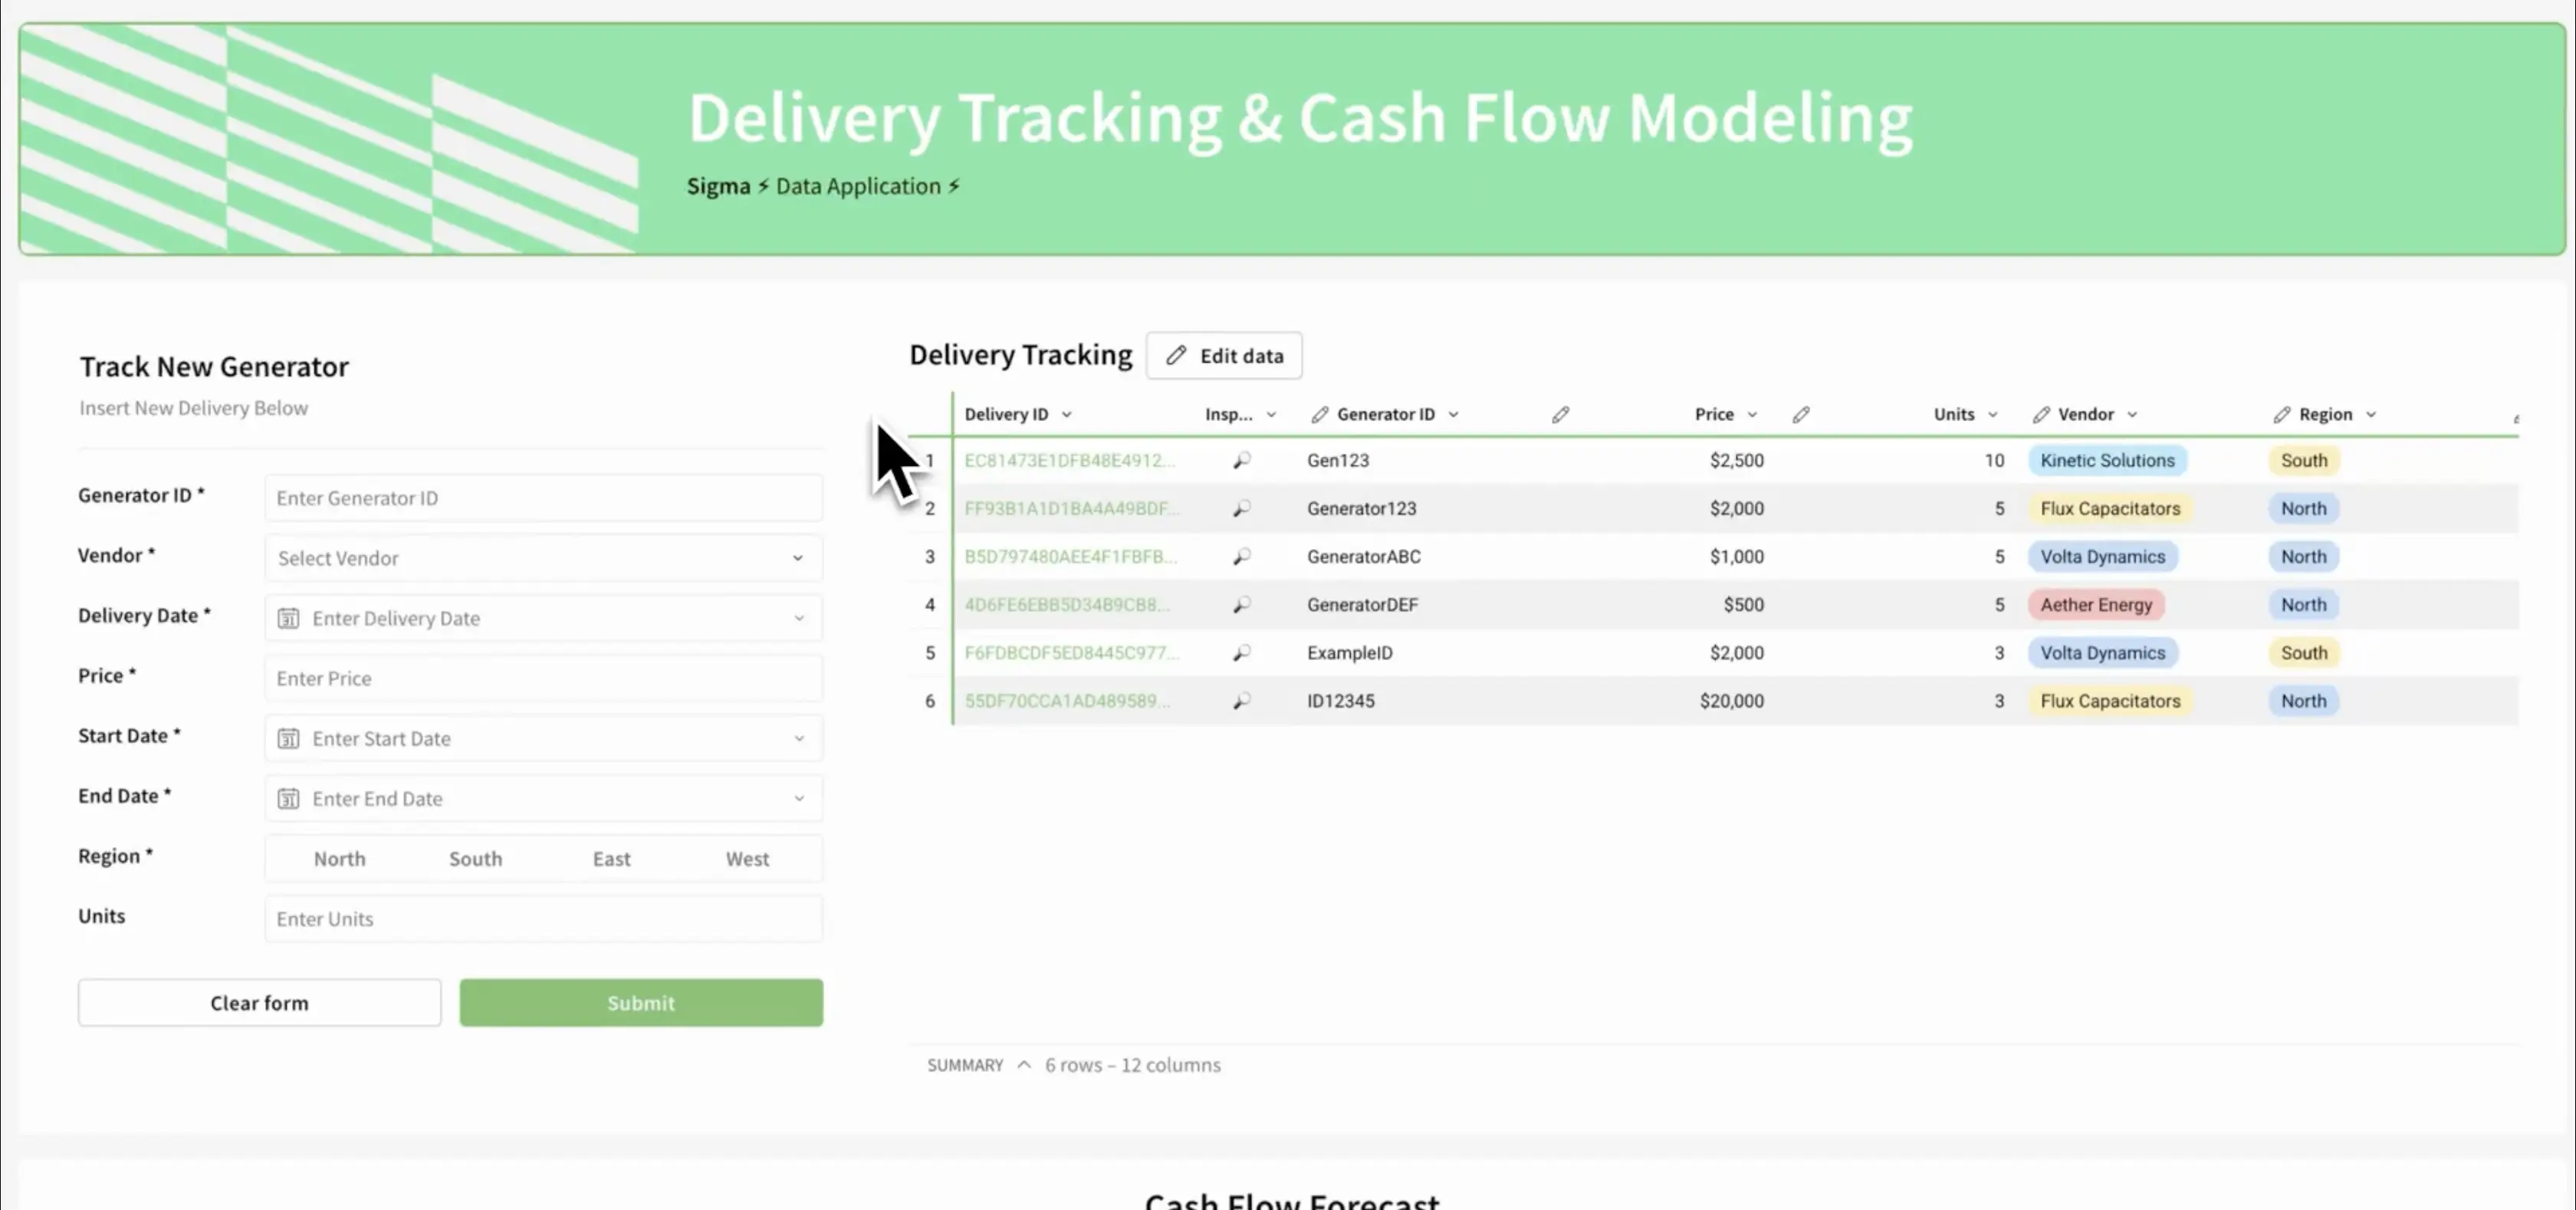
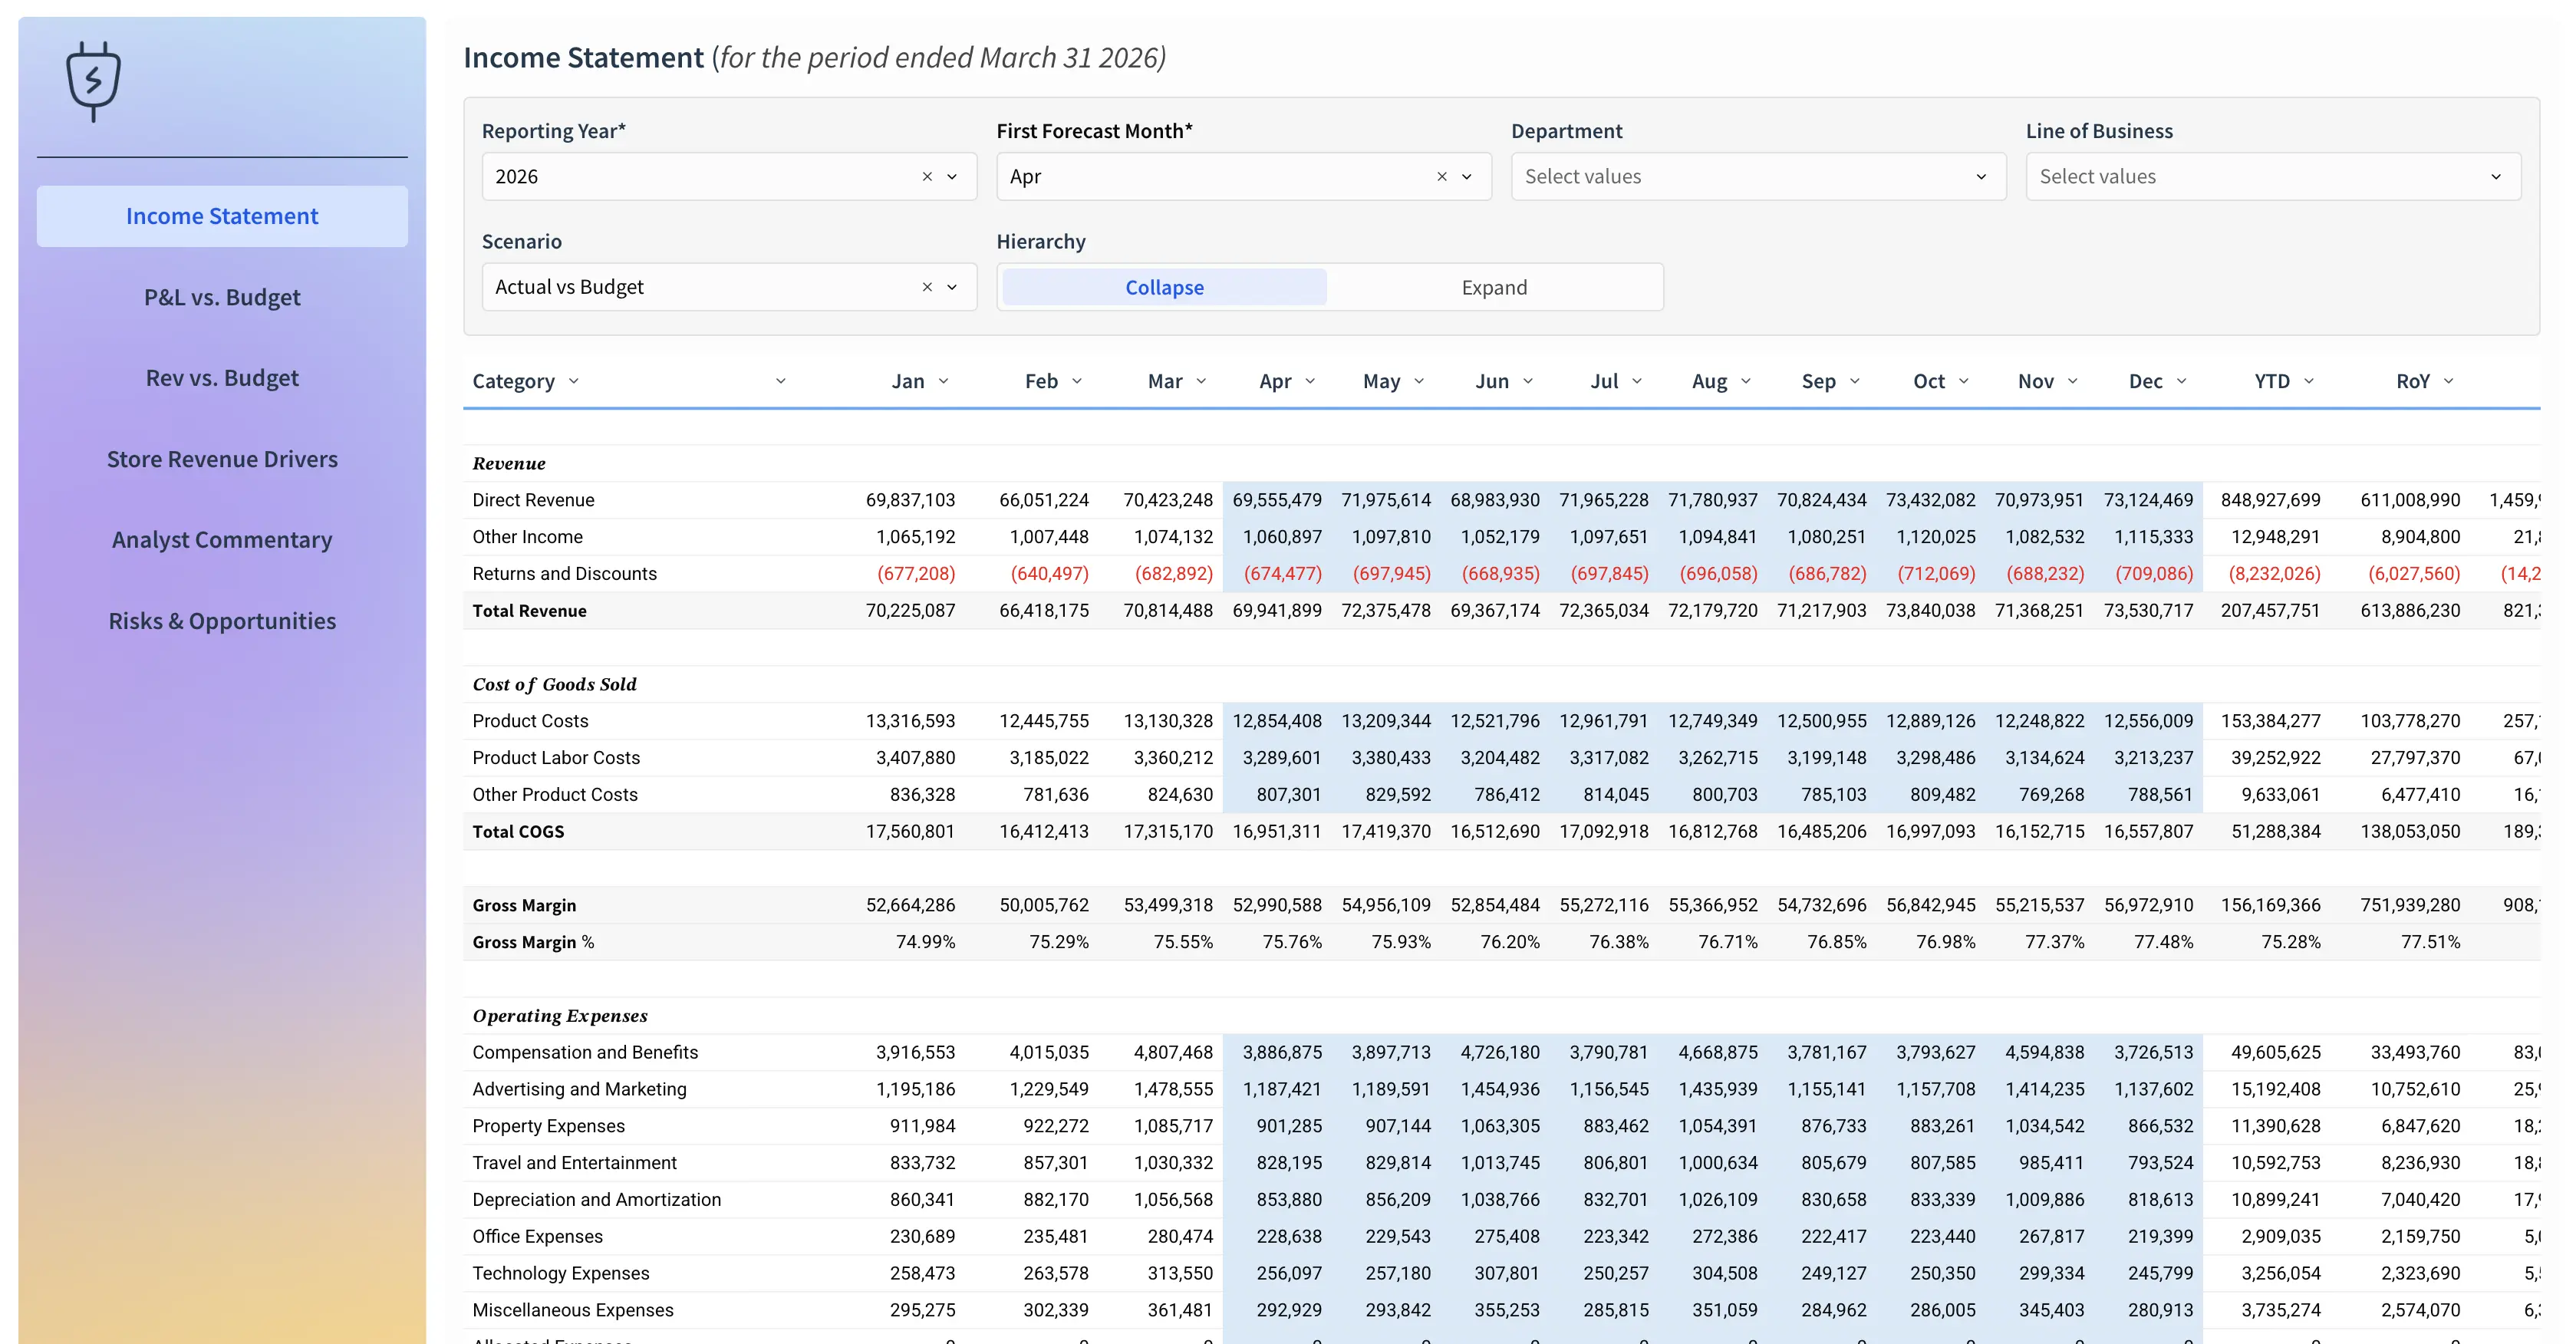
This Sigma Computing Expense Report Dashboard Example is a descriptive display showing how expenses are being spent by date (YTD, QTD, MTD), departments, expense type, expense subtype and employees.
The Expense Report Dashboard sample data comes from a data set called HR Expenses. The data used in this report consists of one table where each row denotes an expense. Every expense has a date, the name of the employee the expense is from, their department, the expense type, the expense subtype, and the expense amount.
This dashboard is for analysts and business users in finance and accounting teams. This report provides insights into expenses that can be used to track performance against a budget.
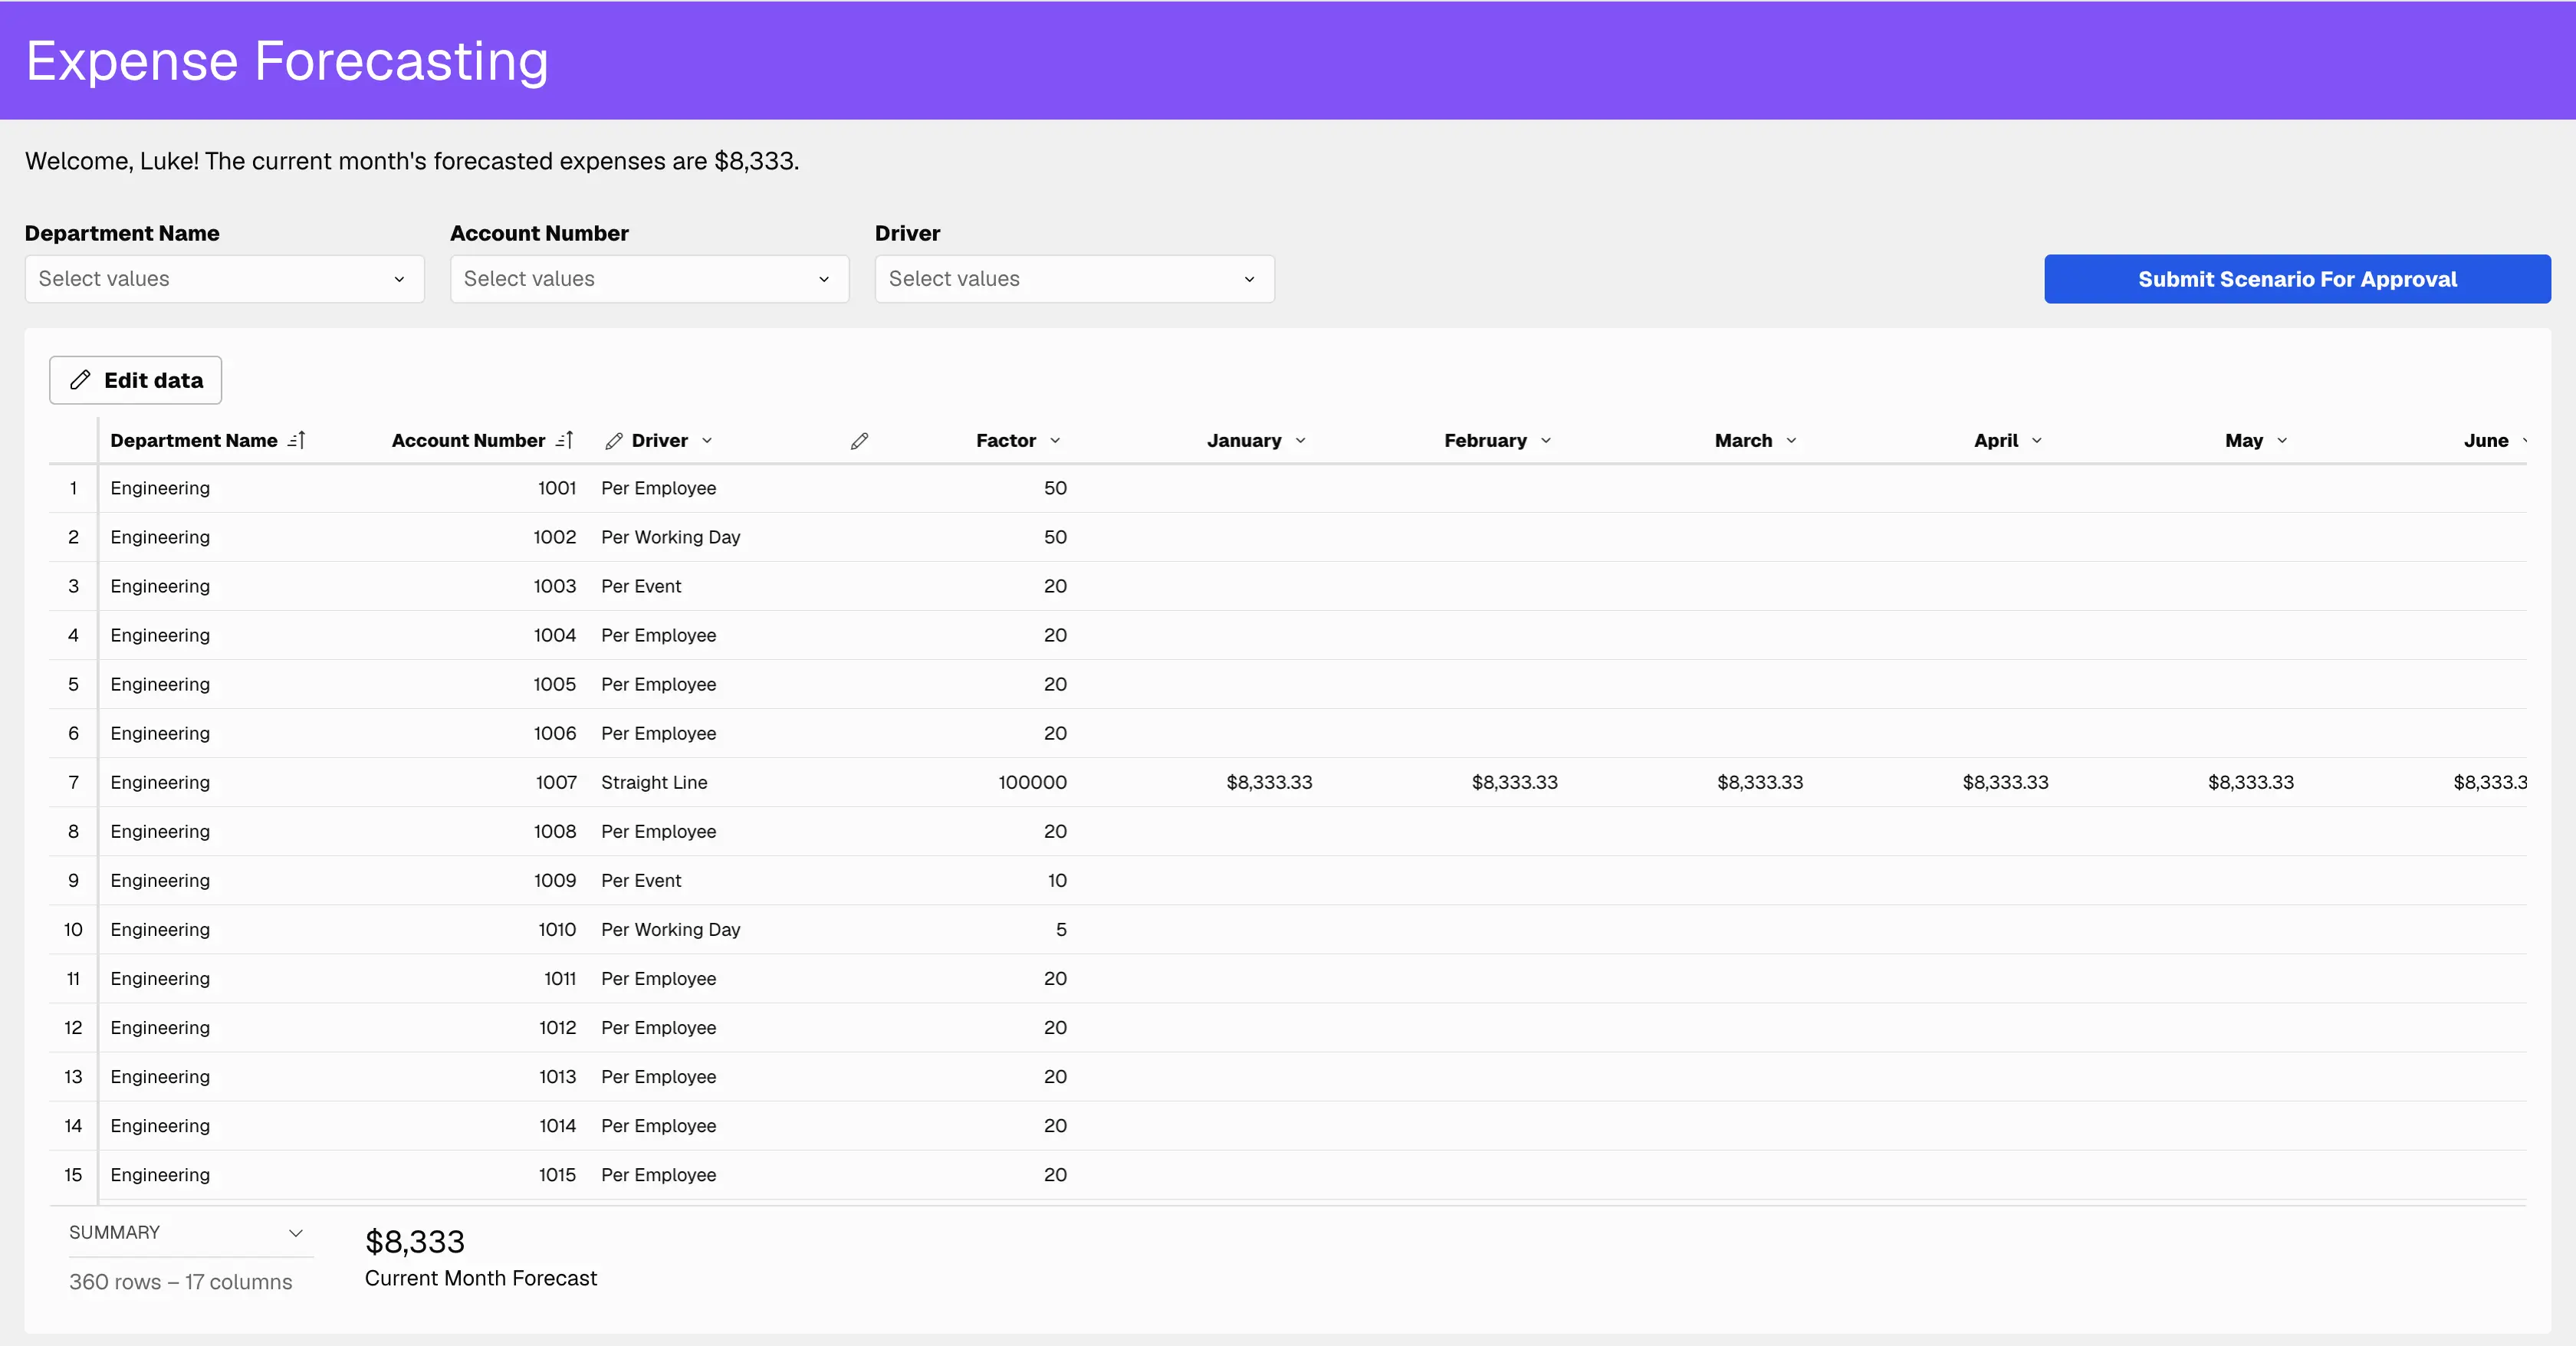
There are two parameters that are vital to making this dashboard work: the Relative Date and the Date Level Select parameters.
The Date Level Select parameter has three values to choose from: YTD, QTD and MTD. Since these parameters work together, the expenses shown on the report would be from the beginning of the Relative Date’s Year/Quarter/Month (which is set using Date Level Select) until the selected Relative Date.
The Relative data parameter allows for native functionality to select month to date, quarter to date, last 6 months, and anything in between. In Sigma, you do not have to spend time writing calculations for these selections – they come out of the box in a user friendly format.
Sigma is a powerful and easy to learn tool with exceptional data modeling and reporting capabilities. We hope you found this Sigma Expense Report Dashboard Example useful.
If you have any questions, need help, or are interested in having a team of Sigma experts design dashboards for you, feel free to reach out!