Metrikus Increases Operational Efficiencies by 25% with Sigma
With Sigma, Metrikus’ business domain experts can join the data modeling conversation and work with engineering to build curated datasets with relevant definitions, prejoins, and calculations.

Improvement in operational efficiency across the organization
Increase in the number of complex, ad hoc customer reports delivered
Faster product issue identification and resolution
Industry
- Technology
- Real Estate
- Embedded Analytics
Because of how easy it is to join and report out on data across the platforms sales, marketing, operations, and project management use, we finally have an end-to-end view of the business to help us make better, data-driven decisions.
The Challenge
Managing Complex Customer Reporting Requests and Getting a Full Picture of Business Operations
Metrikus’ IoT integration platform for smart buildings can integrate with any device, giving their clients a view into how safely and efficiently their offices operate. In a world still grappling with the COVID-19 pandemic, the platform is primarily used to combine measurements from air quality and occupancy sensors to provide additional insights and visibility into building, desk, and conference room operation, ensuring customers maintain a safe occupancy level.
While the Metrikus platform offers robust, customizable dashboards, there are instances where customers request reports that are outside the scale and scope of the product. These ad hoc requests typically require complex joins across multiple data sources, consolidating many different data types, and crunching through billions of data points at once. Metrikus’ partner, AirRated, is an example of this type of customer.
The complex reports AirRated requires took Metrikus’ engineering team an hour each week to manually create. “We knew it was unsustainable,” says Jack Rhodes, Project Manager at Metrikus. “The development queue for new product features was already 3-6 months. As a small business, we needed to do something to free up our valuable resources. It got to a point where we either had to make a change or it would begin to impact our ability to service our customers.”
There was no single source of truth into our business operations. We didn’t have a way to bring all this information together and get an accurate, clear representation of what was happening through the funnel and across the business without having to go back to engineering, who needed to focus on growing customer requests.Jack Rhodes Project Manager, Metrikus
At the same time, Metrikus’ operations team had limited visibility into the performance of the company’s core business units: sales, marketing, finance, and project management. Each team used its own tools and the high-level, pre-built dashboards they generate to measure performance, creating a series of organizational data silos.
Finally, the team’s operations department was spending 30 minutes each morning logging into every building in their portfolio to monitor sensor data and make sure their products were functioning properly. The team needed a more efficient way to manage sensor performance, quickly deliver ad hoc reporting requests to customers, and get a granular, full-funnel view of their business operations — all while freeing up precious engineering resources.
The Solution
Cloud-native BI Built for Organization-wide Data Exploration
As Metrikus surveyed BI solutions, one thing was clear: Their choice had to be cloud-native. “I had no interest in managing more infrastructure because we already manage enough,” says Sam Hall, Metrikus’ Head of Technology. After careful consideration of Looker, Sisense, and Sigma, Metrikus chose Sigma for a few critical reasons.
First, the flexibility of Sigma’s data modeling capabilities and the simplicity of its spreadsheet-like user interface democratize data across the organization. With Sigma, Metrikus’ business domain experts can join the data modeling conversation and work with engineering to build curated datasets with relevant definitions, prejoins, and calculations. Non-technical users are then able to independently access and analyze this data without writing any code using Sigma’s familiar interface, formulas, and functions. This makes it possible to generate complex, ad hoc reports for customers without having to go to engineering.
Data isn’t a barrier anymore.Sam Hall Head of Technology at Metrikus
“Data isn’t a barrier anymore,” Sam says. “Once a dataset has been set up, anyone in the company can go and generate any report they want or click into the dashboard to explore and manipulate data for their needs. And since AirRated is a key partner company, they can securely go into Sigma to build and edit their own dashboards and reports, and they love the tool too.”
Secondly, Sigma makes it easy for the operations team to connect and harness all the data in their Snowflake Data Cloud instance for a complete picture of business performance. The team uses Sigma to create more robust project management dashboards than what Asana offers out of the box, as well as to gain visibility into custom marketing fields that cannot be viewed in HubSpot.
“Because of how easy it is to join and report out on data across the platforms sales, marketing, operations, and project management use, we finally have an end-to-end view of the business to help us make better, data-driven decisions,” says Jack. “Without Sigma, we would have had to spend considerable time and money to hire staff to manually bring all this data together.”
Two other key capabilities Metrikus takes advantage of are Sigma’s embedded analytics and Snowflake usage dashboards. Embedded analytics makes it possible for Metrikus to embed Sigma’s dynamic dashboards within internal applications to securely share specific visualizations with partners, customers, and the public. Sigma’s Snowflake usage dashboards allow Metrikus to better monitor and understand their Snowflake query performance and compute costs.
The Results
Faster Sensor Issue Resolution, Increased Website Referral Traffic, and More
Using Sigma, Metrikus has been able to rapidly improve operational efficiencies by 25%. The company is now able to serve AirRated 25% more reports because business teams can generate these insights independently, without having to wait for help from engineering. “Sigma makes time and technical expertise non-issues. This directly impacts our customer experience, and allows engineering to prioritize building the features customers want,” says Jack.
Sigma also saves Metrikus significant time previously spent monitoring their building sensors. Rather than checking on each customer individually, the team now has all sensor data in a single Sigma dashboard that allows them to quickly spot and drill into any issues. “What used to take us 30 minutes a day to do manually only takes 30 minutes a month now because Sigma automatically updates and sends us this sensor dashboard every day,” says Jack. As a result, Metrikus can identify and remedy issues with their products 10x faster than before.
“Sigma allows us to be more proactive in our customer support and engagement. Instead of a customer coming to us about an offline sensor, we can reach out to them as soon as an issue is detected. It helps us build trust, improve satisfaction, and build credibility with our customers,” Jack continues.
Before Sigma, Metrikus had limited visibility into how their various marketing channels were performing once leads were handed off to sales, making it difficult to effectively optimize marketing resources. However, the ability to report against custom HubSpot properties and integrate sales and marketing data in Sigma has empowered the team to re-allocate time and budget toward the highest ROI channels.
“It’s a level of insight we simply wouldn’t have without Sigma,” says Jack. “One of the biggest and most impactful adjustments we were able to make thanks to this full-funnel view was to focus more on the sales that were most likely to convert. Since making this decision, we increased potential revenue by 10%.”
As a business that measures air quality and building occupancy, Metrikus is in a unique position to use their product to help report on the impacts of the COVID-19 pandemic. Using Sigma’s Embedded Analytics functionality, the marketing and engineering teams worked together to create a shareable dashboard that tracks how UK office space usage is changing over time in response to evolving government regulations. “Data from our Occupancy Index is currently featured on Bloomberg’s ticker, and was also picked up by the Telegraph,” shares Metrikus’ Head of Marketing, Charlotte Laing. “This gave us a nice 41% bump in website referral traffic.”
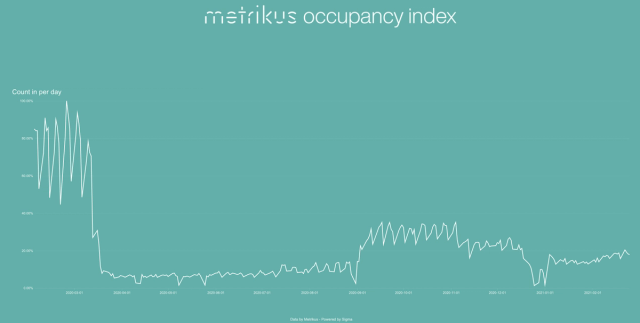
Metrikus’ Occupancy Index show that office occupancy doubled in the first half of September, and has returned to around a third of the levels before lockdown rules were introduced in March. – Bloomberg
Last but not least, Sigma’s Snowflake usage dashboard helps Metrikus identify specific areas to optimize their Snowflake queries and identify potential cost savings of 50%. “If we spot an anomaly on the usage dashboard, Sigma’s spreadsheet interface allows us to dig into the data underneath to easily filter out different types of queries and identify any inefficiencies driving up our costs,” Sam states. “Sigma helps us make sure we’re getting the most out of our Snowflake queries and that our compute costs deliver business outcomes.”
About Metrikus
Metrikus ’ mission is to make offices more productive, safe, and healthy places to work by gathering information from building systems and other sensors to help customers understand their properties. Metrikus’ dashboards provide 24/7, real-time information and insights into many areas, including critical asset maintenance, space utilization, and the health of a building’s physical environment.
Read more customer stories

 Customer Story
Learn how Persona delivers self-service analytics to hundreds of customers with Sigma, driving 8x adoption and dramatically faster insights.


Activate your data warehouse
Stop buying a new tool for every workflow. Build it once on governed data, then scale it across the business.